Erik Bernhardsson2024-04-07T23:56:37Zhttps://erikbern.com/Erik Bernhardssonmail@erikbern.comhttps://erikbern.com/public/favicon.icoPredicting solar eclipses with Python2024-04-07T00:00:00Zhttps://erikbern.com/2024/04/07/predicting-solar-eclipses-with-python.html<p>As I am en route to see my first total solar eclipse, I was curious how hard it would be to compute eclipses in Python.
It turns out, ignoring some minor coordinate system head-banging, I was able to get something half-decent working in a couple of hours.</p>
<p>I didn't want to go deep on celestial mechanics, so I decided to leverage Python's fantastic ecosystem for everything.
The package <a href="https://www.astropy.org/">Astropy</a> turns out to have about 80% of the stuff I wanted, in particular making it
quite straightforward to compute the position of the sun and the moon in the sky.
After just a few minutes of googling, I had something that computes the overlap between the sun and the moon
given a particular point on the Earth:</p>
<div class="highlight"><pre style="color:#f8f8f2;background-color:#272822;-moz-tab-size:4;-o-tab-size:4;tab-size:4"><code class="language-python" data-lang="python"><span style="color:#f92672">from</span> astropy.coordinates <span style="color:#f92672">import</span> EarthLocation, get_body
<span style="color:#f92672">from</span> astropy.time <span style="color:#f92672">import</span> Time
<span style="color:#f92672">from</span> astropy.units <span style="color:#f92672">import</span> deg, m
<span style="color:#66d9ef">def</span> <span style="color:#a6e22e">sun_moon_separation</span>(lat: float, lon: float, t: float) <span style="color:#f92672">-</span><span style="color:#f92672">></span> float:
loc <span style="color:#f92672">=</span> EarthLocation(lat<span style="color:#f92672">=</span>lat <span style="color:#f92672">*</span> deg, lon<span style="color:#f92672">=</span>lon <span style="color:#f92672">*</span> deg, height<span style="color:#f92672">=</span><span style="color:#ae81ff">0</span> <span style="color:#f92672">*</span> m)
time <span style="color:#f92672">=</span> Time(t, format<span style="color:#f92672">=</span><span style="color:#e6db74"></span><span style="color:#e6db74">"</span><span style="color:#e6db74">unix</span><span style="color:#e6db74">"</span>)
moon <span style="color:#f92672">=</span> get_body(<span style="color:#e6db74"></span><span style="color:#e6db74">"</span><span style="color:#e6db74">moon</span><span style="color:#e6db74">"</span>, time, loc)
sun <span style="color:#f92672">=</span> get_body(<span style="color:#e6db74"></span><span style="color:#e6db74">"</span><span style="color:#e6db74">sun</span><span style="color:#e6db74">"</span>, time, loc)
sep <span style="color:#f92672">=</span> moon<span style="color:#f92672">.</span>separation(sun)
<span style="color:#66d9ef">return</span> sep<span style="color:#f92672">.</span>deg
</code></pre></div><p>This takes a (latitude, longitude) pair as well as a unix timestamp and computes the angular separation between the sun and the moon.
Basically this means just the distance between the centers of the objects, seen in the sky from the Earth.
If the angular separation is very close to zero, we have a solar eclipse.</p>
<p>However! I didn't want to compute this for a <em>given coordinate</em>.
I wanted to compute the location of a total eclipse given a timestamp (if there is one).</p>
<p><em>Ideally,</em> we would grab 3D coordinates for the Earth, the sun, and the moon. Then project a line between the sun through the moon, see if that
line hits the Earth, and if it does, find the latitude and longitude of this intersection.
This is probably the “right” way to do it, and if I had time, I would brush the dust off my geometry skills and do this.</p>
<p>However, I don't have time! It's the day before the eclipse, and I just want to compute coordinates in the least arduous way possible.
We already have something that computes a related thing, but we need to flip things around a bit.
We're going to do this using a bulldozer I love using for stuff like this: black-box optimization.</p>
<h2 id="solving-for-the-coordinates-using-black-box-optimization">Solving for the coordinates using black-box optimization</h2>
<p>We have a function that takes (timestamp, latitude, longitude) and outputs the distance between the sun and the moon in the sky.
But let's instead try to solve this related problem:
Given a timestamp, find the latitude and the longitude that <em>minimizes</em> the distance between the sun and the moon in the sky.</p>
<p>If the minimum distance is essentially zero, this means that we found a solar eclipse.
In that case, the coordinate that minimizes the function is <em>the center of the sun's shadow on the Earth.</em></p>
<p>It's relatively straightforward to minimize an arbitrary function like this.
My go-to package for this is <a href="https://docs.scipy.org/doc/scipy/reference/optimize.html">scipy.optimize</a> which has a bunch of well-tested routines that are probably implemented in Fortran 77 if you dig deep enough. We don't even have the gradient for the function, but that's fine — <a href="https://en.wikipedia.org/wiki/Nelder%E2%80%93Mead_method">Nelder-Mead</a> is your friend.</p>
<p>The nice part of it is we can treat this function as a completely black-box and optimize it from the outside.
It does get somewhat computationally expensive, but it's not something I would personally lose sleep over.</p>
<p>The code to use <code>scipy.optimize.minimize</code> to find the eclipse location ends up like this:</p>
<div class="highlight"><pre style="color:#f8f8f2;background-color:#272822;-moz-tab-size:4;-o-tab-size:4;tab-size:4"><code class="language-python" data-lang="python"><span style="color:#66d9ef">def</span> <span style="color:#a6e22e">find_eclipse_location</span>(dt: datetime) <span style="color:#f92672">-</span><span style="color:#f92672">></span> tuple[float, float] <span style="color:#f92672">|</span> None
<span style="color:#e6db74"></span><span style="color:#e6db74">"""</span><span style="color:#e6db74">Return the coords of a total eclipse, or `None`.</span><span style="color:#e6db74">"""</span>
t <span style="color:#f92672">=</span> datetime<span style="color:#f92672">.</span>timestamp(dt)
fun <span style="color:#f92672">=</span> <span style="color:#66d9ef">lambda</span> x: sun_moon_separation(x[<span style="color:#ae81ff">0</span>], x[<span style="color:#ae81ff">1</span>], t)
ret <span style="color:#f92672">=</span> minimize(fun, bounds<span style="color:#f92672">=</span>[(<span style="color:#f92672">-</span><span style="color:#ae81ff">90</span>, <span style="color:#ae81ff">90</span>), (<span style="color:#f92672">-</span><span style="color:#ae81ff">180</span>, <span style="color:#ae81ff">180</span>)], x0<span style="color:#f92672">=</span>(<span style="color:#ae81ff">0</span>, <span style="color:#ae81ff">0</span>))
<span style="color:#66d9ef">return</span> ret<span style="color:#f92672">.</span>x <span style="color:#66d9ef">if</span> ret<span style="color:#f92672">.</span>fun <span style="color:#f92672"><</span> <span style="color:#ae81ff">1e-3</span> <span style="color:#66d9ef">else</span> None
</code></pre></div><p>Basically, we bind the time to <code>sun_moon_separation</code>, and construct a new function with 2 variables: latitude and longitude.
And then we search over this function (with bounds) to find the minimum.</p>
<p>This almost works! Well, part of the problem was that I wasted 2 hours because of a dumb sign error with latitudes and longitudes.
But even after fixing that, I ended up with weird spurious coordinates.</p>
<p>I <em>think</em> this is because of bogus minima, since I think the the antipode of one solution is another solution.
We should obviously discard solutions when you can't <em>see</em> the sun.
Two simple modifications makes the solver work super reliably:</p>
<ol>
<li>If the sun or moon is below the horizon, return some large number</li>
<li>Instead of using (0, 0) as the starting point, do a simple grid search over a few points on the Earth and pick the one with the smallest sun-moon distance.
Then use that point as the starting point for the optimization.</li>
</ol>
<p>My <a href="https://github.com/erikbern/eclipse-finder/blob/main/calculate.py">final code</a> for <code>sun_moon_separation</code> and <code>find_eclipse_location</code> ends up just a tiny bit more complex than what I shared above.
With these tricks, we now have a function that reliably takes any timestamp and figures out the latitude/longitude for a solar eclipse (if there is one).</p>
<h2 id="finding-_all_-the-eclipses">Finding <em>all</em> the eclipses</h2>
<p>Ok, so now let's find a bunch of eclipses! In particular, let's find the path of every eclipse in the 2020-2030 span.
This will require us to search over a <em>lot</em> of timestamps.</p>
<p>Alas, the <code>find_eclipse_location</code> function is pretty slow!</p>
<p>So what do we do? More tricks:</p>
<ol>
<li>Do a coarse search over the full decade, only probing every hour. If we identify an eclipse, do a more granular search and map out the path minute by minute.</li>
<li>Parallelize!!!</li>
</ol>
<p>I'm the CEO of <a href="https://modal.com">Modal</a>, which makes it super easy to take Python code and run it in the cloud.
Honestly I wasn't planning on using Modal for this, but scaling out computationally intensive functions is such an great use case for Modal that I immediately just grasped for it.</p>
<p>We can find all eclipses in the 2020-2030 period my adding a simple decorator to <code>find_eclipse_location</code> and then mapping over it.
The mapping code ends up looking like this:</p>
<div class="highlight"><pre style="color:#f8f8f2;background-color:#272822;-moz-tab-size:4;-o-tab-size:4;tab-size:4"><code class="language-python" data-lang="python"><span style="color:#66d9ef">def</span> <span style="color:#a6e22e">run</span>():
dt_a <span style="color:#f92672">=</span> datetime(<span style="color:#ae81ff">2020</span>, <span style="color:#ae81ff">1</span>, <span style="color:#ae81ff">1</span>, <span style="color:#ae81ff">0</span>, <span style="color:#ae81ff">0</span>, <span style="color:#ae81ff">0</span>, tzinfo<span style="color:#f92672">=</span>timezone<span style="color:#f92672">.</span>utc)
dt_b <span style="color:#f92672">=</span> datetime(<span style="color:#ae81ff">2030</span>, <span style="color:#ae81ff">1</span>, <span style="color:#ae81ff">1</span>, <span style="color:#ae81ff">0</span>, <span style="color:#ae81ff">0</span>, <span style="color:#ae81ff">0</span>, tzinfo<span style="color:#f92672">=</span>timezone<span style="color:#f92672">.</span>utc)
<span style="color:#75715e"># Compute evenly spaced datetimes</span>
dt <span style="color:#f92672">=</span> dt_a
dts <span style="color:#f92672">=</span> []
<span style="color:#66d9ef">while</span> dt <span style="color:#f92672"><</span> dt_b:
dts<span style="color:#f92672">.</span>append(dt)
dt <span style="color:#f92672">=</span> dt <span style="color:#f92672">+</span> timedelta(seconds<span style="color:#f92672">=</span><span style="color:#ae81ff">3600</span>)
<span style="color:#75715e"># Map over it using Modal!!!</span>
<span style="color:#66d9ef">for</span> tup <span style="color:#f92672">in</span> find_eclipse_location<span style="color:#f92672">.</span>map(dts):
<span style="color:#66d9ef">if</span> tup <span style="color:#f92672">is</span> <span style="color:#f92672">not</span> None:
<span style="color:#66d9ef">print</span>(<span style="color:#e6db74"></span><span style="color:#e6db74">"</span><span style="color:#e6db74">Found eclipse at</span><span style="color:#e6db74">"</span>, tup)
</code></pre></div><h2 id="plotting-it">Plotting it</h2>
<p>I'm glossing over a few details in the <a href="https://github.com/erikbern/eclipse-finder">actual code</a>, but bear with me.
Once we have all the paths, we can plot them.
I used <a href="https://matplotlib.org/basemap/stable/">Basemap</a> and got something half-decent pretty quickly:</p>
<div class="highlight"><pre style="color:#f8f8f2;background-color:#272822;-moz-tab-size:4;-o-tab-size:4;tab-size:4"><code class="language-python" data-lang="python"><span style="color:#f92672">from</span> matplotlib <span style="color:#f92672">import</span> pyplot
<span style="color:#f92672">from</span> mpl_toolkits.basemap <span style="color:#f92672">import</span> Basemap
<span style="color:#66d9ef">def</span> <span style="color:#a6e22e">plot_path</span>(dts: list[datetime], lats: list[float], lons: list[float]):
<span style="color:#75715e"># Set up a world map </span>
pyplot<span style="color:#f92672">.</span>figure(figsize<span style="color:#f92672">=</span>(<span style="color:#ae81ff">6</span>, <span style="color:#ae81ff">6</span>))
lat_0, lon_0 <span style="color:#f92672">=</span> lats[len(lats) <span style="color:#f92672">/</span><span style="color:#f92672">/</span> <span style="color:#ae81ff">2</span>], lons[len(lons) <span style="color:#f92672">/</span><span style="color:#f92672">/</span> <span style="color:#ae81ff">2</span>]
bm <span style="color:#f92672">=</span> Basemap(projection<span style="color:#f92672">=</span><span style="color:#e6db74"></span><span style="color:#e6db74">"</span><span style="color:#e6db74">ortho</span><span style="color:#e6db74">"</span>, lat_0<span style="color:#f92672">=</span>lat_0, lon_0<span style="color:#f92672">=</span>lon_0)
bm<span style="color:#f92672">.</span>drawmapboundary(fill_color<span style="color:#f92672">=</span><span style="color:#e6db74"></span><span style="color:#e6db74">"</span><span style="color:#e6db74">navy</span><span style="color:#e6db74">"</span>)
bm<span style="color:#f92672">.</span>fillcontinents(color<span style="color:#f92672">=</span><span style="color:#e6db74"></span><span style="color:#e6db74">"</span><span style="color:#e6db74">forestgreen</span><span style="color:#e6db74">"</span>, lake_color<span style="color:#f92672">=</span><span style="color:#e6db74"></span><span style="color:#e6db74">"</span><span style="color:#e6db74">blue</span><span style="color:#e6db74">"</span>)
bm<span style="color:#f92672">.</span>drawcoastlines()
<span style="color:#75715e"># Plot eclipse path</span>
x, y <span style="color:#f92672">=</span> bm(lons, lats)
bm<span style="color:#f92672">.</span>plot(x, y, color<span style="color:#f92672">=</span><span style="color:#e6db74"></span><span style="color:#e6db74">"</span><span style="color:#e6db74">red</span><span style="color:#e6db74">"</span>)
</code></pre></div><p>I added a few more things in my final script, including local times by using <a href="https://github.com/jannikmi/timezonefinder">timezonefinder</a> to look up local timezones from (latitude, longitude) pairs.</p>
<p>This is what the eclipse tomorrow (on 2024-04-08) looks like if we plot it using the script:</p>
<p><img src="https://erikbern.com/assets/eclipse/eclipse-2024-04-08.png" alt="eclipse"></p>
<p>Gorgeous!</p>
<p>Actually this probably isn't award-winning in terms of design quality, but it feels fairly decent for something as a starting point —
the point here isn't necessarily to win design awards, but to find eclipses in ~100 lines of Python.</p>
<p>Which the script does! In fact, it finds all the eclipses in the 2020-2030 period:</p>
<ul>
<li><a href="/assets/eclipse/eclipse-2020-06-21.png">2020-06-21</a> over Africa, Middle East, and Asia</li>
<li><a href="/assets/eclipse/eclipse-2020-12-14.png">2020-12-14</a> over a tiny bit of South America</li>
<li><a href="/assets/eclipse/eclipse-2021-06-10.png">2021-06-10</a> over northern Canada and Greenland</li>
<li><a href="/assets/eclipse/eclipse-2021-12-04.png">2021-12-04</a> over Antarctica</li>
<li><a href="/assets/eclipse/eclipse-2023-04-20.png">2023-04-20</a> over Australia and Papua New Guinea</li>
<li><a href="/assets/eclipse/eclipse-2023-10-14.png">2023-10-14</a> over USA, Central America, and South America</li>
<li><a href="/assets/eclipse/eclipse-2024-04-08.png">2024-04-08</a> over Mexico, USA and Canada (tomorrow!!)</li>
<li><a href="/assets/eclipse/eclipse-2024-10-02.png">2024-10-02</a> over a tiny bit of South America (again?)</li>
<li><a href="/assets/eclipse/eclipse-2026-02-17.png">2026-02-17</a> over a tiny bit of Antarctica (will anyone see it?)</li>
<li><a href="/assets/eclipse/eclipse-2026-08-12.png">2026-08-12</a> over Greenland and Spain</li>
<li><a href="/assets/eclipse/eclipse-2027-02-06.png">2027-02-06</a> over a tiny bit of South America (a third time??)</li>
<li><a href="/assets/eclipse/eclipse-2027-08-02.png">2027-08-02</a> over North Africa and Middle East</li>
<li><a href="/assets/eclipse/eclipse-2028-01-26.png">2028-01-26</a> over South America and Spain</li>
<li><a href="/assets/eclipse/eclipse-2028-07-22.png">2028-07-22</a> over Australia and New Zealand</li>
</ul>
<p>This does indeed look identical to other lists I found online, which is quite reassuring.</p>
<p>Total runtime is a few minutes thanks to Modal.</p>
<p>It is admittedly a bit of a brute-force approach to do it this way, and I'm sure NASA has a version in C++ that runs 1000 times faster.
However, the brute-force approach is such a obvious winner in terms of developer productivity, even ignoring the fact that we also plotted maps!</p>
<h2 id="notes">Notes</h2>
<ul>
<li>Lucky bastards in the south of South America catching three eclipses in a decade.</li>
<li>The code is <a href="https://github.com/erikbern/eclipse-finder">here</a> if you want to check it out!.</li>
<li>I was somewhat inspired by <a href="https://writings.stephenwolfram.com/2024/03/computing-the-eclipse-astronomy-in-the-wolfram-language/">this blog post doing something similar in Mathematica</a>
and I guess I have to say I'm impressed with the amount of eclipse-related functions in Mathematica?</li>
<li>Credits to <a href="https://stackoverflow.com/questions/75268690/using-astropy-to-generate-solar-eclipse-conditions-based-on-my-location">Stackoverflow code here</a> for a starting point in my code</li>
<li>I ignored the difference between <a href="https://en.wikipedia.org/wiki/Solar_eclipse#Types">annular and total eclipses</a> in my code, although this probably isn't super hard to fix.</li>
<li>I also didn't compute the <em>width</em> of the path of totality, i.e. the width of the sun's shadow on the Earth. Just the path of the center of that shadow.</li>
</ul>
Simple sabotage for software2023-12-13T00:00:00Zhttps://erikbern.com/2023/12/13/simple-sabotage-for-software.html<p>CIA produced a fantastic book during the peak of World War 2 called <a href="https://www.cia.gov/static/5c875f3ec660e092cf893f60b4a288df/SimpleSabotage.pdf">Simple Sabotage</a>. It laid out various ways for infiltrators to ruin productivity of a company. Some of the advice is timeless, for instance the section about “General interference with Organizations and Production”:</p>
<ol>
<li>Insist on doing everything through “channels”. Never permit short-cuts to be taken in order to expedite decisions.</li>
<li>Make “speeches”. Talk as frequently as possible and at lengths. Illustrate your “points” by long anecdotes and accounts of personal experience. Never hesitate to make a few “patriotic” comments.</li>
<li>When possible, refer all matters to committees for “further study and consideration”. Attempt to make committees as large as possible — never less than five.</li>
<li>Bring up irrelevant issues as frequently as possible.</li>
<li>Haggle over precise wordings of communications, minutes, resolutions.</li>
<li>Refer back to matters decided upon at the last meeting and attempt to re-open the question of the advisability of that decision.</li>
<li>Advicate “caution”. Be “reasonable” and urge your fellow conferees to be “reasonable” and avoid haste which might result in embarrassments or difficulties later on.</li>
<li>Be worried about the propriety of any decision — raise the question of whether such action as is contemplated lies within the jurisdiction of the group or whether it might conflict with the policy of some higher echelon.</li>
</ol>
<p>I guess I've always been fascinated with how well this has stood the test of time? I even got this particular section framed and hung up at our office:</p>
<p><img src="https://erikbern.com/assets/simple_sabotage.jpeg" alt="simple sabotage"></p>
<h1 id="your-mission">Your mission</h1>
<p>Let's say you were employed as a CTO behind the front lines and you wanted to destroy productivity for as long as you can without getting caught. You can of course make a series of <em>obviously</em> bad decisions, but you'd get fired quickly. The real goal here is to sap the company of its productivity slowly, while maintaining a façade of plausibility and normalcy. What are some things you can do?</p>
<h2 id="technology">Technology</h2>
<ul>
<li>When joining, require a 6-18 months rewrite of core systems. Blame the previous CTO.</li>
<li>Encourage everyone use their own language and frameworks.</li>
<li>Split systems along arbitrary boundaries: maximize the number of systems involved in any feature.</li>
<li>Encourage a complex dev setup: running a service mesh with a dozen services at a minimum.</li>
<li>Make sure production environment differs from developer environments in as many ways as possible.</li>
<li>Deploy as infrequently as possible. Urge extreme caution about deployments. Leverage any production issue as a reason to “pull the brakes”.</li>
<li>Introduce very complex processes for code change and common workflows. Blame it on “security” or “compliance”.</li>
<li>Make sure every task is tracked in a task tracker and has been reviewed, prioritized, and signed off by a group of at least five people.</li>
<li>Disallow anything outside the scope of the original task, such as code cleanup or other drive-by improvements.</li>
<li>Build in-house versions of almost anything that's <em>not</em> a core competency. Justify it by “avoiding vendor lock-in”.</li>
<li>Insist on adding abstraction layers on top of everything. Use vendors that are themselves abstractions and then add extra layers of abstractions.</li>
<li>Encourage technical decisions based on wildly optimistic expectations of scale. Plan for at least 3 orders of magnitude more load than you have.</li>
<li>Encourage communal ownership of systems. Make sure no one feels responsible for maintenance.</li>
<li>Insist on centralizing almost everything as a “platform” owned by the “platform team”. Understaff the platform team and prevent other teams from building anythings that the platform might “own”.</li>
<li>Make the platform team iterate on APIs frequently and mandate that other teams refactor their code to the latest version as frequently as possible.</li>
<li>Hire “architects” and require even small changes to have an “architecture review”.</li>
<li>Require even small changes to have a “security review”.</li>
</ul>
<h2 id="product">Product</h2>
<ul>
<li>Dismiss useful metrics on academic grounds (e.g. “biased” or “lagging indicator”).</li>
<li>Pick vanity metrics with little or no correlation with business value and high amount of noise.</li>
<li>Insist on anything to be done as a “big bet” and insist on everything to be completely done before deployed.</li>
<li>Consider every feature a “must-have” and critical part of “version zero”. Do not budge.</li>
<li>Develop incredibly detailed “strategic” plans.</li>
<li>Pivot frequently.</li>
<li>Dismiss obvious improvements as “local optimization”.</li>
<li>Use latest trends to tie up resources. Kickstart a vacuous “AI strategy” that seems plausible at the surface. Spend heavily on vendors and consultants for these.</li>
<li>Encourage product managers to spend most of their time on “strategy” and “planning”.</li>
<li>Make it hard/impossible for engineers and product manager to use the product internally.</li>
<li>Dismiss users as “stupid” internally.</li>
</ul>
<h2 id="leadership">Leadership</h2>
<ul>
<li>Link compensation to title, and title to to team size, in order to incentivize bloat.</li>
<li>Make big talk about strategies, features, or technical complexity.</li>
<li>Make expensive acquisitions to enter new product areas. Refer to “synergies”. Shut down the acquired product.</li>
<li>Use lots of dotted lines in the reporting structure.</li>
<li>As much as possible, have people to report into managers in other teams, locations, or functions. Make sure managers are ill-equipped to supervise their reports.</li>
<li>Frequently reassign underperformers to other teams.</li>
<li>Put high performers on highly speculative R&D projects with unclear deliverables.</li>
<li>Always require a meeting for any decision, no matter how trivial.</li>
<li>Insist that every “stakeholder” needs to be present in the meeting.</li>
</ul>
<h2 id="hiring">Hiring</h2>
<ul>
<li>Create a hiring process that seems plausibly objective but in reality subjective.</li>
<li>Reject the best people based on “poor culture fit” or other vague criteria.</li>
<li>Hire the weakest candidates based on “potential” or “attitude” or other vague criteria.</li>
<li>Recruit very expensive senior leaders with large headcount promises.</li>
<li>Use inflated titles and made-up roles to attract opportunists.</li>
<li>Hire highly specialized “experts”, then create contrived projects to prevent them from quitting.</li>
<li>Use specialization as a justification to hire other, complementary people.</li>
</ul>
<h2 id="project-management">Project management</h2>
<ul>
<li>Require very detailed estimates for any project.</li>
<li>Encourage projects that span as many teams as possible, ideally in different locations.</li>
<li>Add new requirements that depend on work done by other teams.</li>
<li>Frequently make use of expensive agencies. Make the scope ambigious and hand over unfinished prototypes on the in-house team for them to finish.</li>
<li>Build complex “self-service” systems for stakeholders in other teams.</li>
</ul>
<figure>
<img src="https://erikbern.com/assets/sabotage.jpeg" alt="my alt text"/>
<figcaption><small><em>This is from the 1994 music video <a href="https://www.youtube.com/watch?v=z5rRZdiu1UE">Sabotage</a> by Beastie Boys. The lyrics are mostly about technology leadership and developer productivity.</em></small></figcaption>
</figure>
<h1 id="the-outcome">The outcome</h1>
<p>It's a hard job to pull it off! But if you can parachute behind the enemy front lines, and land a job as a CTO, you can make this happen.</p>
<p>For the non-saboteur: this is obviously a story about how to get the most out of your team. Productivity in general is a story of a thousand cuts, and none of these things are in themselves the thing that will ruin the productivity. But productivity adds up on a logarithmic scale, meaning that all these things compound in a multiplicative way. Basically, do 100 things that each is a 5% tax on productivity, and you just slowed everything down by 131x! The only way to keep engineers happy is to say no to 100 minor cuts that each sound plausible and <a href="https://www.youtube.com/watch?v=6XsOO8j8NK0">specious</a>.</p>
What I have been working on: Modal2022-12-07T00:00:00Zhttps://erikbern.com/2022/12/07/what-ive-been-working-on-modal.html<p><em>Long story short:</em> I'm working on a super cool tool called <a href="https://modal.com">Modal</a>. Please check it out — it lets you run things in the cloud without having to think about infrastructure. Scaling out, scheduling, containerization, using GPUs, setting up webhooks, and all kinds of other stuff. It's primarily meant for data teams. We aren't <em>quite</em> live, but you can sign up for our waitlist.</p>
<h2 id="context">Context</h2>
<p>Most of my career has been in data. I spent seven years working at Spotify, doing everything from large-scale numerical methods to making charts for board decks. I then spent six years as a CTO, although I managed the data team directly for a long time and would occasionally write some data code.</p>
<p>Data<sup id="fnref:1"><a href="#fn:1" class="footnote-ref" role="doc-noteref">1</a></sup> strikes me a a discipline that deserves a bit more love. It's grown from obscurity to become some meaningful % of software engineering, but the state of the art in terms of tools and workflow is still emerging.</p>
<h2 id="data-as-its-own-discipline">Data as its own discipline</h2>
<p>I spent a lot of time as a CTO, and if I had to condense how to make engineers productive into one thing, it would be something like: make the feedback loops fast.</p>
<p>What sort of “loops” am I talking about? In frontend development it's saving the code in the editor on one screen and seeing the updates in the browser on another. In backend development it's running unit tests (or sometimes, just compiling).</p>
<p>Data is sort of weird because you have to run things on production data to have these sort of feedback loops. Whether you're running SQL or doing ML, it's often pointless to do that on non-production data. This violates a holy wall for a lot of software engineers: the strict separation of local and prod. <sup id="fnref:2"><a href="#fn:2" class="footnote-ref" role="doc-noteref">2</a></sup></p>
<p>There are other differences too! Data teams often need to change infrastructure a lot more often (sometimes <em>every</em> new cron job needs a Terraform update), have very “bursty” needs for compute power, and needs a much wider range of hardware (GPUs! high memory jobs! etc). Not to mention the “liberal” (ehum) standards for packaging cutting edge ML code <sup id="fnref:3"><a href="#fn:3" class="footnote-ref" role="doc-noteref">3</a></sup>.</p>
<p>There's a weird sort of backend-normative view of what data teams should do, but I think it's very misguided. UN should impose sanctions on anyone complaining that “data teams need to adopt software engineering practices”. The needs are different! Lets let the right workflows emerge from what makes teams the most productive, and lets let data workflows stand on their own feet.<sup id="fnref:4"><a href="#fn:4" class="footnote-ref" role="doc-noteref">4</a></sup></p>
<h2 id="lets-make-data-teams-more-productive">Let's make data teams more productive!</h2>
<p>I started looking at this a few years ago, looked at the <a href="https://mattturck.com/data2021/">absurdly crowded market landscape</a>, and spent a lot of time talking to <a href="https://twitter.com/sarahcat21">very smart people</a>. I kind of wanted to rebuild everything! Which is an incredibly aspirational and dumb idea. Looking at a lot of different parts of the stack, I started getting interested in the lowest part of it, which I've been thinking of as the “runtime”.</p>
<p>A lot of the issues with data productivity I think comes back to the runtime:</p>
<ul>
<li>Infrastructure is often a “chore” in the end. After you get something running locally, you now have to do a ton of complex testing/configuration to ship it.</li>
<li>The feedback loops working with infra is super slow, because every iteration requires deploying code to K8s or similar</li>
<li>Things break in production in weird ways because the environment is different</li>
<li>Every company that reaches a certain stage tends to build its own data platform. This seems… wasteful?</li>
<li>It turns out it's hard to build abstractions on top of Kubernetes without it leaking through in 100 ways.</li>
</ul>
<p>Some very large fraction of this has effectively been solved by shoving all the transformations into SQL in the last few years. I'm a <a href="/2018/08/30/i-dont-want-to-learn-your-garbage-query-language.html">big fan of SQL</a>. Better tooling made it 10x easier to write complex pipelines in SQL and so its adoption increased by a lot. But there's still a lot of things where you need <em>code</em>. What can we do to make data teams 10x more productive when they write code?</p>
<h2 id="lets-build-a-new-runtime">Let's build a new runtime</h2>
<p>I wanted to build something that takes code on a user's computer and launches it in the cloud within a second. Skimming over all the intermediate steps, I built Modal.</p>
<p>Let's write some code that computes the square of 42 and prints it to standard out:</p>
<div class="highlight"><pre style="color:#f8f8f2;background-color:#272822;-moz-tab-size:4;-o-tab-size:4;tab-size:4"><code class="language-python" data-lang="python"><span style="color:#f92672">import</span> modal
stub <span style="color:#f92672">=</span> modal<span style="color:#f92672">.</span>Stub()
<span style="color:#a6e22e">@stub.function</span>
<span style="color:#66d9ef">def</span> <span style="color:#a6e22e">square</span>(x):
<span style="color:#66d9ef">print</span>(<span style="color:#e6db74"></span><span style="color:#e6db74">"</span><span style="color:#e6db74">This code is running on a remote worker!</span><span style="color:#e6db74">"</span>)
<span style="color:#66d9ef">return</span> x<span style="color:#f92672">*</span><span style="color:#f92672">*</span><span style="color:#ae81ff">2</span>
<span style="color:#66d9ef">if</span> __name__ <span style="color:#f92672">==</span> <span style="color:#e6db74"></span><span style="color:#e6db74">"</span><span style="color:#e6db74">__main__</span><span style="color:#e6db74">"</span>:
<span style="color:#66d9ef">with</span> stub<span style="color:#f92672">.</span>run():
<span style="color:#66d9ef">print</span>(<span style="color:#e6db74"></span><span style="color:#e6db74">"</span><span style="color:#e6db74">the square is</span><span style="color:#e6db74">"</span>, square<span style="color:#f92672">.</span>call(<span style="color:#ae81ff">42</span>))
</code></pre></div><p>The foundational building block in Modal is a decorator that takes any Python function and moves its execution to the cloud. This might seem like a very trivial thing, but it turns out you can use this as a very powerful primitive to build a lot of cool stuff.</p>
<p>Let's run this code:</p>
<center>
<video controls style="width: 100%;">
<source src="/assets/modal_get_started.mov" type="video/mp4">
<track kind="captions" />
</video>
</center>
<p>Two things worth noting here:</p>
<ul>
<li>This launches the code into the cloud in ~1s.</li>
<li>The <code>square</code> function runs in the cloud, but when it prints, we see it on the local stdout.</li>
</ul>
<p>Things like this lets us take the cloud inside the innermost feedback loop. If we <em>edit</em> the code and re-run the app, the new code just runs. Instead of the loop of: build container → push container → trigger job → download logs which can take a few minutes if you're lucky, or a few hours if you're unlucky (especially if there's version control and CI/CD in that feedback loop).</p>
<p>The other benefit is, you only have a single environment. We can define arbitrary environments <em>in code</em> and have Modal build it for you, in the cloud:</p>
<div class="highlight"><pre style="color:#f8f8f2;background-color:#272822;-moz-tab-size:4;-o-tab-size:4;tab-size:4"><code class="language-python" data-lang="python"><span style="color:#a6e22e">@stub.function</span>(image<span style="color:#f92672">=</span>modal<span style="color:#f92672">.</span>Image<span style="color:#f92672">.</span>debian_slim()<span style="color:#f92672">.</span>pip_install([<span style="color:#e6db74"></span><span style="color:#e6db74">"</span><span style="color:#e6db74">numpy</span><span style="color:#e6db74">"</span>]))
</code></pre></div><p>This says: run the function <code>square</code> inside a container image that has <code>numpy</code> installed in it. When we run this, if the image doesn't exist, it will be built in the cloud for us. We build it super fast — the above example in a couple of seconds, since we built our own container builder and have fast machines in the cloud with super fast internet.</p>
<p>What about using a GPU?</p>
<div class="highlight"><pre style="color:#f8f8f2;background-color:#272822;-moz-tab-size:4;-o-tab-size:4;tab-size:4"><code class="language-python" data-lang="python"><span style="color:#a6e22e">@stub.function</span>(gpu<span style="color:#f92672">=</span>modal<span style="color:#f92672">.</span>gpu<span style="color:#f92672">.</span>A100())
</code></pre></div><p>Or a cronjob running in the cloud?</p>
<div class="highlight"><pre style="color:#f8f8f2;background-color:#272822;-moz-tab-size:4;-o-tab-size:4;tab-size:4"><code class="language-python" data-lang="python"><span style="color:#a6e22e">@stub.function</span>(schedule<span style="color:#f92672">=</span>modal<span style="color:#f92672">.</span>Period(hours<span style="color:#f92672">=</span><span style="color:#ae81ff">1</span>))
</code></pre></div><p>Any function in Modal can also be used to map over it, fanning it out to lots of containers running in the cloud (<a href="https://modal.com/docs/guide/ex/batch_inference_using_huggingface">see code</a>):</p>
<center>
<video controls style="width: 100%;">
<source src="/assets/modal_batch.mov" type="video/mp4">
<track kind="captions" />
</video>
</center>
<p>There's plenty of other things too. All of this while not making you write a single line of YAML in the process (in fact, there is no configuration in Modal — everything is in code).</p>
<p>And since we take care of all the infrastructure, it's trivial to get started, once you have an account <sup id="fnref:5"><a href="#fn:5" class="footnote-ref" role="doc-noteref">5</a></sup>, just run</p>
<ol>
<li><code>pip install modal-client</code></li>
<li><code>modal token new</code></li>
</ol>
<p>This initializes an API token and you're ready to run Modal. We run everything in our infrastructure, so there's nothing to set up other than that.</p>
<h2 id="what-are-some-things-you-can-build-using-modal">What are some things you can build using Modal?</h2>
<p>We've been focusing a lot on machine learning recently, in particular model inference — <a href="https://github.com/modal-labs/modal-examples/blob/main/06_gpu/stable_diffusion_cli.py">Stable Diffusion</a> is obviously the coolest thing right now, but we also support a wide range of other things: Using OpenAI's <a href="https://modal.com/docs/guide/whisper-transcriber">Whisper model for transcription</a>, <a href="https://modal.com/docs/guide/ex/dreambooth_app">Dreambooth</a>, <a href="https://modal.com/docs/guide/ex/webcam">object detection</a> (with a webcam demo!). It's possible to deploy an ML model on Modal in a few minutes, and the actual deployment step usually takes a few <em>seconds</em>.</p>
<p>But Modal is really a general purpose compute layer you can use for a lot of stuff. You can use us for <a href="https://modal.com/docs/guide/ex/duckdb_nyc_taxi">query datasets using DuckDB</a>, or for <a href="https://modal.com/docs/guide/ex/screenshot">web scraping</a>, and for many other things: data pipelines, cron jobs, large-scale simulations, and many more things. And it's serverless<sup id="fnref:6"><a href="#fn:6" class="footnote-ref" role="doc-noteref">6</a></sup>, so you only pay for the actual usage.</p>
<h2 id="how-does-it-work">How does it work?</h2>
<p>Taking code on a user's computer and launching it into custom containers in the cloud in less than a second isn't trivial. Along the way, we ended up building a lot of custom stuff: in particular a container runner, an image builder, and our own filesystem. Most of this in Rust for performance and safety.</p>
<p>We decided to not build this on top of tools like Docker/Kubernetes because we want infrastructure to be <em>fast</em>. I met a lot of VCs and other people while I was still just working alone on a prototype and most of them told me I was nuts when I started talking about building custom file systems and container engines. But we built it and it's <a href="https://twitter.com/bernhardsson/status/1590780694951006208">working beautifully</a>! Modal has no problem building a 100GB container, and then booting up 100 of those containers — you can do the whole thing in a few seconds. This is what it's built for. <sup id="fnref:7"><a href="#fn:7" class="footnote-ref" role="doc-noteref">7</a></sup></p>
<p>There's a lot of other complexity: the work of scheduling tasks onto workers, exposing everything as a Python SDK, and much more. I'm very spoiled to have this team <sup id="fnref:8"><a href="#fn:8" class="footnote-ref" role="doc-noteref">8</a></sup> and really proud of where we've gotten so far. BUT it's also clear that we're extremely early in this journey — we're working on infrastructure at a very low level and it's going to take a lot of time to support all the cool stuff we want to get to. I will be posting a lot more about it!</p>
<section class="footnotes" role="doc-endnotes">
<hr>
<ol>
<li id="fn:1" role="doc-endnote">
<p>I'm deliberately vague about what exact role I mean here: take it to mean data engineers, data scientists, ML engineers, analytics engineers, and maybe more roles. The current division of responsibility is still in flux, and I think it's a mistake overfitting to what we have today. <a href="#fnref:1" class="footnote-backref" role="doc-backlink">↩︎</a></p>
</li>
<li id="fn:2" role="doc-endnote">
<p>I think it's interesting that Snowflake was (arguably) the first major database to <em>only</em> run in the cloud, and it sort of makes sense from this view. OLTP databases typically need to run in multiple places: in prod, in dev, and in CI. An OLAP database like Snowflake doesn't have this portability requirement. <a href="#fnref:2" class="footnote-backref" role="doc-backlink">↩︎</a></p>
</li>
<li id="fn:3" role="doc-endnote">
<p>I looked at some code recently where the author had put the entire virtual env in a zip, and the notebook included steps that patched installed site-packages. <a href="#fnref:3" class="footnote-backref" role="doc-backlink">↩︎</a></p>
</li>
<li id="fn:4" role="doc-endnote">
<p>To be clear: I would still recommend every data person to learn a lot about “traditional” software engineering! But let's not treat it as the “right” way to do things. <a href="#fnref:4" class="footnote-backref" role="doc-backlink">↩︎</a></p>
</li>
<li id="fn:5" role="doc-endnote">
<p>Unfortunately account registration still isn't open, because we aren't <em>quite</em> ready for it! <a href="#fnref:5" class="footnote-backref" role="doc-backlink">↩︎</a></p>
</li>
<li id="fn:6" role="doc-endnote">
<p>The term <em>serverless</em> is applied waaaaay too liberally by vendors today, so I struggle a bit with the term, to be honest. <a href="#fnref:6" class="footnote-backref" role="doc-backlink">↩︎</a></p>
</li>
<li id="fn:7" role="doc-endnote">
<p>Pushing and pulling OCI images is incredibly inefficient. Only a very small fraction of the image content is ever read, and there's an extremely high degree of overlap between even unrelated images. We're exploiting this by running our own file system in FUSE which we expose to containers. But under the hood, the we use a content-addressed storage system. This means we don't have to copy around large images, because we can fetch individual files lazily when they are needed, and we can also achieve a very high cache efficiency for these files. I hope to write a blog bost about this in the future! <a href="#fnref:7" class="footnote-backref" role="doc-backlink">↩︎</a></p>
</li>
<li id="fn:8" role="doc-endnote">
<p>Just one random thing: we have 7 people on the team and 5 <a href="https://en.wikipedia.org/wiki/International_Olympiad_in_Informatics">IOI</a> gold medals, which is a fairly irrelevant metric, but I think it's still cool. <a href="#fnref:8" class="footnote-backref" role="doc-backlink">↩︎</a></p>
</li>
</ol>
</section>
We are still early with the cloud: why software development is overdue for a change2022-10-19T00:00:00Zhttps://erikbern.com/2022/10/19/we-are-still-early-with-the-cloud.html<p>This is is in many respects a successor to a
<a href="/2021/04/19/software-infrastructure-2.0-a-wishlist.html">blog post I wrote last year</a>
about what I want from software infrastructure, but the ideas morphed in my head into something sort of wider.</p>
<h2 id="the-genesis">The genesis</h2>
<p>I encountered AWS in 2006 or 2007 and remember thinking that it's crazy — why would anyone want to put their stuff in someone else's data center?
But only a couple of years later, I was running a bunch of stuff on top of AWS.</p>
<p>Back then, AWS had something like two services: EC2 and S3. Today, that number is closer to 350: <sup id="fnref:1"><a href="#fn:1" class="footnote-ref" role="doc-noteref">1</a></sup></p>
<p><img src="https://erikbern.com/assets/aws_services.png" alt="aws services"></p>
<p>And today, the cloud is obviously here… I mean, despite
<a href="https://a16z.com/2021/05/27/cost-of-cloud-paradox-market-cap-cloud-lifecycle-scale-growth-repatriation-optimization/">what some people may think</a> about cloud adoption <sup id="fnref:2"><a href="#fn:2" class="footnote-ref" role="doc-noteref">2</a></sup>
it's clear that building technology is vastly different today than it was a decade ago, and the cloud deserves a big part of the credits for it.</p>
<h2 id="i-think-we-might-be-early-though">I think we might be early though?</h2>
<p>In some sort of theoretical abstract platonic form type thing, the cloud should offer us</p>
<ul>
<li>Infinite scalability</li>
<li>Less time spent on infrastructure</li>
<li>Fewer constraints</li>
<li>Lower costs.</li>
</ul>
<p>Here's a random assortment of things I feel like we <em>should</em> have, if the cloud had truly delivered. But we don't:</p>
<ul>
<li>When I compile code, I want to fire up 1000 serverless container and compile tiny parts of my code in parallel.</li>
<li>When I run tests, I want to parallelize all of them. Or define a grid with a 1000 combinations of parameters, or whatever.</li>
<li>I never ever again want to think about IP rules. I want to tell the cloud to connect service A and B!</li>
<li>Why is Bob in the ops team sending the engineers a bunch of shell commands they need to run to update their dev environment to support the latest Frobnicator version? For the third time this month?</li>
<li>Why do I need to SSH into a CI runner to debug some test failure that I can't repro locally?</li>
</ul>
<p>I could go on!</p>
<p>The current state doesn't strike me as a slam dunk improvement along every axis. Most egregiously, why have the feedback loops writing code become <em>longer</em>? And the environment difference between local and prod <em>larger</em>? I don't know…I look at modern programming and cloud computing and it feels like we have most of the building blocks, but we're still so far from it? I can't help but getting the feeling that we basically just did this thing so far: <sup id="fnref:3"><a href="#fn:3" class="footnote-ref" role="doc-noteref">3</a></sup></p>
<p><img src="https://erikbern.com/assets/docker.jpeg" alt="docker"></p>
<p>Docker is an incredible piece of technology for many reasons.
But just using it the way the meme above implies, seems as if we didn't fundamentally change development to take advantage of this new magic technology, we just sort of just think of it as an <em>adapter</em>. We've seen Cloud 1.0 and maybe <a href="https://www.jeremydaly.com/is-learning-serverless-really-that-hard/">Cloud 1.5</a> but there's a lot more remaining for us to reach Cloud 2.0.</p>
<h2 id="adapters-and-toys">Adapters and toys</h2>
<p>I spent seven years at Spotify so let me tell you a story. It might seem tangential but hear me out:</p>
<p>Music consumption in 2008 was going in two directions. iTunes had successfully shifted the consumption of music from physical to the cloud, but the consumption model of <em>owning</em> content remained the same.
At the same time, Napster et. al. showed the promise of the cloud but was unable to license content and do it the legal way.</p>
<p>Increasing broadband penetration initially enabled music downloading, but quickly also made the location of the music bits irrelevant.</p>
<p>Spotify then (imo!) pulled off a massive Pareto improvement — they offered a service that were <em>both</em> better than iTunes and piracy for consumers, and somehow also had a business model that was sufficiently producer friendly. I remember the magic moment from the first time I tried Spotify — it was like having 30M tracks <em>on my own computer.</em></p>
<p><img src="https://erikbern.com/assets/locomotive.jpeg" alt="locomotive">
<em>A steam locomotive pulling horse carriages:</em> <sup id="fnref:4"><a href="#fn:4" class="footnote-ref" role="doc-noteref">4</a></sup></p>
<p>I find this useful to illustrate how music consumption went through a couple of shifts in rapid succession:</p>
<p>The first shift is trying to put the old stuff into the new thing. This is the “lift and shift” or “adapter” type approach. These things take advantage of the new tech to some extent, but only partially, and are stuck with legacy technology. The second shift involves products that are native to the new technology, but look like “toys”. Maybe there's no obvious business model, or the tool solves just one particular use case. But it gives some conceptual insight into what's coming.</p>
<p>The exciting thing happens when the toys evolve into something that is obviously better than the legacy technology, and also better than the adapters. Online streaming services basically represents a third and final shift: take the toys but turn it mainstream.</p>
<h2 id="cloud-is-coming-for-your-workflow">Cloud is coming for your workflow</h2>
<p>Somewhat ironically, software development is one of a vanishingly small subset of knowledge jobs for which the main work tool hasn't moved to the cloud. We still write code locally, thus we're constrained to things that work in the same way both locally and in the cloud. Thus, adapter tools like Docker.</p>
<p>I get this. I <em>love</em> writing code just on my laptop because of the fast feedback loops it creates. My laptop is full of weird-ass scripts and half-finished projects, and I haven't encountered any other tool that lets me iterate on these things as quickly, maybe with the exception of <code>ssh</code> into a devbox, which is something we've done for about 50 years now: <sup id="fnref:5"><a href="#fn:5" class="footnote-ref" role="doc-noteref">5</a></sup></p>
<p><img src="https://erikbern.com/assets/remote_login.jpeg" alt="remote login"></p>
<p>We could of course put the whole development environment in a VM in the cloud, but I'm not sure that's much more than the “lift and shift” I already talked about — in the sense that we're not taking advantage of all the cloud stuff — scaling up/down (including to zero), flexible resource needs, pay-as-you-go, etc. I think we're overdue for some larger change in how we develop, deploy, and run code.</p>
<p>That doesn't mean someone is confiscating your beloved local development environment! Or I mean, it sort of does, but it won't happen until the new tools are <em>better</em> — which frankly is not the case today, outside of a few use cases. Like I said, the fast feedback loop of local coding is hard to beat <em>today</em>, but there's a lot of good reasons why an environment native to the cloud would let you iterate faster eventually. And there are other benefits too, like reducing/removing big environment differences which represent a massive tax on productivity.</p>
<h2 id="to-be-free-we-need-to-break-free-of-our-past">To be free, we need to break free of our past</h2>
<p>Our stacks are based on 50 years of technology. On top of that, we also have a lot of legacy portability needs: where we needed the same software to run in the cloud, locally, and on-prem. These complex interdependencies will take a while to break free of.</p>
<p>Rethinking these abstractions to be native to the new world let's us start over and redefine the abstractions for what we need? Do we need IP addresses, CIDR blocks, and NATs, or can we focus on which services have access to what resources? Do we need to reserve resources advance (like having a cluster of n workers, each having x GB of RAM), or can we let the runtime expand/shrink in a split second? You can probably guess which option I would put my money on.</p>
<p>These low-level primitives will still be there of course, under the hood, and some people will still think about hardware interrupts and dangling pointers. But just like most developers don't think about these things, the abstraction layers will keep moving up. I'm excited for a world where a normal software developer doesn't need to know about CIDR blocks to <a href="https://twitter.com/bernhardsson/status/1575546247519166464">connect a Lambda with an RDS instance</a>.</p>
<h2 id="vertical-toys">Vertical toys</h2>
<p>Building and running software was convoluted enough pre-cloud, and has gotten a lot more complex over the years. I think it's quite likely that the easiest way to start over is to focus on particular use cases and optimize end-to-end for the experience. “Repackage the cloud” for different end users, be it frontend developers, data scientists, and so one. I mean, I'm extremely biased here, but I'm essentialy <a href="https://modal.com">doing this for data teams</a>, so I'm obviously a believer in this.</p>
<p>You don't have to look far to see some pockets of this. Analytics engineers who run all their SQL in a runtime in the cloud (the data warehouse). Data scientists who develop all their code in notebooks in the cloud. Some (very small subset of) backend developers who run all their code in Lambda containers, even during development. The broad userbase of people building and hosting apps on tools like Replit.</p>
<p>You might look at them and think of them as examples of “toys”, or niche use cases, but that's sort of the point that I'm making — it might look insignificant to the larger set of software engineers. It might not look like the software engineering <em>you</em> are doing, and it probably won't quite look like what software development will look like in the future. But it's very possible these people are in fact ahead of the curve.</p>
<h2 id="welcome-cloud-20">Welcome, Cloud 2.0</h2>
<p>This was just a long way of saying: the clouds are here, and a lot has already happened, but the bulk of what it means for building software is yet to come.</p>
<p>I also want to point out that I wrote a whole blog post about how we're early with the cloud, and I didn't even mention the massive amount of companies that aren't even in the cloud. Besides the massive changes to the cloud itself, there's so much growth just there. And there's something like an order of magnitude <em>more software engineers</em> today than 20 years ago, which will further drive demand, etc etc etc. It's going to be a fun decade for tech!</p>
<h2 id="addendum">Addendum</h2>
<p>This was on the front page of Hacker News and <a href="https://news.ycombinator.com/item?id=33269092">got a bunch of comments</a>.</p>
<p>Separately, if this post resonates with you, and you're working on data and want better infrastructure, you might be interested in <a href="https://modal.com">Modal</a>, which is what I'm working on right now. We take your code and run it in the cloud for you, while letting you retain the productivity of writing code locally. You can scale things out, schedule things, run things on GPUs, and a bunch of other things.</p>
<section class="footnotes" role="doc-endnotes">
<hr>
<ol>
<li id="fn:1" role="doc-endnote">
<p>This chart is pretty crude — I just looked at the earliest version number for each service in <a href="https://github.com/boto/botocore">botocore</a>. But it's a bit imprecise, e.g. EC2 was launched in 2006, but the oldest API version is from 2014. <a href="#fnref:1" class="footnote-backref" role="doc-backlink">↩︎</a></p>
</li>
<li id="fn:2" role="doc-endnote">
<p>And despite <a href="https://world.hey.com/dhh/why-we-re-leaving-the-cloud-654b47e0">some companies</a> with <a href="https://twitter.com/bernhardsson/status/1582761705469534208">different margin structures</a> <a href="#fnref:2" class="footnote-backref" role="doc-backlink">↩︎</a></p>
</li>
<li id="fn:3" role="doc-endnote">
<p>I would love to attribute this to the right person! <a href="https://imgflip.com/i/24ac74">This</a> might to be the earliest source. <a href="#fnref:3" class="footnote-backref" role="doc-backlink">↩︎</a></p>
</li>
<li id="fn:4" role="doc-endnote">
<p>Credit to <a href="https://twitter.com/paulg/status/1580174713656995840">Paul Graham</a> for tweeting this. <a href="#fnref:4" class="footnote-backref" role="doc-backlink">↩︎</a></p>
</li>
<li id="fn:5" role="doc-endnote">
<p>Credit to <a href="https://twitter.com/cyndemoya/status/1172289968137392128">Cynde Moya</a> for tweeting this. <a href="#fnref:5" class="footnote-backref" role="doc-backlink">↩︎</a></p>
</li>
</ol>
</section>
σ-driven project management: when is the optimal time to give up?2022-04-05T00:00:00Zhttps://erikbern.com/2022/04/05/sigma-driven-project-management-when-is-the-optimal-time-to-give-up.html<p>Hi! It's your friendly project management theorician. You might remember me from blog posts such as <a href="/2019/04/15/why-software-projects-take-longer-than-you-think-a-statistical-model.html">Why software projects take longer than you think</a>, which is a blog post I wrote a long time ago positing that software projects completion time follow a log-normal distribution.</p>
<p>Just a bit of a refresher if you don't want to re-read that whole post. What does it mean that project completion time has a log-normal distribution? If a project is estimated to take one month to complete, it will sometimes take half a month, sometimes two months. We can define the “blowup factor” to be the ratio of actual vs estimated. Then the assumption is basically that the <em>logarithm of the blowup factor will follow a normal distribution.</em> and in particular, it's a normal distribution with zero mean and some standard deviation σ (which is the Greek letter “sigma”).</p>
<p>We can plot a normal distribution in terms of its <em>cumulative density function</em>. What does this mean? It means the probability that the project has finished, as a function of time. See the chart below:</p>
<p><img src="https://erikbern.com/assets/proj-mgmt-sigma/cdf.png" alt="cdf"></p>
<p>You can see that it's 50-50 (median outcome) that we have completed the project at the point that corresponds to 100% of the original estimate (the dashed line). But let's contrast two different values of σ:</p>
<table>
<thead>
<tr>
<th align="right">time</th>
<th align="right">σ = 1.0</th>
<th align="right">σ = 1.4</th>
</tr>
</thead>
<tbody>
<tr>
<td align="right">0%</td>
<td align="right">0%</td>
<td align="right">0%</td>
</tr>
<tr>
<td align="right">50%</td>
<td align="right">24%</td>
<td align="right">31%</td>
</tr>
<tr>
<td align="right">100%</td>
<td align="right">50%</td>
<td align="right">50%</td>
</tr>
<tr>
<td align="right">200%</td>
<td align="right">76%</td>
<td align="right">69%</td>
</tr>
<tr>
<td align="right">400%</td>
<td align="right">92%</td>
<td align="right">84%</td>
</tr>
<tr>
<td align="right">∞</td>
<td align="right">100%</td>
<td align="right">100%</td>
</tr>
</tbody>
</table>
<p>So just as an example of how to read this table: if σ = 1.4 then in 84% of the outcomes, you are finished with the project within 400% of the original estimate.</p>
<p>So where does the σ come from? My thesis for this blog post is that <strong>σ is an inherent property of the type of risk you have in your project portfolio, and that different values for σ warrants very different types of project management.</strong> Low σ means low uncertainty and means we should almost always finish projects. High σ means high uncertainty — more like a research lab — and means large risks of a huge blowup, which also means we should abandon lots of projects.</p>
<h1 id="all-models-are-wrong-etc">All models are wrong, etc…</h1>
<p>The general gist of the model is something like this:</p>
<ul>
<li>The actual time it takes to finish a project has a log-normal distribution</li>
<li>Every project has the same value if it succeeds <sup id="fnref:1"><a href="#fn:1" class="footnote-ref" role="doc-noteref">1</a></sup></li>
<li>Once we start to work on a project, we get no feedback until suddenly it finishes</li>
<li>At any point in time, we may choose to (a) keep working on this project (b) abandon it</li>
</ul>
<p>This is obviously a very crude model! It's a bit like, you're down in the mine blasting rock looking for one super big diamond. Finding the diamond is a very “binary” event in the sense that either we found it or not — there's no partial credit, and nothing “learned” up until that point. However, if we've been down in one mine looking for a diamond for, I don't know, ten years, then maybe we should reassess. Maybe it's time to go to a different mine?</p>
<p>So let's focus on the decision of finishing or abandoning a project, which roughly comes down to: once something is late, is it still worth working on it? Are you getting closer or further away from success? <sup id="fnref:2"><a href="#fn:2" class="footnote-ref" role="doc-noteref">2</a></sup> <sup id="fnref:3"><a href="#fn:3" class="footnote-ref" role="doc-noteref">3</a></sup></p>
<h1 id="how-much-business-value-are-you-creating-my-friend">How much business value are you creating, my friend?</h1>
<p>The <em>business value per time</em> is basically <sup id="fnref:4"><a href="#fn:4" class="footnote-ref" role="doc-noteref">4</a></sup> the success ratio <em>per time spent</em> (which is, roughly, the probability distribution function).</p>
<p>I'm going to rescale it so that we always start at $$ y=1 $$ for reasons I'll get back to shortly. Here's what it looks like: <sup id="fnref:5"><a href="#fn:5" class="footnote-ref" role="doc-noteref">5</a></sup></p>
<p><img src="https://erikbern.com/assets/proj-mgmt-sigma/marginal_roi.png" alt="marginal roi"></p>
<p>What's going here? Working on a project has increasing marginal business value in the beginning, which intuitively makes sense because we're getting closer to finishing it. But if we haven't finished it at some point, it's somewhat likely we ran into a “monster” project that's going to take an massive amount of time to finish, much more than we initially thought. So the business value starts to decline at some point (for high-σ projects rather quickly). Which means, are we actually working on something valuable still?</p>
<h1 id="drop-it-like-its-lower-marginal-roi">Drop it like it's lower marginal ROI</h1>
<p>Presumably, we picked this project from a crop of potential projects, where the top one beat the 2nd one by a small margin. So at some point, once the business value per time drops <em>below</em> where it started, we end up in a place where abandoning the top ROI project and switching to the second honest one makes sense. That's why it's interesting to compare the <em>current marginal ROI</em> with the <em>initial marginal ROI</em>.</p>
<p>Graphically, this happens in the previous chart at the dashed line $$ y = 1 $$. Let's record when the curves intersect $$ y = 1 $$ and put those points back into the first chart in this post — the cumulative distribution function:</p>
<p><img src="https://erikbern.com/assets/proj-mgmt-sigma/cdf_with_stop.png" alt="cdf with stop"></p>
<p>These points are wild! Like, we start with curves that graphically aren't <em>too</em> different, but when we solve for the optimal time to abandon a project, we end up with wildly different results. I find that pretty amazing and worth putting in a table:</p>
<table>
<thead>
<tr>
<th align="right">σ</th>
<th align="right">When to give up</th>
<th align="right">Project finish ratio</th>
</tr>
</thead>
<tbody>
<tr>
<td align="right">0.6</td>
<td align="right">1492%</td>
<td align="right">100%</td>
</tr>
<tr>
<td align="right">0.8</td>
<td align="right">674%</td>
<td align="right">99%</td>
</tr>
<tr>
<td align="right">1.0</td>
<td align="right">320%</td>
<td align="right">88%</td>
</tr>
<tr>
<td align="right">1.2</td>
<td align="right">153%</td>
<td align="right">64%</td>
</tr>
<tr>
<td align="right">1.4</td>
<td align="right">72%</td>
<td align="right">41%</td>
</tr>
</tbody>
</table>
<p>So just as an example, if σ = 1.0, then we should give up at 320% of the original estimate. If we follow this policy, then we finish about 88% of all project.</p>
<p>But if σ = 1.4, then we should give up at 72% of the original estimate, and if we do that, we finish only 41% of all projects.</p>
<p>These are pretty huge differences!</p>
<h1 id="project-management-depends-on-sigma">Project management depends on σ</h1>
<p>What we've established so far is that high-uncertainty project management imply a high percentage of abandoned project.</p>
<p>This seems to pass a rough sanity check with reality! Any sufficiently research-like project will have a large risk of blowing up. For that reason, we should also be willing to give up on a high % of these projects. The optimal way to manage planning, resource allocation, and other things are wildly different:</p>
<h2 id="low-sigma-management">Low-σ management</h2>
<ul>
<li>Low uncertainty</li>
<li>Near-100% of all projects finish</li>
<li>Very accurate estimates</li>
<li>Perfectly forecasted timelines for milestones</li>
<li>Every day, monitor project completion and make sure it's tracking</li>
</ul>
<h2 id="high-sigma-management">High-σ management</h2>
<ul>
<li>High uncertainty</li>
<li>Most projects are abandoned</li>
<li>Estimates are pointless</li>
<li>Resources are allocated towards ideas with potential</li>
<li>There's going to be lots of sunk costs</li>
<li>Every day is <a href="https://aws.amazon.com/executive-insights/content/how-amazon-defines-and-operationalizes-a-day-1-culture/">day one</a></li>
</ul>
<h1 id="is-software-different">Is software different?</h1>
<p>I've kept it super general so far and you can apply it to almost anything — digging for dinosaur fossils, or painting a house (question for the reader: which one of these is low-σ and which one is high-σ?)</p>
<p>But let's talk about software for a second. Why is it so hard to predict? Here's my theory: <em>because anything predictable suggests something is redundant and should be factored out.</em></p>
<p>If it takes an engineer one day to build one API integration, it's not going to take them 100 days to build 100 API integrations, because on day 3 or whatever, the engineer will build an API integration maker framework that lets them build API integrations faster. <sup id="fnref:6"><a href="#fn:6" class="footnote-ref" role="doc-noteref">6</a></sup> This will lower total effort a lot, but the total uncertainty a bit less. The σ — which is the relative predictability of the task in logarithm-terms, will go up.</p>
<p>In general, this is how us software engineers have done it for 50 years now. Everyone's job is simultaneously building features and building tools that makes it easier to build features. We end up with layers and layers of abstractions, and each layer reduces the work we have to spend in the layer below. This is obviously great for productivity! It does however mean that software projects will be hard to estimate, and a lot of software projects will be abandoned.</p>
<section class="footnotes" role="doc-endnotes">
<hr>
<ol>
<li id="fn:1" role="doc-endnote">
<p>We don't really lose any generality making this assumption since it essentially cancels out. Same with the expected time spent, which is why I just talk about it in terms of % of the initial estimate. <a href="#fnref:1" class="footnote-backref" role="doc-backlink">↩︎</a></p>
</li>
<li id="fn:2" role="doc-endnote">
<p>This is a bit of a <a href="https://en.wikipedia.org/wiki/Lindy_effect">Lindy effect</a>: <em>[…] is a theorized phenomenon by which the future life expectancy of some non-perishable things, like a technology or an idea, is proportional to their current age.</em> <a href="#fnref:2" class="footnote-backref" role="doc-backlink">↩︎</a></p>
</li>
<li id="fn:3" role="doc-endnote">
<p>It also reminds me to some extent of a blog post I wrote a long time ago about <a href="/2016/04/04/nyc-subway-math.html">how long it takes to wait for the NYC subway</a>. <a href="#fnref:3" class="footnote-backref" role="doc-backlink">↩︎</a></p>
</li>
<li id="fn:4" role="doc-endnote">
<p>It's <em>roughly</em> the increase per time in the probability of finishing, which is the derivative of the cumulative density function (CDF) with respect to time, which is the probability density function (PDF).</p>
<p>It turns out this isn't <em>exactly</em> right. Early on, the CDF is convex, which means that you can project a better slope by aiming for a point further out. So the “ROI” ends up being:</p>
<center>$$ \max_{t' > t} \frac{\mathrm{cdf}(t') - \mathrm{cdf}(t)}{ t' - t} $$</center>
<p>Once derivative is decreasing, then this is maximized as $$ t \leftarrow t’ $$, which turns the expression above into the derivative, and the derivative of the CDF is just the PDF. That's reassuring! <a href="#fnref:4" class="footnote-backref" role="doc-backlink">↩︎</a></p>
</li>
<li id="fn:5" role="doc-endnote">
<p>All the code is <a href="https://github.com/erikbern/proj-mgmt-sigma">available on Github</a> <a href="#fnref:5" class="footnote-backref" role="doc-backlink">↩︎</a></p>
</li>
<li id="fn:6" role="doc-endnote">
<p>And on day 21 they will open source it and a bunch of other people will join and collaborate, and on day 42 they will create a startup and raise money and build API-integrations as a service, or something. Point is, you factor out common functionality not just across projects, but also across teams and companies. This all reduces predictability! <a href="#fnref:6" class="footnote-backref" role="doc-backlink">↩︎</a></p>
</li>
</ol>
</section>
Storm in the stratosphere: how the cloud will be reshuffled2021-11-30T00:00:00Zhttps://erikbern.com/2021/11/30/storm-in-the-stratosphere-how-the-cloud-will-be-reshuffled.html<p><img src="https://erikbern.com/assets/cloud-atmosphere-layers.jpeg" alt="cloud atmosphere layers"></p>
<p>Here's a theory I have about cloud vendors (AWS, Azure, GCP):</p>
<ol>
<li>Cloud vendors<sup id="fnref:1"><a href="#fn:1" class="footnote-ref" role="doc-noteref">1</a></sup> will increasingly focus on the lowest layers in the stack: basically leasing capacity in their data centers through an API.</li>
<li>Other pure-software providers will build all the stuff on top of it. Databases, running code, you name it.</li>
</ol>
<p>We currently have cloud vendors that offer end-to-end solutions from the developer experience down to the hardware:</p>
<p><img src="https://erikbern.com/assets/cloud-aws-stack.png" alt="cloud aws stack"></p>
<p>What if cloud vendors focus on the lowest layer, and other (pure software) vendors on the layer above?</p>
<p><img src="https://erikbern.com/assets/cloud-new-stack.png" alt="cloud new stack"></p>
<p>Feel free to bring this up in five years to make me embarrassed about how wrong I turned out to be. But let me walk you through my thinking—I think some of it is quite well illustrated through the story of Redshift.</p>
<h1 id="redshift-and-what-happened">Redshift and what happened</h1>
<p>Redshift is a data warehouse (aka OLAP database) offered by AWS. Before Redshift, it was the dark ages. The main player was Teradata, which had an on-prem offering. Startups said no to SQL and used Hadoop—SQL was kind of lame back then, for reasons that in hindsight appear absurd. I'm very happy we're out of this era.</p>
<p>Anyway, one vendor was a company called ParAccel. AWS <a href="https://news.ycombinator.com/item?id=18992467">licensed their technology</a>, rebranded it Redshift, and launched in 2012.</p>
<p>Redshift at the time was the first data warehouse running in the cloud. It was a brilliant move by AWS, because it immediately lowered the bar for a small company to start doing analytics. You didn't have to set up any infrastructure yourself, or write <a href="/2018/08/30/i-dont-want-to-learn-your-garbage-query-language.html">custom mapreduce</a> and reload the jobtracker all day. You could spin up a Redshift cluster in AWS, feed it humongous amounts of data, and it would … sort of just work.</p>
<h2 id="enter-snowflake">Enter Snowflake</h2>
<p>Snowflake<sup id="fnref:2"><a href="#fn:2" class="footnote-ref" role="doc-noteref">2</a></sup> is a $100B+ publicly traded company. Basically their entire offering is a data warehouse that looks fairly similar to Redshift.<sup id="fnref:3"><a href="#fn:3" class="footnote-ref" role="doc-noteref">3</a></sup></p>
<p>If you looked at Redshift in 2012, there was a lot of things that favored it. AWS had large economies of scale, had control of the underlying substrate (EC2), and could make larger investments in building the software. Maybe because of the value of lock-in, they could even subsidize the development of Redshift and make up the money through other products. Anyway, this is what it looks like nine years later<sup id="fnref:4"><a href="#fn:4" class="footnote-ref" role="doc-noteref">4</a></sup>:</p>
<p><img src="https://erikbern.com/assets/cloud-db-ranking.png" alt="cloud db ranking"></p>
<p>What happened? But my more general question is: what are the forces that favor a company like Snowflake?<sup id="fnref:5"><a href="#fn:5" class="footnote-ref" role="doc-noteref">5</a></sup> And what does that mean for other cloud products?</p>
<h1 id="what-if">What if….?</h1>
<p>There's some sort of folk wisdom that the lowest layer of cloud services is a pure commodity service. So in order to make money you need to do at least one of:</p>
<ol>
<li>Make money higher up in the stack.</li>
<li>Use services higher up in the stack to lock customers in. Then make money lower in the stack.</li>
</ol>
<p>I think there's some truth to these, at least looking historically, but there are some interesting trends blowing in the other way:</p>
<ul>
<li>The “software layer on top” is getting incredibly competitive. There's so many startups going after it, fueled by cheap VC money and willing to burn billions of dollars on building software.</li>
<li>Cloud vendors might be pretty happy making money just in the lowest layer. Margins aren't so bad and vendor lock-in is still pretty high.</li>
</ul>
<h2 id="startups-are-coming-for-the-cloud">Startups are coming for the cloud</h2>
<p>There's never been this many companies going after services that traditionally belonged to the cloud vendors:</p>
<p><img src="https://erikbern.com/assets/cloud-services.png" alt="cloud services"></p>
<p>What's going on? Probably a confluence of a lot of things. If I was tired, I would just shrug and say something like “startup circle of life, whatever”. And I think this is roughly one factor, but I see at least 3 different ones:</p>
<ol>
<li>Incentives at big companies often makes it hard to ship new crazy ideas. At the same time, VCs are pouring in money into the segment. If you're an ambitious person, do you go work at AWS? Or do you join an early stage startup, or create your own? It's expected that innovation shifts away from big companies to startups.</li>
<li>Software vendors can build for all the cloud vendors at the same time. I think this was a real benefit for Snowflake, since a lot of their early customers were banks who care about multi-cloud, but more generally it also expands the market size vs the reach of any cloud vendor.</li>
<li>A lot of the successful cloud products started out as internal services. This has been an amazing source of products, that have been battle-tested at Amazon, Google, and Microsoft scale, and it makes sense that those tools are a great match for their big enterprise customers. But the flipside of the extreme focus on scale, reliability, and configurability, is that the developer experience has become an attack vector, in particular when you look at mid-market and smaller customers who may care more about improving developer productivity. Slightly larger companies like Uber, Netflix, and Airbnb have a history of teams leaving to commercialize internal tools (often through the intermediate step of open sourcing it). Somewhat subjectively and anecdotally, these tools tend to have a much higher focus on developer experience.</li>
</ol>
<h2 id="maybe-owning-the-lowest-layer-isnt-so-bad">Maybe owning the lowest layer isn't so bad?</h2>
<p>Let's say a customer is spending $1M/year on Redshift. That nets AWS about<sup id="fnref:6"><a href="#fn:6" class="footnote-ref" role="doc-noteref">6</a></sup> $500-700k in gross profits, after paying for EC2 operational cost and depreciation. If that customer switches their $1M/year budget to Snowflake, then about $400k<sup id="fnref:7"><a href="#fn:7" class="footnote-ref" role="doc-noteref">7</a></sup> goes back to AWS, making AWS about $200k in gross profits.</p>
<p>That seems kind of bad for AWS? I don't know, we ignored a bunch of stuff here. Snowflake's projected<sup id="fnref:8"><a href="#fn:8" class="footnote-ref" role="doc-noteref">8</a></sup> 2022 research and development costs are 20% of revenue, and their sales and marketing costs are 48%! For a million bucks revenue, that's $700k. Translated back to AWS, maybe AWS would have spent $300-400k for the same thing? Seems reasonable.</p>
<p>Now the math suddenly adds up to me. AWS basically ends up with the same bottom line impact, but effectively “outsources” to Snowflake all the cost of building software and selling it. That seems like a good deal for them!</p>
<h2 id="what-about-lock-in">What about lock-in?</h2>
<p>The other argument for why AWS should build their own software services is that it increases lock-in. So maybe Redshift in itself isn't a cash cow, but it decreases the churn on EC2.</p>
<p>I'm not so sure? I spent six years as a CTO and moving from one cloud to another isn't something I even remotely considered. My company, like most, spent far more money on engineer salaries than the cloud itself. Putting precious eng time on a cloud migration isn't worth it unless cloud spend starts to become a significant fraction of your gross margins. Which is true for some companies! But those are in a minority.</p>
<p>A significant factor in all of this is that existing infra provides significant “gravity”. It's not like you can just pick whichever cloud vendor has the cheapest database and run your DB there. You want to run things in the same cloud provider<sup id="fnref:9"><a href="#fn:9" class="footnote-ref" role="doc-noteref">9</a></sup> and in the same data center<sup id="fnref:10"><a href="#fn:10" class="footnote-ref" role="doc-noteref">10</a></sup>. Looking at sign-up flows for cloud products gives us a hint:</p>
<p><img src="https://erikbern.com/assets/cloud-sign-up-flows.png" alt="cloud sign up flows"></p>
<p>The screenshots above show the onboarding for Snowflake, Confluent, and MongoDB (Atlas). They all ask:</p>
<ol>
<li>What's your cloud vendor?</li>
<li>What region?</li>
</ol>
<p>Note that the <em>only</em> options for the first questions are AWS, GCP, and Azure.</p>
<p>The other side of the equation of a potential cloud migration is—how much money you can save? And I think the truth it's never going to be substantial, since <a href="https://en.wikipedia.org/wiki/Co-opetition_(book)">no one wants to start a price war</a>. Being in a fairly stable oligopoly seems pretty nice and cozy, and if I was cloud vendor, I wouldn't try rock the boat.</p>
<h1 id="the-cloud-in-2030">The cloud in 2030</h1>
<p>We're roughly 10 years into the shift to the cloud, and even though it feels like it's transformed how we build software, I think we're still just getting started. I really wouldn't be surprised to wake up in a world where <a href="https://twitter.com/irvinebroque/status/1461002308209152009">most developers don't interact with cloud vendors</a>.</p>
<p>Big transformations tend to happen in two stages. The first step happens when some new technology arrives and people adopt to it in the simplest way that lets them retain their conceptual models from the existing world. The real transformations happens later, when you rethink the consumption model because the new world opens up new ways to create value. The way we consumed music didn't change materially when Apple started selling songs online. The real transformation happened when providers like Spotify realized the whole notion of ownership didn't matter anymore.</p>
<p>If you think about it from that angle, the last 10-15 years look a bit like a dumb “lift and shift”. Crudely speaking, we took computers and we put them in the cloud. Is that really the right abstraction for where we are? I don't think so. I think new higher level tools will let us focus on building application code and not worry about the underlying infrastructure.</p>
<h2 id="startups-are-coming-for-your-code">Startups are coming for your code</h2>
<p>The forces I've talked about have been most clear when you look at Snowflake vs Redshift, but you can see it in other places too. Transactional databases is another very exciting area. But where I think we'll see the most change is how software vendors will increasingly run customer code.</p>
<p>This isn't exactly a new idea—Heroku launched in 2007, and AWS Lambda in 2014. Kubernetes has been this interesting trend in the last few years on what I think is still essentially an inevitable march towards a fully “serverless” world, whatever <a href="https://twitter.com/isamlambert/status/1460659840108220417">that means to you</a>.</p>
<p>I wonder if a weird corollary of this is… maybe it's actually really good for the planet? The computers sitting in the cloud are ridiculously underutilized—my guesstimate of average CPU utilization is that it's maybe 10%? If I had a Ph. D. in bin packing, I'd go looking for a job at some serverless infrastructure provider right now.</p>
<p>One way to tell the story in 2030 looking backwards is that the cloud vendors needed software running on top of it, so they had to provide that themselves first, in order to drive cloud adoption. Luckily they already had a bunch of internal stuff they could ship! But eventually the market matured, and they could focus on the place in the stack where they had the strongest advantage.</p>
<h2 id="predictions">Predictions</h2>
<ul>
<li>The cloud market will grow to $1T/year in revenue. Ok, that's almost entirely noncontroversial.</li>
<li>Most engineers will never interact directly with cloud vendors, but through services on top of those.</li>
<li>The database market (OLAP, OLTP, you name it) will be dominated by vendors running on top of cloud vendors, where the underlying layer is completely abstract.</li>
<li>We will have some amazing new runtimes, finally figuring out the developer experience problems that are currently holding serverless solutions back.</li>
<li>We will see a lot of partnerships between startups and cloud vendors, where a cloud vendor may concede an area and try to be a preferred partner with a startup instead.</li>
<li>Kubernetes will be some weird thing people loved for five years, just like Hadoop was 2009-2013, but the world will move on.</li>
<li>Resource utilization in the cloud will be much better, and engineers will spend an order of magnitude less time thinking about resource allocation and provisioning.</li>
<li>IBM has finally given up on “hybrid multi-cloud”.</li>
<li>YAML will be something old jaded developers bring up after a few drinks. You know it's time to wrap up at the party at that point.</li>
</ul>
<p>This generated <a href="https://news.ycombinator.com/item?id=29411566">a bunch of comments on Hacker News</a>, most of which strongly disagree! Looking forward to see what the world looks like in 10 years.</p>
<p><em>Thanks to <a href="https://twitter.com/josh_wills">Josh Wills</a>, <a href="https://twitter.com/akshat_b">Akshat Bubna</a>, and <a href="https://twitter.com/sarahcat21">Sarah Catanzaro</a> for feedback on an earlier version of this post!</em></p>
<section class="footnotes" role="doc-endnotes">
<hr>
<ol>
<li id="fn:1" role="doc-endnote">
<p>I'm ignoring the CDN world a bit here. It's very clear <em>right now</em> that Cloudflare is doing an amazing job owning the stack all the way from developer experience to networking equipment. But frankly I don't see any long-term foundational difference operating 300 small data centers vs 30 large ones. Cloudflare has done exceptionally well staying ahead of the innovation game, but I suspect the same economic forces that apply to AWS et al eventually apply to them too. <a href="#fnref:1" class="footnote-backref" role="doc-backlink">↩︎</a></p>
</li>
<li id="fn:2" role="doc-endnote">
<p>A fun thing is I randomly had lunch with the Snowflake founders in 2012 and they offered me a job the next day. The company was like… 10 people in total? <a href="#fnref:2" class="footnote-backref" role="doc-backlink">↩︎</a></p>
</li>
<li id="fn:3" role="doc-endnote">
<p>There was one major architectural difference of Snowflake vs Redshift. A very underappreciated tech shift is how much faster networks got around that time. Up until that point, the wisdom was “move compute to data”, but Snowflake bet early on a full decoupling. AWS <a href="https://www.businesswire.com/news/home/20161130006129/en/AWS-Launches-Amazon-Athena">launched Athena</a> in 2016 which was based on <a href="https://prestodb.io/">Presto</a>, not Redshift, and <a href="https://aws.amazon.com/about-aws/whats-new/2017/04/introducing-amazon-redshift-spectrum-run-amazon-redshift-queries-directly-on-datasets-as-large-as-an-exabyte-in-amazon-s3/">launched Redshift Spectrum</a> in 2017 which lets you query data in S3 through Redshift. As a bizarre coincidence, Redshift just launched a <a href="https://aws.amazon.com/about-aws/whats-new/2021/11/amazon-redshift-serverless/">serverless product today</a>, which is something they probably should have done a long time ago. <a href="#fnref:3" class="footnote-backref" role="doc-backlink">↩︎</a></p>
</li>
<li id="fn:4" role="doc-endnote">
<p>This is from <a href="https://db-engines.com/en/ranking">DB rankings</a>. <a href="#fnref:4" class="footnote-backref" role="doc-backlink">↩︎</a></p>
</li>
<li id="fn:5" role="doc-endnote">
<p>A pretty long <a href="https://larskamp.medium.com/why-we-sold-intermix-io-to-private-equity-in-a-shifting-market-5bdb3e4e30a4">history about Redshift vs Snowflake</a>, which also points out that AWS unintentionally ended up incentivizing their sales teams to recommend Snowflake to customers. <a href="#fnref:5" class="footnote-backref" role="doc-backlink">↩︎</a></p>
</li>
<li id="fn:6" role="doc-endnote">
<p>The margins on EC2 is <a href="https://www.cnbc.com/2021/09/05/how-amazon-web-services-makes-money-estimated-margins-by-service.html">reportedly about 50% and about 60% for AWS as a whole</a>. Just comparing instance pricing <a href="https://aws.amazon.com/redshift/pricing/">for Redshift</a> and <a href="https://aws.amazon.com/ec2/pricing/">for EC2</a> for equivalent instance types also gives a good idea of the Redshift markup above EC2. <a href="#fnref:6" class="footnote-backref" role="doc-backlink">↩︎</a></p>
</li>
<li id="fn:7" role="doc-endnote">
<p>Snowflake is a public company and you can compute their margins from their <a href="https://investors.snowflake.com/news/news-details/2021/Snowflake-Reports-Financial-Results-for-the-Second-Quarter-of-Fiscal-2022/default.aspx">latest quarterly report</a>. <a href="#fnref:7" class="footnote-backref" role="doc-backlink">↩︎</a></p>
</li>
<li id="fn:8" role="doc-endnote">
<p>From <a href="https://s26.q4cdn.com/463892824/files/doc_financials/2022/q2/Q2-FY22-Snowflake-Investor-Presentation_Final-(2).pdf">Snowflake's investor presentation</a> <a href="#fnref:8" class="footnote-backref" role="doc-backlink">↩︎</a></p>
</li>
<li id="fn:9" role="doc-endnote">
<p>Security is another topic that drives this, although security to some extent works <em>against</em> startups: the bar to adopt additional AWS products is often lower than completely new vendors. <a href="#fnref:9" class="footnote-backref" role="doc-backlink">↩︎</a></p>
</li>
<li id="fn:10" role="doc-endnote">
<p>Cloudflare is <a href="https://blog.cloudflare.com/aws-egregious-egress/">actively going after the very high AWS egress fees</a> and it's going to be interesting to see how that plays out. <a href="#fnref:10" class="footnote-backref" role="doc-backlink">↩︎</a></p>
</li>
</ol>
</section>
What is the right level of specialization? For data teams and anyone else.2021-07-23T00:00:00Zhttps://erikbern.com/2021/07/23/what-is-the-right-level-of-specialization.html<p>This isn't as much of a blog post as an elaboration of a tweet I posted the other day:</p>
<blockquote class="twitter-tweet"><p lang="en" dir="ltr">I think this specialization of data teams into 99 different roles (data scientist, data engineer, analytics engineer, ML engineer etc) is generally a bad thing driven by the fact that tools are bad and too hard to use</p>— Erik Bernhardsson (@bernhardsson) <a href="https://twitter.com/bernhardsson/status/1417664482776690692?ref_src=twsrc%5Etfw">July 21, 2021</a></blockquote>
<script async src="https://platform.twitter.com/widgets.js" charset="utf-8"></script>
<p>This seem to have resonated with a lot of people, but for whatever reason, it ended up being a lot more polarizing than I thought! There was a fair amount of misunderstanding of what I meant, so I just wanted to expand this into a slightly longer argument:</p>
<h2 id="specialization-is-a-good-thing">Specialization is a good thing</h2>
<p>I'm all for specialization! The society has come a long way from <a href="https://en.wikipedia.org/wiki/Subsistence_agriculture">subsistence agriculture</a> and that's almost objectively a good thing. The economy organizes people into different trades and different professions and lets people benefit from their <a href="https://en.wikipedia.org/wiki/Comparative_advantage">comparative advantage</a>.</p>
<p>There were a few replies (and <a href="https://twitter.com/tunguz/status/1417827377376202757">subtweets</a>) misunderstanding my tweet as an argument against specialization. Which is a bit frustrating, because I think it's pretty useless to argue against for or against specialization. Clearly, neither extreme is good? Like, subsistance agriculture isn't great, but you could imagine going in the other extreme and organizing the society around people doing exactly one thing well and nothing else.</p>
<p>A restaurant could have one chef who only chops onions, another one who only souffles things, another one who only makes apple tarts. If this sounds dumb, then it's because it's intentionally hyperbolic! My point is, neither extreme is good, so the question is: what's the <em>right level</em> of specialization?</p>
<h2 id="what-are-some-drawbacks-of-specialization">What are some drawbacks of specialization?</h2>
<p>Not an exhaustive list:</p>
<ul>
<li>Resource allocation. If you have a chef who only chops onions, they are probably idle most of the time. That sounds bad! If they are more versatile, they can jump around and do a larger set of things, depending on what's needed at the moment.</li>
<li>Reduction of transaction cost. If every project involves coordinating 1,000 specialists, and each of those specialists have their own backlog with their own prioritization, then (a) cycle time would shoot up, with a lot of cost in terms of inventory cost and lost learning potential (b) you would need a ton more project management and administration to get anything done.</li>
</ul>
<h2 id="specialization-is-probably-driven-a-lot-by-bad-tools">Specialization is probably driven a lot by bad tools</h2>
<p>So I think the question is, what is the right level of specialization? A bunch of people replied to me saying you need different roles because (I'm just picking one example) some people are better at training models, while some people are really good at all figuring out how to wrangle with Kubernetes and all of that stuff to get models deployed. <em>Which is exactly the point I was trying to make</em>. It seems fair that, if tools didn't require so much knowledge to use (I'm looking at you, Kubernetes), then on the margin, the need for specialization would be less.</p>
<p>I'm super interested in this because I spent about 12 hours every day thinking about tools in the data science space. People are spending way too much time working on things that have nothing to do with their business. We have come a long way, but I still see people wasting <em>way</em> too much time debugging YAML, waiting for deployments, or begging the SRE team for help.</p>
<h2 id="its-dangerous-when-people-lose-sight-of-the-goal">It's dangerous when people lose sight of the goal</h2>
<p>I often think of people as (and this is an unfair crude generalization etc) roughly on a spectrum between <em>tools-oriented</em> and <em>goal-oriented</em>. Some people have their favorite tools, and that's what they like to use. They make their whole career about honing a craft with those skills. Other people are more entrepreneurial, and don't care about what tools they use: they care about the ultimate goal.</p>
<p>I think tools-oriented people can be valuable in certain contexts, like if you need some super deep expertise on some topic. If you're trying to build a lithium mine in Angola, you might want to find experts in lithium mining and Angolan mineral rights.</p>
<p>But a lot of the time, experts can also be a huge liability, because they are overly biased towards picking tools that they have deep skills in. If you hire the world's foremost expert in functional data structures for your e-commerce startup, you probably shouldn't be surprised if that person wants to use functional data structures? And maybe that's fine, if you are convinced that 100% of your problem can be expressed as operations on functional data structures, but more likely that's not a pragmatic perspective, and you end up picking suboptimal tools for the job.</p>
<p>When this ends up segmenting different life cycles of a product, I think it gets even more sketchy. So much of the total cost of building tech products is post lauch. But also the opportunity to start iterating on it and learning from it! Adding hand-off points because of specialization feels like putting up a <a href="https://www.investopedia.com/terms/c/chinesewall.asp">Chinese Wall</a> (in the business sense) between two functions that constrains the information flow and obstructs the value.</p>
<p>And what I also see to some extent is a bit of an entitlement attitude in some developers. They aren't interested in doing the last 10% of the work that you need to get 100% of the value. Which frankly, I don't really understand, because here's the opportunity to shine. Let's say you built a model that can save a gazillion trillion dollars for your company. If there was a tool to press a button to put it into production, why wouldn't you want that? You can do it yourself without having to coordinate with other teams, and you can be the hero of the day!</p>
<p>(I'm writing this about deploying ML models, but that's really just one example… there's a lot more going on in the data world: pipelines, reporting, monitoring, …).</p>
<p>I mean, I think we're very far from this, tools-wise, but we should aspire to get there! Let's not argue against this world on arbitrary grounds of the benefit of specialization. Let's instead think about what that world would look like, and what tools we would need to get there, and then <em>let's build those tools</em>. This is basically what I'm obsessed with and I think it's a somewhat ambitious perspective, but I think there's an incredible opportunity!</p>
Building a data team at a mid-stage startup: a short story2021-07-07T00:00:00Zhttps://erikbern.com/2021/07/07/the-data-team-a-short-story.html<p>I guess I should really call this a parable.</p>
<p>The backdrop is: you have been brought in to grow a tiny data team (~4 people) at a mid-stage startup (~$10M annual revenue), although this story could take place at many different types of companies.</p>
<p>It's a made up story based on n-th hand experiences (for n ≤ 3), and quite opinionated. It's a story about teams and organization, not the tech itself. As a minor note, I deliberately use the term “data scientist” to mean something very broad.</p>
<p><img src="https://erikbern.com/assets/data-story-mainframe.jpeg" alt="mainframe"></p>
<h2 id="july-1-morning">July 1: morning</h2>
<p>It's your first day as head of the data team at SuperCorp! The CEO gave a quick but passionated pitch during your interview process how the world is changing and how the company needs to keep up with all the crazy data stuff going on. They whole exec team is super psyched.</p>
<p>The first few hours, you get access to all the major systems. You start browsing around in the Git repo and discover some interesting code. It looks like a neural network for churn prediction. You start to parse through the code but you're interrupted by a calendar notification that you have a 30 minute intro meeting with the Chief Marketing Officer.</p>
<p>The CMO is super energetic. “We're so excited you're here”, she says. “I recently talked to my buddy at HyperCorp who runs marketing and they are working with a vendor to use AI for user segmentation. Pretty cool! I can't wait for you to sink your teeth into it.” After a bit of chit chat, you start to probe into the data practices of the marketing team. “How is the customer acquisition cost looking”, you ask? “Well…", the CMO says, “pretty awesome actually. Our data scientist ran the numbers, and our online ad cost per click keeps going down.”</p>
<p>You're a bit confused because you were told all data scientists would report into the data team, but apparently other functions have their own data scientists? You make a note to follow up.</p>
<p>The CMO continues: “The real problem is that the growth team aren't converting all the traffic we're driving to the site.”</p>
<p>You ask if there's a dashboard to look at to see the conversion funnel but the CMO says it's the growth team's job to convert the leads.</p>
<p>Later that day, you spend time with some of the product managers. There's just been a big redesign of the start page and the lead PM of that effort is really excited because the number of user registrations went up by 14%. You ask them if the difference is statistically significant but you get a blank stare back. “That's not my job to figure out, that's your team”, the PM says. “Last time we asked them, they said they didn't have the data, and it would take months for them to get it.”</p>
<p>For whatever reason, you can tell that the product manager has more to say, so you let her continue</p>
<p>“Besides, amazing stuff isn't built on incremental changes. We decided not to A/B test this change because sometimes you need to make big bets that takes you out of your local maxima. Steve Jobs didn't A/B launching the iPhone! My team crushed it delivering this launch two days before the deadline and that's what matters!”</p>
<p>You try to look busy by scribbling down some notes in your notebook.</p>
<p>You spend the rest of the day talking to your new team. It's a small team of only three people, but you have been given a budget to grow it to 10 by the end of the year. The people in your team are clearly excited by your arrival. They walk you through what they built so far. There's the neural network for churn prediction that you saw earlier. There's a notebook with an implementation of a whole recommendation system for finding related items to buy. There's a lot more stuff, some of it quite cool.</p>
<p>You notice a a lot of the code starts with very complicated preprocessing steps, where data has to be fetched from many different systems. There appears to be several scripts that have to be run manually in the right order to run some of these things.</p>
<p>You ask the team why they haven't been launced in production. The data team looks frustrated. “When we talk to the engineers, they say it's a very large project to get this to production-level. The product managers have put it on the backlog, but they keep pushing it off because other things keep coming up. We need executive support for this.”</p>
<h2 id="july-1-afternoon">July 1: afternoon</h2>
<p>Later in the day, you talk to the head of supply chain. He doesn't seem as excited as the CMO. “Frankly, I don't know if I need help from the data team”. he says. “We don't have those types of problems. What I need is business analysts. I have a whole team, and they are spending hours and hours every day working on a very complex model. They don't even have time to answer basic questions I have. I have a whole spreadsheet full of questions I'm dying for answers to.”</p>
<p>You look at the spreadsheet and discover things like: <em>What's the conversion rate of customers who filed a support ticket and got a ticket resolution in <1h versus the conversion rate for the customers who got a ticket resolution in >= 1h? Break down by order value in buckets of $100 intervals.</em></p>
<p>When you ask about the “model”, it turns out it's a very complex thing in Google Sheets with lots of VLOOKUPs and data that has to be copy-pasted into the right tab in the right format. The data is updated daily and the output of the model determines the team priorities for the day. Not just that, but they rely on the spreadsheet to calculate payments to the vendors.</p>
<p>You go home that day and pour a large glass of whiskey.</p>
<center>🥃</center>
<h2 id="whats-happening-so-far">What's happening so far?</h2>
<p>This is basically a (somewhat cynical) depiction of things that may happen at a lot of companies early in the data maturity stage:</p>
<ul>
<li>Lack of data, and fragmented data
<ul>
<li>The product is poorly instrumented so data often doesn't exist in the first place</li>
<li>A fragmentation of data systems, with data spread out over many different ones</li>
<li>Brittle business processes driven by data but with little or no automation</li>
</ul>
</li>
<li>An unclear expectation of what the data team's job is supposed to be
<ul>
<li>Data scientists hired to do R&D and figure out some way to deploy AI or whatever — as a result not having any clear business goal</li>
<li>Data team complaining about it being hard to productionize ML, yet the product team doesn't really seem to care about the feature</li>
<li>People in need of “English-to-SQL translators”</li>
</ul>
</li>
<li>A product team not trained to be data driven
<ul>
<li>Product managers not thinking about data as a tool for building better features</li>
<li>A lack of alignment between what product teams want to build versus what data teams have</li>
</ul>
</li>
<li>A culture that fundamentally is at odds with being data driven
<ul>
<li>A culture of celebrating shipping, versus celebrating measurable progress and learnings</li>
<li>To the extent teams actually use metrics, they are inconsistent, poorly measured, and in some cases at conflict with other teams</li>
</ul>
</li>
<li>No data leadership
<ul>
<li>A fractured data org with various data people reporting into other functional areas</li>
<li>Other departments not getting the help they need, so they work around the data team and hire lots of analysts</li>
<li>Lack of standardizations of toolchain and best practice</li>
</ul>
</li>
</ul>
<p>Wow! This is depressing! Let's talk about what you can actually do to break out of this.</p>
<h2 id="july-8">July 8</h2>
<p>The next week you start setting a new direction for the data team. One of the people in the data team turns out to have a bit more experience with infrastructure, so you put him in charge of setting up a centralized data warehouse. Right now, you just need the fastest route to get data into one place. The plan is basically to just dump the production database tables into the data warehouse every hour.</p>
<p>It turns out the framework you use for ad tracking on the frontend makes it easy to export the huge event logs into the data warehouse, so you set that up as well.</p>
<p>You make a mental note that this is tech debt you're going to have to revisit later.</p>
<p><img src="https://erikbern.com/assets/data-story-infra.png" alt="basic data flow">
<em>Fig 1: Extremely crude distillation of how the data gets into the data warehouse</em></p>
<p>You work with the recruiting team to define a profile for a generalist data role, that emphasizes core software skills, but with a generalist attitude and a deep empathy for business needs. For now, you remove all the mentions of artificial intelligence and machine learning from the job posting.</p>
<p>You spend a bit more time with the various data people that do not report to you. The data scientist in the marketing team is a young person and you can tell she's super excited to talk to you. “I've always wanted to become a data scientist, and I can't wait to learn from you” she says.</p>
<p>Later that day, you call your friend who runs a coding bootcamp and ask them if they have any great SQL training classes. They have, so you set something up for later that month.</p>
<p>You start working on a presentation for the product team about A/B testing and how it works. You showcase many examples of tests with unexpected outcomes from your previous experience, and you make parts of the presentation a bit interactive where the audience has to guess whether test or control won.</p>
<p>You track down the CEO's executive assistant and get some time on her calendar later that week. Your goal is to figure out a few metrics she wants reported on weekly in an automatic email.</p>
<p>Later that week, you talk to a few of the business analysts in the supply chain team and you realize they are also reasonable people, but they seemed scarred from previous interactions with the data team.</p>
<p>One of them has experience using SQL in his past job. He has a question for you about conversion rates that you realize should be possible to answer with the few tables that are already replicated to the data warehouse, so you give him access and tell him to give it a shot. You don't really know what to expect but figure it's worth a shot.</p>
<p>You set up weekly 1:1s with a number of key people across the org that need data. The point is to find data gaps and opportunities and dispatch it to the data scientists. Some of your data scientists are a bit disappointed since the research work needs to get deprioritized. “We need to focus on delivering business value as quickly as possible”, you say, but you add that “we might get back to the machine learning stuff soon… let's see”.</p>
<h2 id="september-1-morning">September 1: morning</h2>
<p>It's been three months, but you feel like you're starting to make progress with some of the stuff. In your weekly 1:1s with various stakeholders, you keep finding huge blind spots and opportunities for data to make a difference. You use these things as a forcing function for a lot of core platform work. In particular, many pipelines need to be built to produce “derived” datasets. There's a high upfront cost of those analyses, but subsequent analyses are <em>much</em> easier once the right datasets have been built.</p>
<p>You have started opening up access to the data warehouse internally to other teams in other departments. Some of the people are starting to pick up SQL and doing a lot of basic analyses themselves. An early win is that one of the junior product managers discovers that the conversion rate on iOS Safari is extremely bad. It turns out there's a frontend bug with local storage that's a one-liner to fix.</p>
<p>When you're thinking about all the progress you've made already, you're suddenly interrupted by an email from the head of supply chain. He's pissed. Apparently nothing is working with their model and it's a big problem for them.</p>
<p>You immediately send a Slack message to the person you know there. He's the business analyst who eagerly started writing SQL when you gave him access. It's super stressed. “The table in the database changed, and suddenly our SQL query we use to populate the spreadsheet generates nonsense output”.</p>
<p>When you look at the SQL query, you almost spit out your coffee. It's a 500 lines long query. The author of the query seems apologetic but at the same time a bit annoyed. “We kept coming to you several times asking for help with these questions”, he says, “and you told us you didn't have resources, so we built it ourselves”.</p>
<p>The data scientist in your team who gets assigned the monster SQL query isn't happy. “That team is stupid for writing those queries… we told them this would happen. These MBA types are useless. Besides, I was hired to work on machine learning, not to debug SQL queries”, he says. You're desperate so you try to dangle a carrot in front of him. “Please try to do what you can, and I promise we'll find some cool machine learning problem for you later this month”, you say.</p>
<h2 id="september-1-afternoon">September 1: afternoon</h2>
<p>Later that day, you're in a meeting going through recent launches. The product manager of the checkout team goes through a major overhaul of the credit card flow. But when you ask him if they saw any improvements on relevant metrics, he is confused. “We haven't had time to look into that”, he says. You're disappointed because just a crude analysis would have been very easy to do for one of the data scientists.</p>
<p>At least, later that day you feel a bit better. The data scientist in the marketing team emails you and says she's talked to her manager. The CMO is totally fine if she reports to you, but makes it clear that “I need her 100% of the time dedicated to marketing.” You loop in the HR and asks them to make the updates in the internal systems to do the management change. Even though she's obviously very junior, you have been impressed with her ability to grasp complex business problems.</p>
<p>You wrap up work that day at 9pm and pour a big glass of red wine for yourself. The bottle is already open and you don't want the wine to go to waste, so you drink the rest of it too.</p>
<center>🍷</center>
<h2 id="whats-happening">What's happening?</h2>
<p>You're starting to lay the most basic foundation of what is most critically needed: all the important data, in the same place, easily queryable. Opening up SQL access and training other teams to use it means a lot of the “SQL translation” goes away.</p>
<p>The flipside is, some teams will go too far with their newfound freedom. It's tempting to prevent this by putting very strict guardrails on access to data, but this can often have more drawbacks. People are generally mostly rational, and do things that generate positive ROI for the business, but they might not understand what the data team can build for them. That's your job to demonstrate!</p>
<p>Similarly, with the checkout team you see something similar: there was a simple analysis your team could have done, but didn't happen, because that team didn't know who to ask.</p>
<p>These are primarily <em>organizational</em> challenges. Teams don't know how to work with the data team. You're probably a bottleneck, even though you don't realize it. Other teams will build around the data team. Lots of “simple” analyses are not getting done.</p>
<p>What I think makes most sense to push for is a <em>centralization the reporting structure</em>, but keeping the <em>work management decentralized</em>.</p>
<p>Why? Primarily because it creates a much tighter feedback loop between data and decisions. If every question has to go through a central bottleneck, transaction costs will be high. On the other hand, you don't want to decentralize the <em>management</em>. Strong data people want to report into a manager who understands data, not into a business person.</p>
<p><img src="https://erikbern.com/assets/data-story-org-1.png" alt="decentralized data org">
<em>Fig 2: Data team with centralized backlog and centralized management</em></p>
<p>Instead, push out the resource management to other teams. Given them a handful of data people to work with, and let them work with them. Those data people will be able to iterate much more quicker, and will also develop valuable domain skills. This reduces the need for other teams to work around the data team and hire their own resources.</p>
<p><img src="https://erikbern.com/assets/data-story-org-2.png" alt="decentralized data org">
<em>Fig 3: Data team with decentralized backlog but centralized management</em></p>
<p>A good thing is to some extent your results drive organizational centralization in itself: the junior data scientists in the marketing team moves into your team because she <em>wants</em> to work for you.</p>
<h2 id="september-2">September 2</h2>
<p>Your data team at this point has grown to six people. One of them is super busy with the infrastructure related to the data warehouse. For the other five, you assign each one of them to a team:</p>
<ul>
<li>One of them is assigned to the onboarding product team.</li>
<li>The second is assigned to the supply chain team</li>
<li>The third is assigned to the checkout team.</li>
<li>You already have the data scientist from the marketing team working on marketing</li>
<li>The final person is assigned to support the CEO and helping with investor/board decks</li>
</ul>
<p>You send out an email to a large group of people outlining this change, and make it very clear who people should work with for their data needs. As you hire people going forward, you are planning to assign them to different teams throughout the company. Mostly product/engineering teams, but in some cases other teams.</p>
<h2 id="january-3">January 3</h2>
<p>You start the day with a frustrating email. One of your data scientists has decided to leave. “I'm going to AcmeCorp to join their new machine learning team”, he writes. You're not going to try to persuade him to stay. Frankly, he hasn't seemed particularly happy for a while, and you don't have much work he would be excited about.</p>
<p>You have a bunch of new people in the team that are more excited. Most of them are people who know a bit of software engineering, a bit of SQL, but most importantly have a deep desire to find interesting insights in the data. You think of them as “data journalists” because their goal is to find “the scoop” in the data.</p>
<p>One particular member of your team is working directly with the onboarding team. She talks to her product manager pretty much every day and the team loves her for the insights she's discovered. For instance, there was a big friction point where the onboarding flow asked for the customer's address even though it wasn't needed. Removing that step increased conversion rate by 21% in a subsequent A/B test. It wasn't easy to find this initially because the data model in the database was very complex and she had to build a set of ETL jobs to “flatten” the data into tables that are easier to query. But a bunch of Python jobs chained together did the trick.</p>
<p>Later that day, there's a quarterly review of all the major projects that happened. It's a big deal, and the CEO is in the room. She's excited about all the progress that's happening.</p>
<p>When the turn comes to the growth initiatives, the lead PM presents a new splashy landing page redesign that they launched. The PM points out several times that the team of 20 engineers was working overtime to hit the deadline and they did it. She walks everyone through the amazing job the designers did. It's beautiful. The CMO was very involved with the product because they made a big bet on direct mail as a part of the redesign. Everyone looks at the CEO to see what she thinks.</p>
<p>She's quiet for a while but then opens her mouth. “What are the metrics so far? Do we know if the customer acquisition cost went down?” she says, and you smile to yourself, because you've been hoping for this question.</p>
<p>The PM who put together this slide says they actually ran an A/B test and there are numbers in the appendix of the presentation. It shows a jumbled picture. Some of the metrics went up, and some went down. There's no result that shows a significant outcome. There's a table summarizing some early numbers for customer acquisition costs but the numbers look quite bad. The CMO emphasizes that the numbers are “still baking” and that for this type of campaigns, it can take many months for the users to transact.</p>
<p>You send a Slack message on your phone to someone in the data team that they should do a cohort plot of these things instead next time.</p>
<h2 id="whats-going-on">What's going on?</h2>
<p>The good news is that the product team is starting to experiment with A/B tests. The bad news is that it's ignoring the results and that projects seem mostly driven by milestones and artificial deadlines. The <em>excellent</em> news is the CEO is pushing for teams to use data as the truth.</p>
<p>Once there is an organizational pressure to be more data driven, this is a time to accelerate the way the data team works with other teams. In particular, people at the highest level will start to focus more on metrics, and it's your responsibility that the data team works with them on it. One simple thing that goes a long way is to work with every team and make sure they have their own dashboard with the top set of metrics they care about.</p>
<p><img src="https://erikbern.com/assets/data-story-service.png" alt="data team services">
<em>Fig 4: Different services for different layers of the org drives the most progress</em></p>
<h2 id="april-1">April 1</h2>
<p>Almost all of the old machine learning work done by the data team has gone nowhere with one exception. One of the data scientists who works with the inventory product team gets really interested in the earlier work on recommendations. She's one of the new team members you hired, who has a bit more of a generalist background. She picks up the notebook with the recommendation system work, and is able to turn it into a small Flask app deployed internally.</p>
<p>The product manager for the inventory team is ecstatic when she sees it. “How do we ship it?” she asks. One of the metrics the team tracks is average order value and she thinks this could drive big improvements.</p>
<p>A quick estimation reveals it's still a big problem to make it scale, but your data scientist has an idea. “What if we only launch it for 1% of all customers?” She says. “We could have it powered by a dumb cron job and pregenerate all the recommendations in a database. I think I can hack something together in a few days.” Everyone's excited about it so she gets started.</p>
<p>You have been spending a bit more time with the supply chain team and discovered a lot more gigantic SQL queries used for various business-critical things. They break a lot but your team is rewriting a lot of it into proper pipelines run by code. The head of supply chain wants more of your team. “Once you started getting involved, my team of business analysts are getting so much more done,” he says. “I'd do anything for you to hire more data scientists to support me!”</p>
<h2 id="ok-whats-happening-here">OK, what's happening here?</h2>
<p>First of all, there's a glimmer of hope for some of the cool machine learning work. It seems like the product team is finally excited about launching the recommendation system as a small test. It was previously stuck because the product engineering team couldn't estimate the work and didn't want to commit to it, but the data team didn't have the practical software skills to bring it to something where the work of productionizing it is more tangible.</p>
<p>What resolved this was the data team taking it one step further and actually building a demo. Not just does it bring it close to production, it also shows the potential in a more clear way.</p>
<p>It's easy for data teams to feel defeatist when these projects stall, like they were hired to do this cool AI stuff, but now the executive support went away. In practice I think it's more common they just didn't take it upon themselves to get the work to a place where it demonstrates value and is reasonably easy to ship.</p>
<p>The other thing is, note what's happening with the supply chain team. The journey is roughly:</p>
<ol>
<li>That team started out with their own “business analysts” (outside the data team) but need the data team to run queries for them to get data</li>
<li>Those business analysts are starting to run queries themselves with the help of the data team</li>
<li>They start to build up “shadow tech debt” (in this case monster SQL queries) which first causes a bunch of friction with the data team</li>
<li>The data team starts embedding into the team and helping them get to a better place</li>
<li>Because of the embedding, the need for business analysts goes down and data scientists goes up</li>
</ol>
<p>Note that you took on a lot of “tech debt” earlier when you started dumping the production database tables straight into the data warehouse. Data consumers downstream will have SQL queries that break a lot. Over time, you're going to have to add some sort of layer in between, that takes the raw data from the production database and translates it into various derived datasets that are more stable and easier to query. This will be a LOT of work to do right. It's probably also needed for security reasons: you need to strip out lots of PII in the production data.</p>
<h2 id="july-1">July 1</h2>
<p>It's planning meeting for Q3. Previously, these have often turn into big debates about what “bets” the company is making for the next few quarters. This time, you start by going through the company's high level key results. Each team then has sub-metrics that constitute a more granular breakdown of the top level metrics.</p>
<p>It's clear that your work with the product management team has paid off. The PMs often justify their investment in various projects by talking about what they learned running tests, or what they discovered in the data.</p>
<p>A major win is that one of your data scientists working with the checkout team discovered a major bug where users would hit the back button at the confirmation page which would cause the cart object to end up in a bad state. When they fixed this, there was a dramatic improvement in conversion rate.</p>
<p>Another insight has been that traffic from different ad campaigns have very different conversion profiles once they land on the site. It turned out some campaigns had very cheap clicks but converted terrible. Some other campaigns were quite expensive but those users convert extremely well.</p>
<p>Since you're now tracking the UTM parameters and tying it to the account creation, you can now measure the conversion rate from ad click to purchase. This wasn't possible before all the data was brought into the same data warehouse and normalized so you can query it easily. Working with the marketing team, the main KPI is now end-to-end customer acquisition cost, rather than cost per click.</p>
<p>Another exciting news is that the 1% recommendation system test has done exceptionally well. Even though it's a very substantial project to scale it up to 100% of users, the CEO greenlights the project.</p>
<p>Of course, all outcomes aren't positive. There's been a lot of tests that didn't work out. One of the first slides describes a test you ran where shipping is baked into the price rather than charged separately.</p>
<p>It's quiet in the room for a while until the CEO starts talking. “What did you learn from this?,” she asks. This leads to an engaging conversation where the outcome is to run a series of follow-up experiments to get to the bottom of what happened.</p>
<p>You go home that night and pop a champagne.</p>
<h2 id="what-just-happened">What just happened?</h2>
<p>You made it. You have transformed the organization to be truly data-native. The data team works cross functionally with lots of different stakeholders. Data and insights is used for planning. Data is used to drive business value and not a standalone lab with unclear goals. The company is working in an iterative way instead of big “waterfall” style planning, with quick data-driven feedback cycles. Metrics are defined in such a way that people feel a responsibility for generating business value. The data culture is driven both from above (the CEO pushing for it) as well as from below (people in the trenches). It's OK to fail if at least you learned something from it.</p>
<p>Congratulations — you deserve that champagne!</p>
<center>🥂</center>
<p><a href="https://news.ycombinator.com/item?id=27777594">Comments on Hacker News</a></p>
Software infrastructure 2.0: a wishlist2021-04-19T00:00:00Zhttps://erikbern.com/2021/04/19/software-infrastructure-2.0-a-wishlist.html<p>Software infrastructure (by which I include everything ending with *aaS, or anything remotely similar to it) is an exciting field, in particular because (despite what the neo-luddites may say) it keeps getting better every year! I love working with something that moves so quickly.</p>
<p>In the last few months, I've thought a lot about where it's going in the next 5-10 years and an wishlist has taken shape in my head. It's very opinionated! As in, you may not agree with these. That's fine — these are fundamentally <em>predictions</em> I'm making, or at least a wishlist. I'm OK if I'm right about some but not all of these. Let's dive right in.</p>
<h1 id="built-for-delight">Built for delight</h1>
<p>You know how crappy software is crappy in ways that are so blatantly obvious to the user that you wonder why it was released? A touchscreen interface that's super laggy, or an appointment booking app that forces you to go in and out of possible dates and fill in all information before it tells you if it's available. We've all seen janky stuff like that, and they are generally janky in the same way: it feels like <em>no one actually used the product</em> after it was built, and said like, hey, this is kind of annoying, maybe we should make it more intuitive?</p>
<p>In 99% of the cases, I imagine they ended up in this situation because someone spelled out a long checklist of requirements, but there was nothing on the checklist to make sure <em>the experience is delightful</em>. Like, someone started with a wall full of post-it notes going “as a user, I want to …". Which I think logically makes sense — you can define a requirement that users should be able to do x, y, z, but you can't <em>define</em> that the experience shouldn't suck.</p>
<p>Anyway, I feel like this applies to like 90% of software infrastructure products.</p>
<p>I mean, as a user, I can set up a static website in AWS, but it takes 45 steps in the console and 12 of them are highly confusing if you never did it before. And it's also super slow to do it, and any time I make a mistake, I end up in some weird state where maybe I broke something terribly and I might have to start over. It's <em>sad</em> this is the current state of infrastructure.</p>
<p>There's a lot to learn from how the best companies build consumer products. How they use data to identify friction points, and constantly experiment with changes to make things easier. I have a lot of hope here that natural selection will favor the products that are easy to get started and fun to use. The first step is, we just need more alternatives and not just a handful of big semi-monopolies. Can't wait.</p>
<h1 id="truly-serverless">Truly serverless</h1>
<p>We are, like what, 10 years into the cloud adoption? Most companies (at least the ones I talk to) run their stuff in the cloud. So why is software still acting as if the cloud doesn't exist?</p>
<ul>
<li>The word <em>cluster</em> is an anachronism to an end-user in the cloud! I'm already running things <em>in the cloud</em> where there's elastic resources available at any time. Why do I have to think about the underlying pool of resources? Just maintain it for me.</li>
<li>I don't ever want to <em>provision</em> anything in advance of load.</li>
<li>I don't want to pay for idle resources. Just let me pay for whatever resources I'm actually using.</li>
<li>Serverless doesn't mean it's a burstable VM that saves its instance state to disk during periods of idle.</li>
</ul>
<p>I could go on, but I won't. I'm dreaming of a world where things are <em>truly</em> serverless. As in, I don't want to think about future resource needs, I just want things to magically handle it. The good news is I think we're actually getting closer to this dream every year!</p>
<p>The beauty of this is that a lot of the configuration stuff goes away magically. The competitive advantage of most startups is to deliver business value through business logic, not capacity planning and capacity management!</p>
<p>Not just that, but multi-tenancy is actually truly a “free lunch” from a resource utilization point of view, so any opportunity to pool resources represents a true win-win bargain. At the scale data centers worldwide, it's big — it depends on who you are, but you could either get excited about the gigatons of CO<sub>2</sub> saved, or the increased corporate net income margin (I guess I like both!)</p>
<h1 id="fast">Fast</h1>
<p>I don't mean fast as in, serving requests fast. We have software that does a great job doing this! Honestly, I think it's mind blowing how good it is: you can run functions at the edge and get response times around the world on the order of milliseconds.</p>
<p>The speed that's not there is setting up infrastructure. If I make a change in the AWS console, or if I add a new pod to Kubernetes, or whatever, I want that to happen in seconds. I'm not asking for milliseconds! Just <em>please</em> at least get it to less than a second. If we can serve requests in milliseconds then I have no doubt that we can get it there. We have the tech to boot VMs and containers basically instantaneously.</p>
<p>The speed matters because this is a serious waste of time for engineers. I feel like I've wasted years staring at some infrastructure change to kick in. I'll get back to this topic in a second because I think it's an important one!</p>
<h1 id="ephemeral-resources">Ephemeral resources</h1>
<p>Almost all infrastructure I've worked with treats resources as something meant to exist indefinitely. If I create a database in the cloud, it sticks around, and unless I do anything, it will clutter up the console forever and I will pay money for it forever.</p>
<p>I used to think this was fine! My justification was that, well, if you want to run a test suite, just run the database yourself locally, maybe in a container. This is fine for some stuff, but I've come to think that it's probably pretty bad:</p>
<ul>
<li>It's a <em>lot</em> of work to build your own replica of the infrastructure so you can run it locally.</li>
<li>The development-production delta gets bigger. There's always going to be subtle differences in how cloud infra works vs when you run it locally.</li>
<li>A lot of cloud infra is proprietary and impossible to run locally!</li>
</ul>
<p>My deep desire is to make it easy to create ephemeral resources. Do you need a database for your test suite? Create it <em>in the cloud</em> in a way so that it gets garbage collected once your test suite is done. Run your tests against the cloud infra!</p>
<p>My dumb take is I feel like the debate in the last 5 years roughly looks like this:</p>
<p><img src="https://erikbern.com/assets/test_in_production.png" alt="test in prodouction"></p>
<p>(To be 100% clear, what I'm advocating for <em>in this blog post</em> isn't necessarily pushing out changes in front of users immediately, although I generally support that for <em>other</em> reasons not covered in this blog post: go read <a href="https://charity.wtf">everything written by Charity Majors</a>. I'm saying — let me use production-like infrastructure as much as possible throughout the process of building and testing code.)</p>
<p>The point about ephemeral resources gets 100x more powerful in conjunction with the previous point about letting me create resources quickly. The general pattern of how code gets built is that infrastructure has been decoupled from logic, and the logic is tested independently. Slightly simplified, you can think of the development process of a set of nested loops where the cycle time of each loop gets exponentially worse at each level:</p>
<p><img src="https://erikbern.com/assets/programming_loops.png" alt="programming loops"></p>
<p>At each loop level, the stakes get higher and the feedback cycle gets slower. This has an extremely strong relationship to productivity! The key thing to note is how important it is to <strong>shift concerns from outer loops into inner loops.</strong> Getting iteration speeds down by an order of magnitude has dramatic impacts on getting things done.</p>
<p>Having fast ephemeral cloud infra resources would let us move a lot of the infrastructure concerns from the outermost loop to the innermost loop. This lets you get feedback in seconds or at least minutes, rather than hours or more.</p>
<h1 id="code-not-configuration">Code not configuration</h1>
<p>There are at least 4 ways I can think of that you can interact with infrastructure:</p>
<ol>
<li>Web interface</li>
<li>Local configuration, then run some command-line client that talks to the system</li>
<li>APIs and you have to build the client yourself</li>
<li>Client libraries</li>
</ol>
<p>The first one is great to have but generally only for getting started. Once you have something set up, you typically move away from it as a way to make changes, and maybe only use it for monitoring etc.</p>
<p>Local configuration seems to be the general next step. Which is fine for a while, but half the time you realize that</p>
<ul>
<li>Actually, I want this framework to be controlled by another framework at a higher level. In this case, you have two (both bad) options: expose configuration for both frameworks, or have the outermost framework generate configuration dynamically for the other framework.</li>
<li>You need to generate resources dynamically, maybe in a for-loop or whatever.</li>
</ul>
<p>Now suddenly you move from YAML to YAML generated using Jinja or Handlebars or whatever. Slowly, you start adding custom functions to those template languages to make it easier to generate configuration. Eventually, it evolves into its own super-custom DSL with its own documentation.</p>
<p>This is super annoying! 10 times out of 10, I prefer to have everything accessible through a nice little client library. This library might in turn be a simple wrapper around a solid API. Now I can write my own for-loops! I can generate things dynamically! I don't have to learn a custom DSL! The world is a happy place again.</p>
<h1 id="built-for-productivity">Built for productivity</h1>
<p>I wanted to wrap this up under sort of a meta-point which isn't really a point in itself but more of a mindset change and maybe a corollary of all the other points.</p>
<p>Infrastructure <em>feels like</em> it's been built to solve hard scalability and reliability problems. There's some amazing infra and I'm in awe how much hard thinking must have gone into it. But things are rarely built to <em>optimize for developer productivity</em>. I think long term, the tools that “win” are generally the tools that optimize directly for that. Actually it's not just productivity, it's also quality, and these tools push the quality-productivity tradeoff “up and to the right”:</p>
<p><img src="https://erikbern.com/assets/programming_tradeoff_curve.png" alt="programming tradeoff curve"></p>
<p>My point is, the new tradeoff curve lets you “cash out” the improvements in different ways: maybe purely as higher quality, maybe purely as higher productivity, maybe a bit of both.</p>
<p>To me, this represents a <em>massive</em> opportunity gap over the next 5-10 years. I can't wait for <a href="/2020/12/16/giving-more-tools-to-software-engineers-the-reorganization-of-the-factory.html">engineers to unleash another order of magnitude of productivity</a>. There's so much software waiting to get built!</p>
<p><img src="https://erikbern.com/assets/paradise.png" alt="paradise"></p>
What's Erik up to?2021-04-01T00:00:00Zhttps://erikbern.com/2021/04/01/whats-erik-up-to.html<p>I joined <a href="https://better.com">Better</a> in early 2015 because I thought the team was crazy enough to actually change one of the largest industries in the US. For six years, I ran the tech team, hiring 300+ people, probably doing 2,000+ interviews, and according to GitHub I added 646,941 lines of code and removed 339,164. But I also got married, had two kids, bought an apartment and renovated it! From time to time, there was some <em>intense</em> periods of hard work.</p>
<p>Better has gotten to a pretty amazing place. It's one of the largest startups in NYC (by several metrics, like valuation or headcount) and it has a world class engineering team that makes me insanely proud. I think it will keep being super successful in the future as it deconstructs the housing market down to its core principles (people want somewhere to live!) and builds something that solves these things with a much better experience and less waste.</p>
<p>Anyway, after six years of Better, I'm moving on to do something new. I always had an itch to do my own thing, and I was originally planning to do that back in 2015 when I left Spotify. But Vishal (the CEO of Better) convinced me to spend a year or two with him, and learn how the sausage is made. How to raise money, how to work with the board, how to run a company, and all that stuff. I joined and I got stuck for a lot longer than I thought!</p>
<p>At some point, I decided that I need to do my own thing, or I'm never going to do it. Since Jan 1 this year, <a href="https://www.linkedin.com/in/dianeyu/">Diane Yu</a> is now running the tech team. We were super lucky to find her and I feel confident that she's going to take Better to the next level.</p>
<p>With Diane at Better, I took a 6 week semi-vacation in the Caribbean with my family, working 2-3 days a week and taking care of two crazy girls the rest of the time.</p>
<p><img src="https://erikbern.com/assets/daughters.jpeg" alt="kids"></p>
<p>Anyway, since a few weeks ago, I'm back in NYC ready for some serious crunch mode now.</p>
<h2 id="so-whats-next">So what's next?</h2>
<p>So what am I doing next? I'm extremely psyched to share with the world that I will be joining Oracle to work as a Senior Implementation Engineer, on Blockchain solutions for mid-size maritime companies!</p>
<p><img src="https://erikbern.com/assets/maritime_blockchain.png" alt="maritime blockchain"></p>
<p>The opportunities are unlimited. The Suez blockage shows how vulnerable we are, and I'm 1000% convinced it would have been prevented if they had used a decentralized P2P network powered by huge FPGA-rigs in Inner Mongolia computing quadrillions of hash values every second.</p>
<p>Sorry, just kidding… it's April Fools day, after all. But I <em>am</em> leaving Better, for real.</p>
<p>So what am I focused on next? I'm extremely determined that I want to start my own thing (meaning, don't try to hire me, it's probably a waste of time), and it's highly likely it will be something in the data engineering/science tools/infra space.</p>
<h2 id="why-data">Why data?</h2>
<p>I've spent most of my career working in data in some shape or form. At Spotify, I was entirely focused on it. At Better, I was a CTO with responsibility for all of technology, but for a long time I was also the manager of the data team, and I always kept dabbling with data problems in my spare time.</p>
<p>Data as a subfield of software engineering has a crazy growth rate. 10 years ago, companies didn't have big data teams. But these days, a lot of startups have 20%+ of their tech team dedicated to data (engineering/science). At the same time, I look at backend/frontend engineers and see how many amazing tools they have gotten in the last 10 years. Not just tools, but also processes. I truly think they are an order of magnitude more productive than they used to be.</p>
<p>I don't see this productivity revolution for data teams! I see teams wasting lots of time with nonsense tasks, like writing YAML or waiting for jobs to finish. But I also see other teams going around data teams and building up their own “analyst” teams. To me this reflects on the extreme demand for people who are <em>actually</em> skilled in working with data. How can we make them more productive? And I think a lot of it boils down to <a href="/2020/12/16/giving-more-tools-to-software-engineers-the-reorganization-of-the-factory.html">giving them better tools</a>.</p>
<p>I'm interested in about 100 subproblems in this field and I'm hacking on prototypes for several of these things, but just to pick a few:</p>
<ul>
<li>Workflow scheduling. I built Luigi a long time ago, which I think was kind of the first widely used one. Later, Airflow has become the de-facto standard. But I still don't think it's anywhere close to where it could be in terms of turbocharging data teams.</li>
<li>All the work <em>around</em> workflow scheduling. Lineage, documentation, observability, et cetera. I think there's an opportunity to solve a lot of those problems at the same time.</li>
<li>The chasm between SQL and Python. What to use for what, and how to increase the interoperability.</li>
<li>How to run data jobs. I don't think Kubernetes is the answer. It's hard to work with, not great for ad-hoc jobs, and fundamentally in the age of cloud, why can't we have a much more elastic pool of resources available?</li>
<li>Visualization. I kind of want something that's both matplotlib and WYSIWYG at the same time?</li>
</ul>
<p>I could keep adding to this list for hours, these are just some things off the top of my mind.</p>
<p>Anyway, feel free to drop me a line if you're interested in anything related to this. For the next few months, I'm going to be knee deep in code hacking on prototypes, so I love any break where I can talk to people who care about these things! I don't want to put my email here, but I'm sure you can figure out how to reach me.</p>
<h1>🍻</h1>
Giving more tools to software engineers: the reorganization of the factory2020-12-16T00:00:00Zhttps://erikbern.com/2020/12/16/giving-more-tools-to-software-engineers-the-reorganization-of-the-factory.html<p><img src="https://erikbern.com/assets/power-loom.jpeg" alt="power loom"></p>
<p>It's a popular attitude among developers to rant about our tools and how broken things are. Maybe I'm an optimistic person, because my viewpoint is the complete opposite! I had my first job as a software engineer in 1999, and in the last two decades I've seen software engineering changing in ways that have made us orders of magnitude more productive. Just some examples from things I've worked on or close to:</p>
<ul>
<li>Spotify built a whole P2P architecture in C++ in order to distribute streaming music to listeners, something which today is a trivial problem (put the data on a CDN).</li>
<li>I used to write custom mapreduce jobs to pull basic stats, then wait for hours for those jobs to finish. Today these would be SQL queries in a datawarehouse that would run in a few seconds.</li>
<li>I once ran a web shop and spent a week implementing credit card payments. Today it's 15 minutes using Stripe.</li>
</ul>
<p>Not to mention the changes in developer <em>processes</em>:</p>
<ul>
<li>Unit tests were really rare in the industry — I first encountered it working at Google in 2006.</li>
<li>When git was new, git-flow was the prevalent workflow, and many developers I worked with spent an inordinate fraction of their time (like, 20-30%) just <em>rebasing</em>.</li>
<li>CI systems were fragile, CD basically didn't exist, and deployments were scary manual affairs.</li>
</ul>
<p>These are just examples — I could go on all day. Much like the classic <a href="https://en.wikipedia.org/wiki/No_Silver_Bullet">No Silver Bullet</a> paper on software productivity, none of these things in themselves were a dramatic improvement. But productivity improvements add up, and <em>they add up on a logarithmic scale,</em> meaning it's not unreasonable that we see orders of magnitude of improvements when your time scale is decades.</p>
<p><small>(Note: I'm going to use the term “tool” throughout this post to refer to all kinds of things: frameworks, libraries, development processes, infrastructure.)</small></p>
<h2 id="the-insatiable-demand-for-software">The insatiable demand for software</h2>
<p>An extremely crude classification of the world is that</p>
<ul>
<li>There are some things that has great software</li>
<li>There are some things that has mediocre software</li>
<li>There are some things that has no software</li>
</ul>
<p>This is pretty obvious so far, so I'll keep going: <em>if there was an ability to produce infinite amounts of software instantaneously at zero cost, the two last buckets would go away</em>. Mediocre software exists because someone wasn't able to hire better engineers, or they didn't have time, or whatever. Things without software… it's kind of everything? I mean, why don't your shoes have a step tracker built in? Why does Mark in Accounting still generate PDF invoices and email them to clients? Why doesn't… I could keep going.</p>
<p>We've obviously been going in this direction for a long time, and my point is that there's <em>so much left that can use software.</em> Why hasn't it happened already? Because someone made the economic decision that <a href="/2020/03/10/never-attribute-to-stupidity-that-which-is-adequately-explained-by-opportunity-cost.html">the cost of building that software was too high</a>. It costs money and time to hire engineers and train them and getting things done. So how do we think about that cost?</p>
<h2 id="supply-demand-of-software-engineers">Supply-demand of software engineers</h2>
<p>Let's go back to my points about software engineer productivity going up over time. In economic terms, it means that the value of the output per time goes up. On the demand side, it means that the cost of building software goes down. What previously used to take 1,000 hours now takes 100 hours.</p>
<p>If demand was fixed, it would mean mass unemployment and lower salaries for engineers, but demand isn't fixed! As I've implied earlier, lower costs of building software means new opportunities open up. It previously wasn't worth paying for 1,000 hours of engineering effort to build your gizmo, but it might very well be worth 100 hours. There's enormous <em>latent demand</em>. You can even afford to pay engineers a bit more <em>per hour</em>.</p>
<p>These things can all happen at the same time:</p>
<ul>
<li>More software gets built</li>
<li>Software engineer salaries go <em>up</em></li>
<li>The number of software engineers grows</li>
</ul>
<p>This might be counterintuitive, so it's worth contrasting this with something where demand <em>is</em> fixed. Let's say some process is invented that increases the output of diaper factories by 10% (keeping all costs the same) and that invention is immediately available to all diaper manufacturers. What's the result? There will be a temporary surplus of diapers on the market, and the market will converge to a new equilibrium where the supply shrinks to meet demand. In the process, some factories will close, and prices of diapers will go down.</p>
<p>The difference with software engineers is that <em>demand grows when the cost goes down.</em> Your aunt's dental practice didn't use to have a website, but now it's worth having a whole online booking system. The school your kids go to suddently has an app to send updates to parents. I don't know — my point is, with price going down, more demand opens up.</p>
<p>It's not just across the whole economy that this happens, it can also happen at a micro scale. If you have a team of data scientists and you introduce a tool that makes then 2x more productive? Great — you just doubled the ROI of each incremental hire, and you should go and hire <em>more</em> people. I've never seen a company where data scientists run out of work: there's always more things to analyze.</p>
<p>Will this go on forever? I guess in some end state, we'll hit someting that looks like the singularity, where software itself builds software so fast that demand can't grow with supply. That's at the point where I'd be worried about software engineer unemployment. But for the next few decades, I think it's a pretty decent bet that we'll see the number of software engineers growing and growing.</p>
<h2 id="how-to-become-a-software-engineer">How to become a software engineer</h2>
<p>The growth of software as a field and the growth of salaries obviously in itself attracts more people to the field, but I think there's also another thing that's happening.</p>
<p>Decades ago, software engineering was hard because you had to build everything from scratch and solve all these foundational problems. You need storage to build something to serve 1M concurrent users? Wade through papers about consistent hashing, CAP theorem, CRDTs and what not, roll up your sleeves, and prepare yourself for 100,000 lines of hard core C++.</p>
<p>Today, these problems are “mostly” solved, and you can use off-the-shelf tools for most of it. It's not <em>easy</em> though! Like I mentioned earlier, there is no silver bullet, and there's a million tools out there, and you need to know based on best practices how to stitch it all together. But knowing this is a <em>different type of hard.</em></p>
<p>Software engineering a few decades ago favored the people that were deep abstract thinkers — who could stitch together complicated software from atoms. To me it looks a lot more like a <em>craft</em> today — it's a lot more about learning what tool should be used for what job. I mean, it still very much favors deep abstract thinkers, but <em>relatively</em> speaking, that skill is a smaller differentiating factor than it used to be.</p>
<p>I think this changes the equation on the supply side. The barriers to become a software engineers are <em>different</em> today, and it's opened up a larger pool of talent. This unlocks new supply, which means even more software is created.</p>
<h2 id="the-software-engineer-role-in-the-knowledge-factory">The software engineer role in the knowledge factory</h2>
<p>Building software used to be, and still is, a very expensive endeavor for companies. At the average company, you still have a backlog that's seemingly endless. The software side of the factory is still often a bottleneck of the company.</p>
<p>What do you do when you have a widget maker that's a bottleneck in a manufacturing plant? You make sure that the bottleneck runs at <em>full utilization</em> at any time. This means you centralize the resource management of the widget maker — you put controls on the inputs, and put a lot of effort into making sure what widget gets made in what order.</p>
<p>Most companies still very much operates roughly like that. But, the companies that (in my opinion) have exceptionally productive engineering teams are organizing themselves in slightly different ways. They tend to decentralize prioritization, and work directly with product and business stakeholders in tight iterations. When a resource isn't the bottleneck any more, you can achieve vastly higher iteration speeds by spreading out resource allocations to many different teams. I don't mean decentralizing in terms of management to be clear. What I mean is decentralizing the <em>backlogs</em> into small teams that work directly on business needs.</p>
<p>In this model, you don't have a marketing team put something on the backlog of the engineering team. You have a team of cross functional people who own acquisition, where some people are traditional marketers and some people are engineers. You can imagine this with almost any function throughout a typical company: customer support, finance, or anything else.</p>
<p>A historical parallel that I find super fascinating is <a href="https://www.bbc.com/news/business-40673694">why electricity took so long to change manufacturing</a>. Factories in the age of steam engines were built around power distribution from the almighty steam engines. Energy was the precious resource, so it's natural to think about manufacturing plants as built around energy distribution. Electricity changed this, and decentralized energy generation, but it took a really long time for manufacturing plants to realign and take advantage of this.</p>
<p><small>(Note 1: This isn't a perfect analogy since steam power wasn't just the precious resource, it was also hard to build small steam engines.)</small></p>
<p><small>(Note 2: The <em>main</em> point of the article I linked to is that innovations often take time to unleash productivity, because the first attempts to use the new technology often tries to retrofit it into legacy structures. For instance: internet first created DVD-by-mail, but the real <em>internet-native</em> innovation was streaming video.)</small></p>
<h2 id="bottlenecks-in-the-knowledge-factory">Bottlenecks in the knowledge factory</h2>
<p>I've been talking a lot about tools that make engineers more productive, but that's not the entire story here. There are clearly also lots of tools used by non-tech people to get their own things done, and that's great! But I also see a huge amount of tools built so that <em>people don't have to work with engineers.</em> Why? A few reasons:</p>
<ol>
<li>Iteration speed: The cost of explaining to an engineer what you need makes it not worth doing it</li>
<li>The engineering resources are not available (or too expensive, or whatever)</li>
<li>You just need a fraction of an engineer but that market does not exist</li>
<li>There's some special domain knowledge needed to build something</li>
<li>Engineers are weird and smell funny</li>
</ol>
<p>Ok, the last point was just a dumb joke. I think the other points cover most of it though.</p>
<p>Out of these, I think the first one (iteration speed) is a 100% valid reason. As an example, I encourage all business people to learn SQL so they can run queries themselves.</p>
<p>What I think is unfortunate is the second one (no engineering resources available). A lot of us have probably encountered manual pipelines of people sending around Excel files with macros, copy pasting data new into the spreadsheet every morning, or something similar. This is sometimes referred to as <a href="https://en.wikipedia.org/wiki/Shadow_IT">“shadow tech”</a>. Had there been dedicated engineering resources, the total cost of building and owning those things would probably be much lower.</p>
<p>But the fact that non-engineers are building technology validates that there's demand for engineers. At many companies, engineers just can't keep up with the demand. So, through better tools, over time, more needs can be served. Companies at the forefront of engineer productivity will probably see less of these issues: engineers will be involved early on and work on business problems.</p>
<p>The third point (fractional resources) is probably true at small companies. If you're a dentist, you're not going to hire an engineer to build you a booking system. Luckily, they benefit from the increased output industry-wide: there might be a whole new ecosystem of dentist software to buy (because building it gets much cheaper).</p>
<p>The last point (special knowledge) has some validity. I often see business people building manual workflows that later get taken over and automated by engineers, as a sort of a first line attack squad to get a basic prototype running. The counterpoint is that with increased decentralization, engineers will increasingly develop subject-matter experience. A lot of companies have dedicated data science and data engineering resources to the HR and Finance teams, as an example.</p>
<h2 id="the-great-productivity-inequality">The great productivity inequality</h2>
<p>An interesting corollary of all of this is that it creates a positive feedback where some companies will fall behind even further:</p>
<ul>
<li>Lack of adoption of new tools means falling behind the companies leveraging those tools.</li>
<li>Higher salaries for software engineers means these companies are priced out of the higher end of the hiring market.</li>
<li>A failure to realign the factory means lower iteration speed.</li>
<li>A lack of engineers means a temptation to adopt tools to build technology without using engineers, with associated costs that are much larger.</li>
</ul>
<p>In contract, the companies at the forefront of this will see their software engineer productivity surge and the iteration speeds improve.</p>
<p>I have spent six years in the mortgage industry and I have seen these trends play out very clearly in front of me. The biggest laggards are desperately adopting <a href="https://en.wikipedia.org/wiki/Robotic_process_automation">RPA</a> and duct taping together off-the-shelf <a href="https://en.wikipedia.org/wiki/Point_of_sale">POS</a> and <a href="https://en.wikipedia.org/wiki/Customer_relationship_management">CRM</a> software. The slightly better companies have their own engineering teams, but seem to fail to realign the process factory to be a tech-driven company. My company <a href="http://better.com/">Better</a> is implicitly a bet on everything I mentioned in this post, plus maybe a bunch of other trends as well.</p>
<h2 id="wrapping-it-up">Wrapping it up</h2>
<p>This was a lot of words for something that I think could be put succinctly into a causal graph:</p>
<p><img src="https://erikbern.com/assets/software-engineer-productivity.png" alt="software engineer productivity"></p>
<p>This is clearly not an <em>exhaustive</em> theory of everything that happens with software. There are many other trends, like internet erasing physical moats, and software creating more economies of scale. But this explains a lot of it, I think.</p>
<p>A theory is useless without an ability to generate forecasts or policy recommendations, so here are some things I would bet on:</p>
<ul>
<li>It's a good time to be a software engineer</li>
<li>The market for tools to software engineer will keep growing</li>
<li>Many “legacy” companies will fall behind the productivity gains</li>
<li>New entrants will threaten these companies and succeed to a large extent</li>
<li>Every company should think about how to realign how they build technology to focus on decentralization and higher iteration speed, embedding engineers throughout the factory</li>
<li>In the long run, it won't be a good idea for companies to adopt tools with the only purpose of building technology without engineers</li>
<li>Software engineers should wholeheartedly adopt tools that make them more productive: it makes them more valuable</li>
<li>Companies with high productivity engineering teams will have faster-growing engineering team (because of higher ROI of hiring more engineers)</li>
</ul>
<p>This blog post is a confluence of a number of previously unrelated thoughts in my head. Some of it might be super obvious to readers, some of it not. Hopefully there was something in the latter category you found useful!</p>
Developer experience as a competitive advantage2020-10-06T00:00:00Zhttps://erikbern.com/2020/10/06/developer-experience-as-a-competitive-advantage.html<p>I spent a ton of time looking at different software providers, both as a CTO, and as a <del>nerd</del> “advanced” consumer who builds stuff in my spare time. In the last 10 years, there has been an order of magnitude more products that cater directly to developers, through APIs, SDKs, and tooling. I'm pretty psyched about this trend. As the cost of building software goes down, that drives up the demand for software engineers. That then drives up the demand for even more products built <em>for software engineers</em>. That then drives down the cost of building software even more!</p>
<p>This flywheel seems like an excellent thing for our economy. You don't need to look to far to find a startup built on top of AWS that probably wouldn't have existed 10 years ago because it was too hard/expensive.</p>
<p>Back in the days, a lot less existed, and it was hard to buy software. If you bought it, it was shinkwrapped on-prem software that came with expensive supporting contracts. Maybe you had to go through your company's procurement team and they would come up with a checklist, go to Gartner and look at vendor and all that stuff. Maybe I exaggerate, I don't know — I've suppressed those memories.</p>
<p>These days, some developer in your team often discovers a solution they are struggling with, goes and signs up for a trial, and demonstrates a working prototype of an integration to their team in half an afternoon. This “consumerization” of developer services explains a lot of what's changing. When everything previously went through a procurement team, developers now buy things themselves. This changes the sales process from one typically driven by a commissioned sales force, to one primarily driven by self-service (but often still supported by a sales team for larger contracts).</p>
<h2 id="crappy-tech-vendors">Crappy tech vendors</h2>
<p>Consider a typical API product. Stuff you might have to do to get a prototype integration working:</p>
<ul>
<li>Schedule a meeting with a sales person</li>
<li>Wait x days to get API tokens</li>
<li>Get a PDF with integration docs</li>
<li>Deploy a service inside your production environment</li>
<li>Deal with firewalls, routing, DNS config, and certificates</li>
<li>Configure your authentication provider to work with it</li>
<li>Browse through confusing (often auto-generated) API docs that doesn't seem to be written for humans</li>
<li>Webhooks?</li>
<li>PGP Keys?</li>
<li>Environment variables?</li>
<li>…</li>
</ul>
<p><img src="https://erikbern.com/assets/tech-vendor.png" alt="tech vendor">
<em>This is my terrible mental image of every crappy tech vendor's website. I've spent six years in the mortgage industry, I've seen it all. Just give me an API token and docs!</em></p>
<p>It often feels ike the developer experience is pretty much an afterthought, and I <a href="https://twitter.com/bernhardsson/status/1277673939435651074">keep making fun of it</a>. I imagine it's not just me but probably <em>millions</em> of developers spending an inordinate amount wading through confusing API docs. And this stuff is like, seriously hard! Mess it up and you might <a href="https://www.zdnet.com/article/capital-one-fined-80-million-for-2019-hack/">get slapped with a $80M fine</a> for <a href="https://krebsonsecurity.com/2019/08/what-we-can-learn-from-the-capital-one-hack/">misconfiguring IAM policies</a>. The cost of poor developer experience is real.</p>
<h2 id="growth-hacking-the-developer">Growth hacking the developer</h2>
<p>If you have spent any time in the last 10 years at any moderately successful consumer-facing startup, you have probably been exposed to their growth team. Growth teams iterate the living daylight out of the landing pages, onboarding funnel, account registration flow, remarketing campaigns, cart abandonment emails, and 1,000 other things that drives conversion rates.</p>
<p>Say what you want about it, but the end result is that it's about 100x easier to open a bank account online at an online bank than it used to be, or buy bread, or send flowers to your parents, or whatever you want to do online. The other day, I took my toddlers to the playground and was running around chasing them while ordering gardening equipment on my phone.</p>
<p>Acquisition for a developer-focused business is just like any other online service these days. All the tricks in the playbook apply: SEO, retargeting, content marketing, and much more. It doesn't matter if the end goal of the conversion funnel is buying flowers or <em>hitting the sandbox API with a request</em>. The principles are the same.</p>
<h2 id="the-stack-overflow-momentum-effect">The Stack Overflow momentum effect</h2>
<p>Writing code is like 30%+ googling error messages and finding posts by other people who already solved the same issue. This suggests that there is a strong virtuous cycle getting momentum online. More users of a software generates more Stack Overflow posts (and Github stars, blog posts, and what not), which then increases the developer experience, which then wins more developers. These dynamics are set up to create winner-takes-all markets.</p>
<p>As it says in the bible, the <a href="https://en.wikipedia.org/wiki/Matthew_effect">rich get richer and the poor get poorer</a>. If I was an investor in SaaS products (I am not!), I would ask for the number of Stack Overflow posts as the leading indicator of success. I'm like 75% serious.</p>
<p>You see this a lot in a different form. Companies have developer evangelists, community managers, or whatever they call it. They sponsor hackathons and run meetup groups, and you keep bumping into their colorful t-shirts at conferences.</p>
<h2 id="self-service-and-freemium">Self-service and freemium</h2>
<p>To increase the conversion rate, free tiers are often available. For instance, AWS has a free EC2 tier that you can sign up for, that lets you run basic things in the cloud. Running a free tier as a loss-leader is a bet that enough of those users will convert in the future.</p>
<p>But done right, it's actually more than that. Free users can trigger some sort of viral growth. They might generate questions and answers on Stack Overflow. They might write stuff on their blogs. They might tell their friends and coworkers — developers are actually far more social than we like to admit!</p>
<h2 id="open-source-as-a-freemium-model">Open source as a freemium model</h2>
<p><em>Open source</em> often ends up being the best example of a freemium tier (or I guess, alternatively, an acquisition channel). Feel free to run MongoDB or Kafka on your laptop, and build stuff on top of it. Once you get hooked on it, these companies offer super powerful cloud-hosted solution that they make a ton of money on. Confluent (Kafka creator) is a $4.5B business — incredible! 👏</p>
<p>Although I think there's a great window of opportunity to turn open source software into business opportunities <em>right now</em>, I do <a href="https://twitter.com/bernhardsson/status/1311482732850155522">have some reservations</a> about it in the long run. This might have to be another blog post one day.</p>
<h2 id="developer-experience-as-a-competitive-advantage">Developer experience as a competitive advantage</h2>
<p>Wrapping it up, what do I think is going to happen? I don't know, but here's where I would put my money:</p>
<ul>
<li>There's going to be a group of companies who understand these trend and go all in on it. I already mentioned Stripe, Twilio, and Netlify as three great examples.</li>
<li>There's going to be a bunch of dinosaurs that die out. Any direct Stripe competitor that <em>requires</em> you to talk to sales person, or has a super confusing SOAP API, or whatever.</li>
<li>Some companies will struggle to reorient themselves, and it could go either way. AWS feels like the million ton gorilla here. Some of their services are fantastic, but many are of highly questionable quality. Will they be able to bring that spark of joy to developers or will they get unbundled and outcompeted? Time will tell.</li>
<li>The market for products for software developers will grow by another 10x, easily</li>
<li>The <em>quality</em> of those products will be vastly better. It will be <em>easy</em> to get started, and <em>fun</em> to use them.</li>
<li>What's going to be for sale out there? I think the opportunities are endless, but here are some general categories of things:
<ul>
<li>Pretty much everything that isn't core business logic should rationally be pulled out of your codebase and sold back to you at a fraction of the cost.</li>
<li>Probably anything you can do in the real world. Ship things. Pay people. Sue someone. Get an apartment cleaned.</li>
<li>Get data on anything. The atmospheric rate of methane in Bangladesh. The current water flow of Missisippi. All the parking tickets for a person.</li>
<li>Anything you have to set up and <em>run</em> on your own infrastructure (example: Kubernetes)</li>
<li>Much better closed-source versions of the tools in the previous category (example: Datadog).</li>
<li>Any special internal infrastructure/tools that so far only Google and the alikes have had.</li>
<li>The great AWS unbundling: any product that AWS has which is just OK but not great.</li>
<li>Productivity tools for developers. Tools that let you remove time wasted not solving problems.</li>
</ul>
</li>
</ul>
<p>If there's any persistent lesson we've learned about the future, it's that it's a lot harder to predict than we think. But I think it's a pretty safe bet that software engineers will have some amazing tools in 2030 that makes today's tool feel antiquated. Looking forward to it!</p>
Mortality statistics and Sweden's "dry tinder" effect2020-09-23T00:00:00Zhttps://erikbern.com/2020/09/23/mortality-statistics-and-swedens-dry-tinder-effect.html<p>We live in a year of about 350,000 amateur epidemiologists and I have no desire to join that “club”. But I read <a href="https://www.aier.org/article/swedens-high-covid-death-rates-among-the-nordics-dry-tinder-and-other-important-factors/">something about COVID-19 deaths</a> that I thought was interesting and wanted to see if I could replicated it through data. Basically the claim is that Sweden had an exceptionally “good” year in 2019 in terms of influenza deaths causing there to be more deaths “overdue” in 2020.</p>
<p>This post is not an attempt to draw any scientific conclusions! I just wanted to see if I could get my hands on any data and visualize it. I'm going to share some plots and leave it to the reader to draw their own conclusions, or run their own experiments, or whatever they want to do!</p>
<p>As it turns out, the <a href="https://www.mortality.org/">Human Mortality Database</a> has some really awesome statistics about “short-term mortality fluctuations” so let's see what we can do with it!</p>
<p><em>*Rolls up sleeves.*</em></p>
<p>Let's first look at the most basic time series plot. We'll start with the Nordics:</p>
<p><img src="https://erikbern.com/assets/mortality-stats/nordics.svg" alt="nordics"></p>
<p>There's a lot of seasonality! And a lot of noise! Let's make it a bit easier to follow trends by looking at rolling 1 year averages:</p>
<p><img src="https://erikbern.com/assets/mortality-stats/nordics-1y-rolling-avg.svg" alt="nordics 1y rolling avg"></p>
<p>Phew, that's a bit easier on my poor eyes. As you can see, it's not an unreasonable claim that Sweden had a “good year” in 2019 — overall death rates dropped from 24 to 23 deaths/day per 1M. That's a pretty huge drop! Until looking at this chart, I had never anticipated death rates to be so volatile from year to year. I also would have never anticipated that death rates are so seasonal:</p>
<p><img src="https://erikbern.com/assets/mortality-stats/nordics-seasonality.svg" alt="nordics seasonality"></p>
<p>Unfortunately the dataset doesn't break out causes of death, so we don't know what's driving this. Amazingly, from a cursory online search, there seems to be <a href="https://www.demogr.mpg.de/books/drm/003/2.pdf">no research consensus</a> why it's so seasonal. It's easy to picture something about people dying in cold climates, but interestingly the seasonality isn't much different between say Sweden and Greece:</p>
<p><img src="https://erikbern.com/assets/mortality-stats/sweden-greece-seasonality.svg" alt="nordics seasonality"></p>
<p>What's also interesting is that the beginning of the year contains most of the variation in what counts as a “bad” or a “good” year. You can see that by looking at year-to-year correlations in death rates broken down by quarter. The correlation is much lower for quarter 1 than for other quarters:</p>
<p><img src="https://erikbern.com/assets/mortality-stats/scatterplot.svg" alt="scatterplot"></p>
<p>(I only used data up until 2018-2019 from this scatterplot since COVID-19 causes a weird cluster of points)</p>
<p>I'm still super confused. My only two guesses for why there's so much seasonality and year-to-year variation would be:</p>
<ol>
<li>Some winters are really mild, some are really bad</li>
<li>Influenza season hits different in different years</li>
</ol>
<p>But not a ton of people die of influenza, so it doesn't seem likely. What about cold weather? I guess plausibly it could lead to all kinds of things (people stay inside, so they don't exercise? Etc). But I don't know why it would affect Greece as much as Sweden. No idea what's going on.</p>
<h2 id="mean-reversion-two-year-periodicity-or-dry-tinder">Mean reversion, two-year periodicity, or dry tinder?</h2>
<p>I was staring at the rolling 1 year death statistics for a really long time and convinced myself that there's some sort of negative correlation year-to-year: a good year is followed by a bad year, is followed by a good year, etc. This hypothesis sort of makes sense: if influenzas or bad weather (or anything else) provides the “final straw” then maybe a “good year” just postpones all those deaths to the next year. So if there truly was this “dry tinder” effect, then we would expect a <em>negative correlation</em> between the change in death rates of two subsequent years.</p>
<p>Let's look again at the Nordics:</p>
<p><img src="https://erikbern.com/assets/mortality-stats/nordics-1y-rolling-avg.svg" alt="nordics 1y rolling avg"></p>
<p>Let's look at Germany/Switzerland/Austria, for which the mortality stats barely budged:</p>
<p><img src="https://erikbern.com/assets/mortality-stats/german-speaking-1y-rolling-avg.svg" alt="german speaking countries 1y rolling avg"></p>
<p>UK, Belgium, and Netherlands, which have much bigger increases in mortality:</p>
<p><img src="https://erikbern.com/assets/mortality-stats/northwestern-europe-1y-rolling-avg.svg" alt="northwestern europe 1y rolling avg"></p>
<p>I mean, looking at the chart above, it clearly <em>feels</em> like there's some sort of 2 year periodicity with negative correlations year-to-year. Italy, Spain, and France:</p>
<p><img src="https://erikbern.com/assets/mortality-stats/southern-europe-1y-rolling-avg.svg" alt="southern europe 1y rolling avg"></p>
<p>So is there evidence for this? I don't know. As it turns out, there <em>is</em> a negative correlation if you look at changes in death rates: a positive change in a death rate from year T to T+1 is negatively correlated with the change in death rate between T+1 and T+2. But if you think about it for a bit, this actually doesn't prove anything! A completely random series <a href="https://gist.github.com/erikbern/0509a6f22fd0927f07ef48908a700f43">would have a similar behavior</a> — it's just mean-reversion! If there's a year with a very high death rate, then by mean reversion, the next year should have a lower death rate, and vice versa, but this doesn't mean a <em>negative correlation</em>.</p>
<p>If I look at the change in death rate between year T and T+2 vs the change between year T and T+1, there's actually a positive correlation, which doesn't quite support the dry tinder hypothesis.</p>
<p><img src="https://erikbern.com/assets/mortality-stats/correlation.svg" alt="correlation"></p>
<p>I also fit a regression model: $$ x(t) = \alpha x(t-1) + \beta x(t-2) $$. The best fit turns out to be roughly $$ \alpha = \beta = 1/2 $$ which is entirely consistent with looking at random noise around a slow-moving trend: our best guess based on two earlier data points is then simply $$ x(t) = ( x(t-1) + x(t-2) )/2 $$.</p>
<p>If we had found that $$ \alpha < 0 $$ then that would have implied a “good” year would be negatively correlated with a subsequent bad year next year, and vice versa. This would be my most “strict” interpretation of the “dry tinder” hypothesis, and it's not what we're finding.</p>
<p>However, the solution we find has a bit of a two-year periodicity. You can turn the recurrence relation $$ x(t) = ( x(t-1) + x(t-2) )/2 $$ into the polynomial equation $$ x^2 = \frac{1}{2} x + \frac{1}{2} $$. If I'm not mistaken, this is called the “characteristic polynomial” and its roots tell us something about the dynamics of the system. The roots are -1/2 and 1, and the negative root implies a two-year damping oscillating behavior. So it least that shows <em>something</em> along the lines of what we're looking for. I think this implies that at two-year average might be a better way to smooth it, and at least qualitatively it looks that way:</p>
<p><img src="https://erikbern.com/assets/mortality-stats/nordics-1y-2y-rolling-avgs.svg" alt="nordics 1y+2y rolling avgs"></p>
<p>A fun thing is that we can actually use this method to forecast the curves forward (I added “last week” as a third term in the regression):</p>
<p><img src="https://erikbern.com/assets/mortality-stats/forecast.svg" alt="forecast"></p>
<p>My confidence in these predictions is roughly zero.</p>
<h2 id="appendix">Appendix</h2>
<p>This is not a proof of anything! This is obviously <em>extremely far</em> from the scientific standards required for publication. So why am I posting this? Mostly because</p>
<ol>
<li>I thought the Human Mortality Database was a really cool public dataset.</li>
<li>These mortality were sort of surprising, at least to me.</li>
<li>I haven't posted much on my blog and felt compelled to write something!</li>
</ol>
<p>On the last topic, I'll try to get back in a regular habit. Sorry!</p>
How to set compensation using commonsense principles2020-06-08T00:00:00Zhttps://erikbern.com/2020/06/08/how-to-set-compensation-using-commonsense-principles.html<p>Compensation has always been one of the most confusing parts of management to me. Getting it right is obviously <em>extremely</em> important. Compensation is what drives our entire economy, and you could look at the market for labor as one gigantic resource-allocating machine in the same way as people look at the stock market as a gigantic resource-allocating machine for investments.</p>
<p>Yet, almost everything I learned about compensation comes from practical experience, so what follows is a blog post I wish I could have read ten years ago! I wrote it from the perspective of a manager at a tech startup, but hope there's some parts that generalize.</p>
<h2 id="goodbad-compensation-systems">Good/bad compensation systems</h2>
<p>I'll start by stating what I think are goals and anti-goals:</p>
<ul>
<li>A good system doesn't waste money hiring new people when you can pay to keep existing people.</li>
<li>A bad system keeps people below the salary that you would give them to keep them.</li>
<li>A good system pre-empts people interviewing elsewhere.</li>
<li>A bad system gives raises mostly when people interview elsewhere and get offers.</li>
<li>A good system phases out underperformers or makes it clear they will never get a raise until they step it up.</li>
<li>A bad system give raises to people who are already paid more than you would pay to hire them today.</li>
<li>A good system pays people on an absolute scale, where salary history is not a factor.</li>
<li>A bad system thinks of salary increases in relative terms (eg top performers get +5%).</li>
<li>A good system doesn't pay more just because someone interviews with many companies.</li>
<li>A bad system determines offers to new hires mostly based on their other offers.</li>
<li>A good system pays only for the value someone is creating, not for irrelevant things.</li>
<li>A bad system pays based on years of experience or pedigree.</li>
<li>A good system gives the biggest raises to humble people who never asked for it, but deserve it.</li>
<li>A bad system gives raises to people when they ask for it, and gives more when people complain more.</li>
<li>A good system understands how to use equity to motivate people.</li>
<li>A bad system penalizes people for trading off salary for equity.</li>
<li>A good system incentivizes people to do whatever adds the most value to the company.</li>
<li>A bad system incentivizes people to go into management in order to get a raise.</li>
<li>A good system has a clear link between performance and salary that people understand.</li>
<li>A bad system makes people frustrated because they don't understand why some people make more than other.</li>
</ul>
<p>Phew, that was a lot! Most of is should be sort of self-evident, or at least it feels so to me. But I've seen a lot of companies mess it up! What are some <em>principles</em> we can use that prevent us from all of these traps? Hold my beer as I go through:</p>
<h2 id="principle-1-align-with-market">Principle 1: align with market</h2>
<p>Ignoring for a second that productivity is basically impossible to quantify, let's say we made a scatter plot of employees at the company <em>CrazyBananaCo</em>, where the x-axis is how much value they create and the y-axis is their cost.</p>
<p><img src="https://erikbern.com/assets/salary/figure-1.png" alt="figure 1"></p>
<p>Just to make it a bit simpler, let's say the chart only includes people who spent at least 1 year at the company, so that we can roughly ignore the “ramp time”. There's about 99 other simplifications here, some of which I addressed at the end of this post, but they key point here is this a <em>toy model</em> that still lets us say a lot about compensation management!</p>
<p>Two quantities are important benchmarks for someone's salary:</p>
<ul>
<li>Market rate: if this person started here today, what would we have to pay to get them?</li>
<li>Replacement cost: how much are we willing to pay in order to get this person to stay?</li>
</ul>
<p>The market range is not a perfect “price” so I picture it more like a <em>range</em>. The replacement cost will be a bit higher than the market rate because of the extra cost of hiring/training the person. It's rational that we would rather pay a bit more to get someone to <em>stay</em> versus hiring an identical person coming in from scratch.</p>
<p>With <em>productivity</em>, I also mean <em>value</em>, so the diagonal line represents the curve where the net benefit of an employee is exactly $0. In general, <em>market rate ≤ replacement cost ≤ value</em>.</p>
<p>Once we calibrate this against market/replacement, hopefully we'll end up with something like this:</p>
<p><img src="https://erikbern.com/assets/salary/figure-2.png" alt="figure 2"></p>
<p>If your compensations are aligned with market, then no one should be below market range (give them a raise before they quit), and no one should be above replacement cost (then they should be replaced). Ideally pretty few should be above market range but below replacement cost (the purple zone), although I consider that zone a bit of a special “insurance card” you can buy, like if someone on your team has some deep domain knowledge that's absolutely crucial <em>right now</em> so you don't have time to hire a replacement and train them.</p>
<p>But how do you know the market rate and the replacement cost? You really don't ever know it, but the best way to get a good pulse on it is through recruiting. A good offer acceptance rate is in the 70-80% range—too low, and you might be underpaying, too high, and you might be overpaying. If you make a lot of offers, you should develop a pretty good understanding of the market from making offers and learning about what other companies are offering. There are also datasets such as <a href="https://radford.aon.com/surveys">Radford</a>, which you have to pay for, and <a href="https://levels.fyi">levels.fyi</a>, which is a free database of self-reported salaries.</p>
<h2 id="principle-2-create-consistency">Principle 2: create consistency</h2>
<p>Let's consider the company <em>SuperFairCo</em>, which has a super nice consistent pay distribution.</p>
<p><img src="https://erikbern.com/assets/salary/figure-3.png" alt="figure 3"></p>
<p>Let's say SuperFairCo is considering hiring Meg—an engineer highly desired in the market. Other companies are offering a lot as well. But we still have an opportunity to hire her at a cost lower than their value. Should we do it?</p>
<p><img src="https://erikbern.com/assets/salary/figure-4.png" alt="figure 4"></p>
<p>Meg would generate surplus value, so from that perspective it might seem like a good trade. But there's a subtle catch. Consider these situations:</p>
<ol>
<li>Joe in the HR team is accidentally shares a spreadsheet with everyone's salaries. Mike notices someone with less experience than him is making more money.</li>
<li>Anna goes to her manager and asks for more money. She's currently making $150,000 and the company values her contributions as $200,000. She's asking for $190,000 or else she will quit.</li>
</ol>
<p>The last one is especially tricky. If you comply, you're still benefitting from having Anna on the team, but you just created a culture where people who complain to their manager get more money and people who don't complain get no raise. That seems like bad incentives!</p>
<p>The only solution to all of this, is to make sure salaries are <em>consistent</em>. A useful Litmus test is: <strong>if all salaries were made fully transparent, would people be upset?</strong> If so, you might have an inconsistency problem.</p>
<p>Our hypothetical offer to Meg comes with two big hidden costs:</p>
<ol>
<li>The heartburn of creating a very inconsistent pay scale (with all the bad feelings if people find out)</li>
<li>The hypothetical dollar costs of raising salaries for many other people if you ever want to get the pay scale back to consistency:</li>
</ol>
<p><img src="https://erikbern.com/assets/salary/figure-5.png" alt="figure 5"></p>
<p>On the other hand, a consistency-based model implies the salary range for Meg's offer is much tighter, and that the SuperFairCo is willing to lose her even at a salary that generates surplus value to the company. And this is why the company is probably better off declining Anna's request for a raise.</p>
<p><img src="https://erikbern.com/assets/salary/figure-6.png" alt="figure 6"></p>
<p>I kind of glossed over what “consistency” exactly means here, but just to clarify: <em>if person A is more productive than person B, then A should have a higher salary than B.</em> I think that's reasonable!</p>
<h2 id="corollaries-of-a-consistency-based-framework">Corollaries of a consistency-based framework</h2>
<p>I think the consistency aspect largely explains why companies have a tighter “cap” on salary than you would otherwise expect. They might not be willing to pay above market salary for someone, even though their salary is below replacement cost, and even though they generate a lot of surplus value.</p>
<p>The theory also implies that companies will be really risk-averse about offers. There's an asymmetry in the “total inconsistency”, where overpaying often creates a lot more inconsistencies than underpaying. Rationally a company may thus lowball such an offer.</p>
<h2 id="putting-it-to-practice-the-salary-calibration-process">Putting it to practice: the salary calibration process</h2>
<p>Let's discuss how to actually calibrate salaries. We'll consider another startup MegaHyperCo with a somewhat inconsistent salary distribution:</p>
<p><img src="https://erikbern.com/assets/salary/figure-7.png" alt="figure 7"></p>
<p>Let's first aim for consistency. One way to do it is to simply give the smallest raise to everyone in order to bring the total inconsistency to zero:</p>
<p><img src="https://erikbern.com/assets/salary/figure-8.png" alt="figure 8"></p>
<p>The method I used in the chart above isn't meant to be taken extremely literally. And note that this example started with a somewhat extreme distribution—ideally, you never deviate very far from consistency, and so the inconsistency-driven raises should be small. But hopefully you get the point of what I'm doing here!</p>
<p>A major benefit of the consistency-based calibration is that it doesn't require modeling out a person's <em>value</em>. All we need is to be able to rank people. It's almost impossible to argue that Abdul who's an associate engineer making $120,000 is exactly 69% as productive as Pierre the senior engineer making $175,000. But we can often <em>rank</em> Pierre vs Abdul.</p>
<p>We should also calibrate against market salary. Usually, markets don't move much, so the calibrations will be minor, but occasionally when markets move quickly, this could mean changing a larger set of salaries (say 50%+ of the team). You definitely shouldn't just give everyone a blanket x% raise! Instead, do it in a way that targets the underpaid employees:</p>
<p><img src="https://erikbern.com/assets/salary/figure-9.png" alt="figure 9"></p>
<p>Note that the two models (figure 8 and 9) recommend raises to roughly the same set of employees:</p>
<p><img src="https://erikbern.com/assets/salary/figure-10.png" alt="figure 10"></p>
<p>What do you do with people who are overpaid? I've never <em>lowered</em> anyone's salary, and if they are vastly overpaid (above their replacement cost) then they should probably be let go instead. But it occasionally happens that someone is <em>slightly</em> overpaid, but still generating surplus value. If you're not letting them go then you don't have much of a choice here: <em>keep</em> their salary the same for multiple years in a row, potentially indefinitely. If that person makes a fuss and ends up quitting, that's OK!</p>
<p>This system is greatly simplified by introducing <em>levels</em>. By bucketing everyone into say 5-10 buckets, with clearly defined expectations, you can build salary ranges for each bucket and use that for calibration as well. There are many other benefits of levels (and some drawbacks) but I'll save that for another time!</p>
<p>I have done something similar to this every six months for the past four years and it works reasonably well. A year ago I started bringing in my reports (who each manage 20-30 people), and we spend a few hours calibrating until we feel like the final compensation data is reasonably consistent. I try to target about 30% of the team getting a raise each year, so 15% each six months.</p>
<h2 id="other-considerations">Other considerations</h2>
<p>What happens when someone asks for a raise? In almost all cases, the answer should be <em>no.</em> You should do the salary calibration process in a way that people get salaries they deserve, but not more. The only exception to this rule is if their performance is way out of range and there's a real retention risks—essentially you're just doing an early off-cycle calibration.</p>
<p>I also strongly recommend against paying more to new managers than individual contributors. This incentivizes people to go into management for the wrong reasons, and make it very hard for people to step back if they decide management isn't what they wanted to do. In my experience, something like half of all managers realize they were happier not managing, and you don't want to lock people in.</p>
<h2 id="other-types-of-compensation">Other types of compensation</h2>
<p>So far, I simplified the problem a bit and talked about salary as if the base salary is the only consideration. There's of course many other things that constitute the total compensation, so let's consider what I think are the most common ones:</p>
<ol>
<li>Base salary</li>
<li>Bonus</li>
<li>Equity</li>
<li>Sign-on bonus</li>
</ol>
<p>Base salary is straightforward so let's skip to the other three.</p>
<h2 id="bonus">Bonus</h2>
<p>An odd thing about bonuses is how different it is for different jobs. Most salespeople are heavily commission-based. Most software engineers are compensated in stock and salary, with little/no bonus. Why? Is this just some dumb artifact of how the markets for those roles have evolved?</p>
<p>Of course not. You can easily <em>quantify</em> a salesperson's contribution to the company, and paying them commission aligns their contribution to the company with their compensation. It's extremely hard to quantify the contribution of software engineers. This is sort of an obvious point, but people forget about it! Why do traders and salespeople have bonuses? Why don't many other jobs? An excellent short read on this is <a href="https://www.amazon.com/Measuring-Managing-Performance-Organizations-Robert/dp/0932633366">Measuring and Managing Performance in Organizations</a>.</p>
<p>I don't have as much experience with bonuses, but my observation is that bonuses tend to work only in these three circumstances:</p>
<ol>
<li>The work result is quantifiable and aligned with the business. This is true for salespeople, but also quant developers and some other jobs.</li>
<li>The bonus is paid ad-hoc for hard hustle, maybe lots of overtime to hit a deadline. Management can dangle a bonus in front of employees to get something done quicker. This should probably only be a rare thing.</li>
<li>The bonus is roughly guaranteed (maybe even on the offer letter), and set to a fixed amount in advance. It's revoked only if the employee is severely underperforming. This seems to be the culture of Google and a few big companies, but I could be wrong and I'm hesitant to say much more since I don't know.</li>
</ol>
<p>My feeling is that for many professions, bonus tied to performance reviews or ratings is blunt and arbitrary, and should be avoided. For jobs where performance takes a long time to observe, sustained good performance should be reflected in higher salary+equity instead. I've always been skeptical about paying performance bonuses to software engineers other than in truly <em>exceptional</em> cases.</p>
<h2 id="equity-compensation">Equity compensation</h2>
<p>Equity is a key part of the compensation at startups. Some of the arguable benefits:</p>
<ol>
<li>Financially, it preserves cash for cash-strapped startups, and offers another currency so they can compensate top talent.</li>
<li>Economically, it aligns incentives between employees and the company, although I'm skeptical this matters past the first 5-15 people.</li>
<li>Psychologically, employees will rationalize their holdings and root for the company. I think this one might be underestimated, but it's hard to tell? There could also be some kind of “survivor bias”—people who deeply believe in your biz idea will be more likely to join.</li>
<li>Practically, employees will be tied to the employment because they don't have the money to exercise options. IMO this is kind of a dumb point because (a) if the company is doing well then you can usually arrange financing (b) it's probably not in the company's best interest to keep disgruntled employees who are only staying because of the equity.</li>
</ol>
<p>My highly speculative perception is that employees will view $1 of equity as having something like the following value:</p>
<p><img src="https://erikbern.com/assets/salary/equity-value.png" alt="equity value"></p>
<p>What's going on here?</p>
<ul>
<li>In the early days, people will take a huge salary discount to get something like $100,000 in equity in a promising super-early startup. Everyone in the tech industry has a friend (or a friend of a friend) who made a bajillion dollars in some acquisition. At this point, you can probably get away paying substantially lower than the market rate in terms of base salary.</li>
<li>Once the company matures, you're not going to get these early crazy people, and people will view equity as some weird paper money that may or may not be worth money in many years. At this point, you're going to have to raise the base salary substantially.</li>
<li>As you approach the IPO, people are excited to get into something that will have an “pop” once it goes public, and that they can sell relatively soon.</li>
<li>Once the company goes public, equity compensation is pretty liquid much just like cash, with some annoying constraints (trading windows, lockup periods etc).</li>
</ul>
<p>There's also difference in risk aversity and other things to be attuned to—some which depends on the personality, some on the life situation of the person.</p>
<p>What's my point of all of this? When you look at compensation, you should be smart about the breakdown between salary and equity. Optimizing for what people value increases your bargaining power.</p>
<p>In my opinion, the biggest thing companies mess up with equity compensation, is to <em>not explain it very well</em>. This causes people to discount its value, which means companies have to pay more salary to compensate for it. Companies should think more about this!</p>
<h2 id="sign-on-bonus">Sign-on bonus</h2>
<p>I'm not going to write too much about this one. I used to think sign-on bonus was the world's dumbest thing. Why pay more in the first year when an employee is the least productive? But from a company's point of view, it offers a critical advantage: you can retain salary consistency, while still being market competitive.</p>
<p>This applies especially in cases where there's significant uncertainty about a candidate. A $150,000 salary with a $20,000 sign-on bonus is essentially like a salary that drops from $170,000 to $150,000 the second year. If the person is awesome, you can always raise the salary back. If they aren't, then you keep them at their new “lower” salary, and keep your team's compensation consistent.</p>
<h2 id="total-compensation">Total compensation</h2>
<p>When you try to get salary consistency, you should really look at the total compensation number, not just base salary. Here's my opinionated view on how to do this:</p>
<ul>
<li>Base salary is obviously part of it.</li>
<li>Equity is a part of it, and divided by the vesting time, and <strong>using the original value of the grant,</strong> not the present value. And for options, subtract the strike price. I often also think it's worth putting a small discount (10-30%) on the value to compensate employees for the risk.</li>
<li>Bonus should only be a part of it if it's the “roughly guaranteed” type of bonus.</li>
</ul>
<p>Let's look at some examples. Let's say the value per share is $4, the strike price is $1, so that the value per option is $3. We'll discount it to $2.5 for the purpose of compensating employees. The shares are vesting over four years.</p>
<p>Let's consider two offers that are roughly equivalent from the company's point of view:</p>
<ol>
<li>$100,000 in base salary, with 50,000 shares: total value is $100,000 + 50,000 · $2.5 / 4 = $131,250</li>
<li>$110,000 in base salary, with 34,000 shares: total value is $110,000 + 34,000 · $2.5 / 4 = $131,250</li>
</ol>
<p>Two years later, the new value per option isn't $2.5 but $10. What happens to the total compensation. Using the <em>value at grant</em>, the compensation is still the same. Using the <em>present value</em>, the total compensation is now:</p>
<ol>
<li>$100,000 in base salary, with 50,000 shares: total value is $100,000 + 50,000 · $10 / 4 = $225,000</li>
<li>$110,000 in base salary, with 34,000 shares: total value is $110,000 + 34,000 · $10 / 4 = $195,000</li>
</ol>
<p>Let's say we had hired two employees, one who picked each option. Is either of them underpaid compared to the other? One has a lower base salary, but the other one has a lower total compensation. To me it's clear that these two <em>should be considered to have the same compensation.</em> So the logical way to think about total compensation is to use the value at the grant date.</p>
<p>This is an underemphasized point. HR people generally like to use the present value (because it makes the numbers look more impressive), or exclude equity compensation completely. This applies to resources like <a href="https://levels.fyi">levels.fyi</a> and Radford as well (both use <em>present</em> value, afaik). So when you do cross-company calibrations, be careful looking at total compensation.</p>
<p>Of course, use your own best judgement. If someone came in early and is vesting trillions of dollars of shares each month, they proabably aren't a retention risk, and you might be fine looking at the present value of the shares. Just be judicious!</p>
<h2 id="conclusion">Conclusion</h2>
<p>I started writing this post thinking it would be a quick one, but it ballooned into 4,000 words and that's after <em>heavy</em> editing where entire sections were removed. There's a lot more to be said, for sure. But hopefully you'll find some of this useful!</p>
<h2 id="notes">Notes</h2>
<ul>
<li>Throughout this post, I assumed people's productivity is a <em>known exact</em> quantity. Of course, that's a gross simplification, but it's a toy model, OK :)</li>
<li>Likewise, I assumed the market rate is a pretty tight band. There's always going to be weird outliers: people having deep expertise in things you don't care about, etc.</li>
<li>Where does the market rate come from? In theory, the market cost should converge to the <em>second highest value</em> that any company would get out of a candidate. I think this convergence is extremely <em>slow</em>, but definitely happens in the long run.</li>
<li>Of course, total compensation isn't the only thing that matters to people. The ability to learn and grow, perks, lifestyle, titles, office and much other things matter as well! But none of this affects the mechanics of the models.</li>
<li>I was tempted to write about remote work, but I really don't have much experience with it. The question I'm fascinated by: what's the equilibrium?</li>
<li>Note that a consistency-based model doesn't necessarily imply that a company pays the same salary across different locations! They could legitimately pay 2x salary to employees in NYC vs Boise, ID. People may grumble a bit, but the company could say something half-hearted about adjusting anyone's salary if they move to NYC.</li>
<li>You could even state inconsistency in mathematical terms. One way would be to define the inconsistency loss $$ I = \sum_{i} \max_j (s_j - s_i)H(p_i - p_j) $$, where $$ s_i $$ are salaries, $$ p_i $$ are productivities, and $$ H $$ is just a function that is 1 for positive numbers and 0 for negative ones (aka the Heaviside step function). The loss is zero if you have no inconsistency whatsoever, but positive when as soon as the productivity-salary curve is no longer <a href="https://en.wikipedia.org/wiki/Monotonic_function">monotonic</a>.</li>
<li>A fun theory! Consistency implies that roles with <em>more people</em> will have <em>less upside flexibility.</em> If Amazon gives a 5% raise to <em>one</em> of the warehouse workers, then they kind of have to give a raise to another 100,000 warehouse workers! But if they give a huge raise to a SVP of Mega-Technology, then that doesn't really violate any inconsistencies.</li>
<li>If someone is <em>slightly</em> overpaid, of course shouldn't just keep their salary without having a blunt conversation with them about their performance and the expectations you have on them, maybe also putting them on a performance improvement plan.</li>
<li>I modeled the function of salary vs productivity as a sublinear relation. The astute reader might point that in that case we should only hire people as far out on the x-axis as possible! That's maybe true, but there's more complexity to it, and <a href="/2019/02/21/headcount-targets-feature-factories-and-when-to-hire-those-mythical-10x-people.html">I've written about some of it</a> in the past.</li>
<li>I didn't talk about equity types, but there's a whole rabbit hole of RSUs vs ISOs vs NSOs and their legal/tax implications which would take a whole book to cover!</li>
</ul>
Never attribute to stupidity that which is adequately explained by opportunity cost2020-03-10T00:00:00Zhttps://erikbern.com/2020/03/10/never-attribute-to-stupidity-that-which-is-adequately-explained-by-opportunity-cost.html<p><a href="https://en.wikipedia.org/wiki/Hanlon%27s_razor">Hanlon's razor</a> is a classic aphorism I'm sure you have heard before: <em>Never attribute to malice that which can be adequately explained by stupidity.</em></p>
<p>I've found that neither malice nor stupidity is the most common reason when you don't understand why something is in a certain way. Instead, the root cause is probably just that <em>they didn't have time yet</em>. This happens all the time at startups (maybe a bit less at big companies, for reasons I'll get back to).</p>
<p>Some examples of things I hear all the time:</p>
<ul>
<li>I don't understand why <em>team X</em> isn't working on <em>feature idea Y</em>. It's such an obvious thing to do!</li>
<li>Why is <em>bug Z</em> still present? Hasn't it been known for a really long time? I don't understand why they aren't fixing it?</li>
<li>I don't get why HR team still doesn't offer <em>perk W</em>. So many other companies have that!</li>
<li>I've told my manager that we need a process for <em>thing V</em> but it still hasn't happened!</li>
</ul>
<p>Of course, why these things never happened is that <em>something else was more important</em>. Quoting Wikipedia on <a href="https://en.wikipedia.org/wiki/Opportunity_cost">Opportunity cost</a>:</p>
<blockquote>
<p>When an option is chosen from alternatives, the opportunity cost is the “cost” incurred by not enjoying the benefit associated with the best alternative choice. The New Oxford American Dictionary defines it as “the loss of potential gain from other alternatives when one alternative is chosen.” In simple terms, opportunity cost is the benefit not received as a result of not selecting the next best option.</p>
</blockquote>
<p>Thus I've started telling people: <em>Never attribute to stupidity that which is adequately explained by opportunity cost.</em></p>
<h2 id="your-friends-arent-stupid-just-busy">Your friends aren't stupid, just busy</h2>
<p>It might seem obvious the way I put it that opportunity cost is the thing to blame. But it's not. Human psychology works in weird ways. People love to conclude that something wasn't done because they are <em>stupid</em>, or possibly lazy.</p>
<p>This happens about 95% of the time when you don't <em>know</em> a certain person/team. The team that works on the CI/CD system is just a faceless blob in a different office and they must be completely stupid for never fixing the super annoying button in the interface. What are they doing all day! When you <em>know</em> a certain team/person, the percentage drops a bit: maybe stupidity is the first thought only 40% of the time. I'm obviously just making up these numbers, but you get the point.</p>
<p><img src="https://erikbern.com/assets/who_wants_to_be_a_millionaire.png" alt="who wants to be a millionaire"></p>
<p>I spent many years working in a satellite office. A lot of the time when I had some deep technical disagreement about something, I'd fly to the main HQ, and go out for dinner with the other team. I wouldn't even talk about technology, just about random stuff. Once they knew me, and realize I was a human (and not a faceless blob), most technical disagreements tended to go away. People are more likely to assume positive intent and not malice/stupidity/laziness.</p>
<h2 id="ruthless-prioritization">Ruthless prioritization</h2>
<p>Erring on the side of assuming opportunity cost as cause precludes any evil/stupid/lazy narrative: the team/person probably actually just had other more important priorities. But how did they pick those?</p>
<p>I'm not going to offer any smart advice on how to estimate effort and impact in your JIRA board. There's a trillion methods and tools and processes for doing that. But what I have come to believe is that: prioritization is the most value creating activity in any company. Generating ideas and executing things is of course also important! But what I've seen to set apart great teams from good is a brutal focus on <em>prioritization</em>. This means generating an absurd amount of ideas and throwing 99% of them out of the window, to focus on the 1% that have the highest impact.</p>
<p><img src="https://erikbern.com/assets/indiana_jones_choose_wisely.jpeg" alt="indiana jones"></p>
<p>Ideas will be generated much faster than there's bandwidth to execute on them, so you're doing something <em>right</em> if your backlog is growing indefinitely. A negative person on a mediocre team will complain that there's never time to work on <em>their favorite pet project X</em>. I've often heard things like “our backlog of features keeps growing so fast, how are we ever going to have time to invest in paying down tech debt?".</p>
<p>To me this reflects a misunderstanding of how product development <em>should</em> work. Backlogs <em>should</em> be growing indefinitely. What a <em>good</em> team will do is to accept that, and establish a good relationship between product and tech, and make sure you constantly keep reprioritizing. Maybe today it's shipping a bunch of features the business needs. Maybe tomorrow it's paying down some tech debt. If you have a shared framework for how to think about value and prioritization, it usually works out.</p>
<h2 id="opportunity-cost-matters-a-lot-less-at-bigcos">Opportunity cost matters a lot less at bigcos</h2>
<p>I mentioned in passing that opportunity cost is a likely cause at startups, but maybe less often at big companies. Why? Because a startup is often playing catch up building things that are mostly “obvious”. When you get to a very late stage, and you have a lot of money and a lot of developers, things get a lot more tricky. You can't do X because it will cannibalize metric Y and upset advertisers. You can't do Z because that would be inconsistent with how Q works. And so on.</p>
<p><img src="https://erikbern.com/assets/why_doesnt_screenshot.png" alt="why doesnt screenshot">
<em>Ultra-scientific study of company priorities.</em></p>
<h2 id="final-statement">Final statement</h2>
<p>We started with one seemingly innocuous statement, but it quickly led to many corollaries: how to trust people, how to manage the backlog, how prioritization can generate tremendous value. Fun!</p>
<p>I often keep quoting the paraphrased quote to people, but people have no clue what I'm talking about. Hopefully going forward, there's this blog post to refer people to!</p>
<p>Edit: this post was on the front page of Hacker News and generated <a href="https://news.ycombinator.com/item?id=23058280">some comments</a>.</p>
How to hire smarter than the market: a toy model2020-01-13T00:00:00Zhttps://erikbern.com/2020/01/13/how-to-hire-smarter-than-the-market-a-toy-model.html<p>Let's consider a toy model where you're hiring for two things and that those are equally valuable. It's not very important what those are, so let's just call them “thing A” and “thing B” for now. For one set of abilities, the scatter plot looks like this:</p>
<p><img src="https://erikbern.com/assets/hiring-tradeoffs/plot.png" alt="plot"></p>
<p>The assumption here is that A and B are drawn from a 2D-Gaussian with a mild positive correlation. I crammed a whole lot of stuff into this plot: the scatter plot shows the distribution of A vs B, and the two histograms (on top and on the right) shows the distribution over A and over B.</p>
<p>We're going to hire some people, so we look at a bunch of resumes and try to decide who's going to make it to the next stage. The best candidates are the ones that are great at both A and B, and we'll obviously bring them in. But some candidates are going to be good at A but not B, or vice versa. So you might choose to evaluate candidates on some combination of the two. For instance, bring in people for which $$ A + B > k $$ where $$ k $$ is some constant:</p>
<p><img src="https://erikbern.com/assets/hiring-tradeoffs/plot2.png" alt="plot"></p>
<p>We can already see something interesting here, which is that the candidates we bring in exhibit a <em>negative correlation between thing A and B</em>, despite those being independent. This is something that's called <a href="https://en.wikipedia.org/wiki/Berkson%27s_paradox">Berkson's paradox</a>.</p>
<p>I've <a href="https://erikbern.com/2015/04/07/norvigs-claim-that-programming-competitions-correlate-negatively-with-being-good-on-the-job.html">written about a particular example of this previously</a>: Google found that experience with programming competitions was <em>negatively</em> correlated with actual work success. This would happen if we relabel the x-axis above to say “general interview feedback” and the y-axis as “programming competition success”. The problem isn't that programming competition success is somehow bad: it might have a strongly positive correlation with future work performance. The problem is that Google probably <em>overweighted</em> programming competition success in their hiring process versus other things that would more accurately predict future work performance. This caused an “artificial” negative correlation between those two qualities <em>among the group that were hired</em>.</p>
<p>An <a href="https://www.nber.org/papers/w24343.pdf">interesting paper</a> claims a <em>negative</em> correlation between sales performance and management performance for sales people promoted into managers. The conclusion is that <em>“firms prioritize current job performance in promotion decisions at the expense of other observable characteristics that better predict managerial performance”</em>. While this paper isn't about hiring, it's the exact same theory here: the x-axis would be something like “expected future management ability” and the y-axis “sales performance”.</p>
<p>This problem of overweighting is a consistent theme throughout this post and we'll get back to it!</p>
<h2 id="it-gets-worse-the-market-forces">It gets worse: the market forces</h2>
<p>Because you're hiring in a market with many other players, the <em>really</em> good candidates may simply have so many options that they are going to go to whatever company they want to and make a zillion dollars. Let's say A and B are equally valued by you, as well as the market. We end up we something like this:</p>
<p><img src="https://erikbern.com/assets/hiring-tradeoffs/plot3.png" alt="plot"></p>
<p>Look at the green segment here: now there's an <em>even stronger negative correlation</em> between A and B.</p>
<h2 id="recruiting-is-like-buying-a-home">Recruiting is like buying a home</h2>
<p>This isn't only for recruiting, and I think this negative correlation is intuitively more clear in the context of buying a home. You might value an extra bathroom as worth +$50,000, and an extra bedroom as +$100,000, but <em>so does the market</em>. As a result, given your budget, you'll see a negative correlation between having an extra bathroom and having an extra bedroom, because the market prices you out of having <em>both</em>.</p>
<p>But this also presents an opportunity. The tradeoffs forces you to focus on <em>the things that you value more than the market</em>. Maybe you don't think a 4th floor walk-up is more than a -$10,000 penalty for you, but the market values it as -$20,000: then in fact you should hone in and target exactly those apartments. As we will see with recruiting, the trick to figure out <em>your own preference versus the market.</em> Let's dig into a few cases.</p>
<h2 id="a-few-case-studies">A few case studies</h2>
<p>A common human bias is to interpret confidence as a sign of competence, and as a first order approximation, let's say the market prices both equally. But let's assume that <em>we</em> decide we're not going to succumb to the same bias as the market as a whole. We conclude that the market overvalues confidence, and that we're going to do everything we can to eliminate this bias from our interviewing process. While competence isn't easy to observe, let's say we can get very close by having a carefully thought out interview process. The resulting chart is something like this:</p>
<p><img src="https://erikbern.com/assets/hiring-tradeoffs/plot_confidence.png" alt="confidence"></p>
<p>Our cutoff is going to be a vertical line, since we only care about competence, not confidence. The “market cutoff” is going to be the diagonal line. The people we end up considering will be the green triangle.</p>
<p>Here's the weird thing though: our group of people that <em>we</em> consider will:</p>
<ul>
<li>On average have <em>low</em> confidence</li>
<li>Exhibit a <em>negative</em> correlation with confidence and competence</li>
</ul>
<p>The same phenomenon arises in more complex situation. Let's say everything else equals, it <em>is</em> better to hire someone from a fancy school, but that the <em>market overvalues it</em>. In contrast, let's say we value general competence slightly more than the market. The market cutoff will be a 45 degree line, but our cutoff will be a line with a different angle. We end up with something like this:</p>
<p><img src="https://erikbern.com/assets/hiring-tradeoffs/plot_fancy_school.png" alt="confidence"></p>
<p>There's a similar conclusion here: we actually see that the candidates we're interested in went to a <em>less than average fancy school</em>.</p>
<p>More generally, the conclusion when you're hiring in a competitive market is that <em>even if you think some quality is desirable, if you think the market overvalues that quality, you should look at the other side of the spectrum</em>. This goes back to my example about buying a home.</p>
<h2 id="a-model-for-finding-the-best-candidates">A model for finding the best candidates</h2>
<p>The model so far is easy to understand and helps us explore a few tradeoffs when hiring but I think it falls short in a few areas. Let's create a slightly more complex model that is a bit less intuitive but I think slightly more realistic. This section is a bit more math, so feel free to skip if it's not your thing.</p>
<p>What we really want to optimize for is <em>our estimated value</em> divided by the <em>market's value</em> since the market determines the salary, roughly. Assumptions:</p>
<ul>
<li>The value to the company is $$ v_c = \exp(\alpha_c x + \beta_c y) $$ where $$ (\alpha_c, \beta_c) $$ is a vector with parameters we pick</li>
<li>The market value (i.e. the salary) is $$ v_m = \exp(\alpha_m x + \beta_m y) $$ where $$ (\alpha_m, \beta_m) $$ is a vector with parameters that the market values</li>
<li>The quantity we're trying to optimize is $$ z = v_c / (v_m + k) $$ where $$ k $$ is a constant.</li>
<li>The constant (which I set to $$ k = 1 $$) represents some combination of
<ol>
<li>We don't want to just take the market price for candidates: we pay them a fair base wage that ramps up with market demand.</li>
<li>The cost of hiring/onboarding/training.</li>
</ol>
</li>
</ul>
<p>Throughout the next few plots, let's set the “market vector” for all of them to $$ (\alpha_m, \beta_m) = (1, 1)$$ i.e. the market values the two things equally. We then vary how much <em>we</em> care about those things.</p>
<p>First of all, let's say we value A and B equally, but we care about them a bit less than the market. We bucket the candidates into three different buckets based on the value $$ z = v_c / (v_m + k) $$. If we plot this, we see the same negative correlation (the blue line):</p>
<p><img src="https://erikbern.com/assets/hiring-tradeoffs/exp_model_0.75_0.75.png" alt="plot"></p>
<p>If we decide we're going to <em>outbid the market</em> we can set $$ (\alpha_c, \beta_c) = (2, 2) $$ on the other hand:</p>
<p><img src="https://erikbern.com/assets/hiring-tradeoffs/exp_model_2.00_2.00.png" alt="plot"></p>
<p>The more interesting things happen if we decide we don't care about quantity B, but the market still does. This would correspond to the competence-confidence case where the x-axis is competence and the y-axis is confidence. The market values <em>both</em>, but we are smarter and we only value the former. We set $$ (\alpha_c, \beta_c) = (1, 0) $$:</p>
<p><img src="https://erikbern.com/assets/hiring-tradeoffs/exp_model_1.00_0.00.png" alt="plot"></p>
<p>Similarly to what we saw earlier, we see that we if we go after the “best” people (in terms of the quantity $$ z = v_c / (v_m + k) $$ then we actually end up hiring the people that have less-than-average confidence. This is because the market systematically underprices those.</p>
<p>In the other case when we think thing A and B are both positive, but we think the market <em>overvalues</em> thing B, we can set $$ (\alpha_c, \beta_c) = (1, 0.5) $$. This would correspond to the example where A is the fanciness of the school they went to.</p>
<p><img src="https://erikbern.com/assets/hiring-tradeoffs/exp_model_1.00_0.50.png" alt="plot"></p>
<p>The outcome is somewhat similar. Even though we prefer candidates from fancy schools, we still end of being better off hiring people from “average” schools. Again, this is because the market systematically <em>undervalues</em> those. The fact that we consider B a “good” quantity is less relevant than the fact that we consider it <em>less valuable</em> than the market does.</p>
<p>A different case would be a company that <em>only</em> pays attention to some superficial measurement <em>at the cost of things that matter more</em>. For instance, let's say the x-axis is “task-relevant experience” and the y-axis is “fanciness of their degree”. This situation isn't so contrived: I've talked to recruiters at bigcorp enterprises, where there's a strong mandate to only hire Ph.D.‘s but where (my guess) the interview process is pretty noisy. We set $$ (\alpha_c, \beta_c) = (0, 1) $$:</p>
<p><img src="https://erikbern.com/assets/hiring-tradeoffs/exp_model_0.00_1.00.png" alt="plot"></p>
<p>The interesting observation is the histogram at the top: the blue distribution of hired candidates end up having a <em>much lower task-relevant experience</em> than the ones that were rejected. Not a hiring strategy I would endorse. There is however one odd twist to this. Let's say we keep ignoring feature A (task-relevant experience), but we throw all our money bidding out basically anyone else based on B (fanciness of their degree):</p>
<p><img src="https://erikbern.com/assets/hiring-tradeoffs/exp_model_0.00_3.00.png" alt="plot"></p>
<p>Because there's some small correlation between A and B, we actually <em>do</em> end up at this point getting higher-than-average skills in terms of A. The cost is that we're going to have to out-spend everyone else. A far more cost-conscious way would be instead to pay a medium premium for A and a small for B, rather than a huge for B but none for A.</p>
<h2 id="conclusions-and-opportunities">Conclusions and opportunities</h2>
<p>If you ask the average recruiter how they find people, it's usually some type of Boolean search on LinkedIn, and when you ask them how they grade resumes, it's typically some combination of having CS degrees from fancy schools, having the exact experience with the tech stack you have (down to frameworks), etc. God forbid if someone has a gap on their resume, or if they need visa sponsorship.</p>
<p>What my model implies, is that there's an “arbitrage opportunity” here. In fact, it's a bit of a silver lining to the fact that the market is biased. Are companies systematically putting a premium on something? Then bet against them! Go after the underdogs. If every hiring manager acts in their own rational self-interest (which unfortunately, they don't) then over time these biases will vanish and the market will converge towards efficiency.</p>
<p>You might have your own personal preferences here, and I'm not going to judge you, but here's a few thoughts on things that may be undervalued by the market:</p>
<ul>
<li>Candidates from non-fancy schools</li>
<li>Candidates who didn't go to school at all and are self taught, or have some non-traditional path into the field</li>
<li>Candidates who didn't get a CS degree</li>
<li>Candidates who never worked at any well-respected company</li>
<li>Candidates who are low confidence or “interview poorly”</li>
<li>Candidates that could experience discrimination for other reasons, like being from an underrepresented groups, or not fitting some stereotype of what a software engineer should look like</li>
<li>Candidates who need visa sponsorships</li>
<li>Candidates who don't have experience with your exact tech stack, but a strong generalist foundation (this is especially prevalent in complex industries, which I <a href="https://twitter.com/bernhardsson/status/1197515498537267200">tweeted</a> something about this a few weeks ago)</li>
<li>Candidates who left the workforce for a while to take care of family</li>
<li>… many more things</li>
</ul>
<p>I want to be extra clear about what my conclusion here is. I'm not saying you should think of it as a bad thing that someone is coming from a fancy school. Everything else equals, it's typically a good thing! What I'm saying is that if you're hiring, then you will be <em>more successful going after candidates that the market undervalues.</em> And this doesn't just apply to measurable things (what school they went to), but also things that people subconsciously value (eg. confidence of a candidate). On the other hand, <em>overvaluing</em> things (that are less predictive of future work performance) can lead you to hire worse candidates.</p>
<p>In all these cases, it turns out <em>your preference versus the market's preference</em> matters more than your preference in itself.</p>
<p>All of this stuff may or may not sound obvious to you!</p>
<h2 id="appendix">Appendix</h2>
<ul>
<li>I only talked about tradeoffs between two traits (A and B), but the model extends well into many more ones. But computer screens are two-dimensional and it's harder to plot more dimensions than 2!</li>
<li>These models may seem a bit arbitrary to you, and of course every model is a somewhat arbitrary simplification of reality! I'm not claiming that it's perfect.</li>
<li>That being said, both models gave the answer my intuition told me on basically the first attempt: the conclusions are very robust to the inputs, and I spent almost zero time trying to pick the right parameters.</li>
<li>Even without the screening step and without a competitive market, you might still end up with a negative correlation for the people you make an offer to. I've mentioned this in the past talking about <a href="/2016/10/25/pareto-efficiency.html">Pareto frontiers</a>. It's a slightly different phenomenon, though.</li>
<li>I don't mean to pick on recruiters, and there are some absolutely outstanding ones that I've worked with in my life!</li>
<li>I accidentally published a draft of this a few days ago, sorry about that!</li>
<li>The (very simple) code <a href="https://github.com/erikbern/hiring-model">is on Github</a>, as always.</li>
</ul>
What can startups learn from Koch Industries?2019-12-19T00:00:00Zhttps://erikbern.com/2019/12/19/what-can-startups-learn-from-koch-industries.html<p>I recently finished the excellent book <a href="https://www.amazon.com/Kochland-History-Industries-Corporate-America/dp/1476775389">Kochland</a>. This isn't my first interest in Koch—I read <a href="https://www.amazon.com/Science-Success-Market-Based-Management-Largest/dp/0470139889/ref=asc_df_0470139889/">The Science of Success</a> by Charles Koch himself a couple of years ago.</p>
<p>Charles Koch inherited a tiny company in 1967 and turned it into one of the world's largest ones. That's impressive! Just a quick disclaimer just to get it out of the way. You may know the Koch brothers as the climate deniers who funded the Tea Party. I don't understand this disconnect between being so brilliant in one field, and extremely ignorant in another. But my curiosity tells me there's something worth learning from most notable people, <em>despite what I may think of their opinions</em> and Koch Industries turns out ot be a particularly interesting case study.</p>
<p>Let's go through a few ways I think startups (and any companies) can take notes from what Charles Koch has accomplished.</p>
<p><img src="https://erikbern.com/assets/koch.png" alt="koch"></p>
<h2 id="measuring-results">Measuring results</h2>
<p>Aligning incentives with what's in the long term interest of the business is an extremely hard thing to get perfect, especially at a large scale. A lot of it comes down to how you <em>measure results</em>. Ideally, you want measure (and reward) the performance of individuals in a way that's 100% correlated with business value.</p>
<p>Koch's approach to a lot of this boils down to holding <em>business units</em> and even individual <em>plants</em> accountable for their profits and losses. This creates essentially 100% alignment with the management of those units/plants and what the company wants (maximize profits)! If you also give those managers full freedom to pursue their objective in any way you want, then you have <em>both</em> full accountability and agency.</p>
<p>There are many caveats applying this to startups, since:</p>
<ul>
<li>The vast majority of all startups make no money</li>
<li>Startup teams are too entangled to have their own P&L</li>
<li>Startups need to invest in crazy ideas with low chance but high expected outcome</li>
</ul>
<p>… BUT, I've also seen several success stories when you put a smart person in charge of a key metric (say acquisition costs) and tell them from now on, they own it, and they need to do whatever they can to get it down. Accountability+agency can work extremely well.</p>
<h2 id="creating-a-culture-of-entrepreneurship">Creating a culture of entrepreneurship</h2>
<p>One tenet under Charles Koch's school of thought called <em>Market-Based Management</em> (MBM) is “principled entrepreneurship”, meaning let everyone in the company think about their job as a business owner. Every company should make it clear to everyone, that it's their duty to:</p>
<ul>
<li>Understand how what they are doing adds business value</li>
<li>Think entrepreneurially and suggest improvements when they see it</li>
</ul>
<p>By decentralizing the ability to observe and suggest improvements, you get the people close to the markets to make decisions and react quickly. Every company should take notes.</p>
<p>Koch Industries made some mistakes along the way. There's a trap if you push too much for it. Kochland, p. 192:</p>
<blockquote>
<p>Every Koch business leader was expected to create their own Value Creation Strategy. They needed to look for new companies to buy, new plants to build, and expansion projects for existing plants. […] Business leaders knew that Charles Koch would cut or increase their bonus pay based on the Value Creation Strategies they delivered. This change rippled out through the ranks. Deals were proposed and sent to Wichita—everybody wanted a big acquisition under their belt.</p>
</blockquote>
<p>I have seen the unintended consequence of people being rewarded for <em>suggesting and pitching</em> a deal, but not held accountable for <em>making the deal work</em> in the long term. The results are not great. Koch seems to have learned this lesson and cracked down on the dealmaking bonanza, after a disastrous acquisition of Purina Mills.</p>
<h2 id="encouraging-long-term-thinking">Encouraging long-term thinking</h2>
<p>As I just mentioned, you just have to be ruthless about holding people accountable for actually delivering, and not just delivering the slideware. Koch learned it the hard way. Kochland, p. 199:</p>
<blockquote>
<p>And these people were not the right kind of people. Koch had begun to stock its ranks with MBA students from the best business schools around the country. Brad hall spent a lot of his time trying to unteach these kids what they learned at Northwestern University or Harvard. And there was a cultural element as well. Many executives inside Koch Industries saw a type of freelance culture was growing among the young guns. They were looking out for themselves, not the company.</p>
</blockquote>
<p>Creating long-term alignment between the employees and the company is crucial, or you will hire careerists who are self-optimizing. When you promote based on who pitches the best rather than who delivers the best results, you will reward short-term behavior. This is a classic <a href="https://en.wikipedia.org/wiki/Principal%E2%80%93agent_problem">agency problem</a>. I suspect <em>moving to Wichita</em> was in an odd way one of the ways Koch might have filtered out short-termist thinkers.</p>
<p>Throughout a set of sweeping changes, Charles Koch reformed the company. Kochland, p. 221:</p>
<blockquote>
<p>After the purge was complete, Charles Koch didn't replace his leaders with fresh employees who were hired from the best business schools or other companies, Instead, he promoted loyalists who knew the Koch way. […] The new team was composed entirely of men who were steeped in Charles Koch's values and who were imbued with the lessons of Koch University. These were the people who spoke the language of Market-Based Management. Charles Koch promoted players from his own farm team into the big leagues.</p>
</blockquote>
<p>Hiring “careerists” can be dangerous at any company, but there's also ways to make sure the system is set up to promote people with a longer term view. Startups typically award stock options vesting over four years as a way to align the interest of the early employees with the company. One of the reasons I've always been skeptical of bonuses because it favors short-term thinking, as opposed to equity grants or increases in total compensation which are awarded based on sustained high performance.</p>
<h2 id="fixing-the-unintended">Fixing the unintended</h2>
<p>Consider a hedge fund paying its traders a fraction of the profit: that will incentivize them to make dangerous bets of the type:</p>
<ul>
<li>90% the fund makes $100M.</li>
<li>10% the fund loses $10B.</li>
</ul>
<p>The expected value is very negative, but a smart trader should take this bet every year: they will walk away with a huge bonus year after year until bad luck strikes and they are fired (but get to keep their bonuses).</p>
<p>Most incentive system end up having similar flaws, and this is another thing Koch Industries learned the hard way. Kochland, p. 215:</p>
<blockquote>
<p>Oil gaugers interpreted Koch's push for “continuous improvement” as a reason to give Kochs's customers a bad deal. The refinery managers had interpreted Koch's push for “profit centers” as a reason to dump pollution into wetlands and delay investments that would have reduced pollution. The common teachings of MBM had too often turned into a language of groupthink, prompting managers to persecute whistle-blowers rather than heed their important warnings. MBM's focus on growth had encouraged irresponsible acquisitions that piled up losses, and public failures like the collapse of Purina Mills.</p>
</blockquote>
<p>How do you fix something like this? In the case of hedge fund traders, you can introduce certain risk metrics, and require that those can't exceed certain predefined values. Trade what you want, and you get a share of the profit, but you <em>cannot exceed certain risk limits</em>.</p>
<p>Charles Koch's invention is something he calls <em>10,000% compliance</em> (100% compliance, 100% of the time). This wasn't just a directive, but also a part of the <em>culture and belief system</em>. When you know that the company cares and you know that your coworkers know and they know you know, then these rules are far more effective.</p>
<h2 id="creating-a-corporate-culture">Creating a corporate culture</h2>
<p>I live in New York City, which is 10+ million people living on top of each other. If you suddenly stop on the sidewalk, and someone is walking behind you, they will highly likely yell at you. This might seem harsh, but I'd argue it's actually the very basis for which so many people can coexist so close to another. Having strong cultural tenets (for instance: “you need to be careful about other people's space”) comes with the flip side, that if those cultural norms are violated, then there will be swift punishment. So in a weird way, it comes from the fact that people care.</p>
<p>Culture works in other ways, too. It can be a shared belief system that people can fall back on. If I work at a startup, and one department is obsessed about lowering costs, while the other one is obsessed about growing volume, then they are making decisions based on different assumptions. A shared belief system helps people coordinate without having to explicitly coordinate. Does this company believe in quality at any cost? Are we frugal? Do we hire “the best”? Kochland, p. 568:</p>
<blockquote>
<p>Senior leaders at Koch Industries phrased everything they said in the vocabulary of Market-Based Management. One of Charles Koch's indisputable accomplishments over the preceding thirty years was creating an organization where every employee—to a person—publicly subscribed to the same intricately encoded philosophy, Division heads who came to Wichita spoke in terms of mental models and discovery processes and the five dimensions. They talked about integrity. Decision rights. Challenge processes. Experimental discovery. Virtues and talents. They weren't the dog whistles or catchphrases. They were the internal vocabulary of Kochland. Learning them was the first condition to winning a seat at the table.</p>
</blockquote>
<p>Regardless of what you think of Market-Based Management, the fact that at <em>whole 100,000+ people organization agreed on a shared set of principles</em> implies a lot of decision making gets vastly simpler. There is something impressive about this.</p>
<h2 id="final-words">Final words</h2>
<p>Has Charles Koch figured it out and cracked the management code? Definitely not. Has he thought a lot about incentives and culture? Absolutely. Does saying that mean I subscribe to his worldview? No way.</p>
<p>I always dig a good book about corporate dynasties and Kochland was a great one. My understanding of Koch went from nonexistent to superficial, and some of this post may be of questionable accuracy. Please excuse any liberties I took trying to apply it to startups!</p>
We're hiring at Better2019-12-09T00:00:00Zhttps://erikbern.com/2019/12/09/hiring-at-better.html<p>Just a quick note that my team is always hiring at <a href="http://better.com/">Better</a>. A lot of new people have been joining the team here in NYC lately—the tech team has actually grown from 35 to 60 in just ~3 months. We are primarily looking for senior software engineers and/or engineering managers. But we would love to talk if you have less experience too! Our main tech stack is mostly TypeScript and Python.</p>
<p>We are also growing our data team and if you're interested in different data problems, I would love to chat. The team is only six people but will be growing very quickly. The most important thing I look for is curiousity about business and product—an entrepreneurial drive that compels you to dig into numbers and understand how everything fits together. The team works on the core data infrastructure as well as exploring hypothesis with product managers and other stakeholders. Most of the work is in Python, with a fair amount of SQL as well. If you know a bit machine learning or statistics, that's helpful, but not required. We do a fair amount of ML/stats at Better, but I consider those to be tools among many other things, and we don't have any roles for doing ML/stats full-time.</p>
<p>We are also looking for managers to come in and manage parts or all of the data team. If you have experience with both data and management, definitely reach out!</p>
<p>Finally, we're also looking for product managers. The product team (under new leadership by <a href="https://www.linkedin.com/in/devangt/">Devang Thakkar</a>) is growing quickly (from 5 to 15 this year). We love to talk to you, especially if you have experience with deep automation problems (e.g. have a background in logistics, supply chain, operations research, or similar), OR if you have experience working with customer facing applications and you love to understand how to make customers love your products more, increase conversion rates, etc.</p>
<p>Just as a quick recap of what we're doing at Better: the mortgage industry is a huge very broken industry. 7 million Americans get a mortgage every year, and the average experience is like getting a root canal done on your finances. We are rethinking the industry from the ground up, by going after it as a tech startup—automating the whole process, putting it online, getting rid of the traditional commission-driven sales-centered model, and fundamentally offering a much better user experience as well. As a result of everything we're doing, we are also able to offer the lowest rate for a large segment of the US population.</p>
<p><img src="https://erikbern.com/assets/better-office-view.png" alt="better office view">
<em>It could be you on this photo!</em></p>
<p>Feel free to email me at erik at better.com, or reach out to me <a href="https://twitter.com/bernhardsson">on Twitter</a> or any other platform of your choice. You can also <a href="https://grnh.se/c55e10c71">apply directly</a>!</p>
<h2 id="by-the-way">By the way</h2>
<ul>
<li>I just moved my blog from Jekyll+S3+Cloudfront to Hugo+Netlify. A lot of minor things broke in the process, that I've been fixing as I discover them. Please let me know if you see anything funky!</li>
<li>I know I haven't posted much lately. Being a startup CTO with two toddlers has gotten the best of me. But I have a few things coming down the pipe soon!</li>
</ul>
Buffet lines are terrible, but let's try to improve them using computer simulations2019-10-16T00:00:00Zhttps://erikbern.com/2019/10/16/buffet-lines-are-terrible.html<p><a href="https://better.com">My company</a> has a buffet every Friday, and the lines grow to epic proportions when the food arrives. I've suspected for <em>years</em> that the “classic” buffet line system is a deeply flawed and inefficient method, and every time I'm stuck in the line has made me more convinced.</p>
<p>This <em>is</em> a hill I'm willing to die on, and it's also a place where I have a secret weapon: a well-executed computer simulation that solves this problem once and for all has an opportunity to unleash an 0.1% improvement in GDP. Consider all that time lost in lines! So I went to business. A few hours later (a bit too many hours!) I built a simulation framework for buffet lines.</p>
<p>Note: throughout the rest of the blog, there will be some huge animated gifs. Out of respect for your bandwidth, I have cut the gifs to be only 10s each, but there are also links to full 150s videos (mp4).</p>
<h2 id="how-do-you-simulate-a-buffet-line">How do you simulate a buffet line?</h2>
<p>I wrote a <a href="https://github.com/erikbern/buffet">Python script</a> to simulate buffet lines. The setup is pretty simple, although there's a lot of assumptions being made:</p>
<ul>
<li>There are 10 items on the buffet</li>
<li>Any person wants a random 40% of those items</li>
<li>Each person comes in from the left and exits to the right</li>
<li>They take the food in order from left to right</li>
<li>Each person walks according to a <a href="https://en.wikipedia.org/wiki/Dijkstra%27s_algorithm">shortest path</a> towards the next goal</li>
<li>There is a rate (the “arrival rate”) by which new users enter on the left</li>
</ul>
<h2 id="classic-method">“Classic” method</h2>
<p>With the “classic” method, I'm referring to the single-line method where everyone is waiting in one big line that passes by all the items. This method works well at low arrival rates. For instance at 0.3 people per second, here's the state after 100 seconds (see <a href="/assets/buffet/classic-0.3.mp4">full video here</a>):</p>
<p><img src="https://erikbern.com/assets/buffet/classic-0.3.gif" alt="classic 0.3"></p>
<p>My simulation script produces these videos as a side effect: with random emojis for the food and people. I hope you enjoy it, because there will be a lot more! Focusing on the classic method for now: it turns out to be “unstable” as soon as the arrival rate goes up by just a little bit, in this case 0.7 people per second (see <a href="/assets/buffet/classic-0.7.mp4">full video here</a>):</p>
<p><img src="https://erikbern.com/assets/buffet/classic-0.7.gif" alt="classic 0.7"></p>
<p>You can see the people accumulating on the far left side waiting for their turn. The line of people in fact just keeps growing and growing. It turns out that this method has a critical maximum capacity of something between 0.3 and 0.7 people per second. What do I mean with that? Every queue system has some <em>upper capacity</em> that determines the highest possible arrival rate. Above that, the queue keeps growing longer and longer because fundamentally the arrival rate is higher than the rate at which people are exiting the system.</p>
<p>There's no easy way to estimate the capacity of the system other than varying the arrival rate and seeing at what point the system breaks down. We do that by simulating the system at different rates. Let's consider some more methods next!</p>
<h2 id="rogue-method">“Rogue” method</h2>
<p>A marginally better model is to let everyone go in any direction they want, including skipping, but potentially also going back to the left. This method has a slightly higher capacity, but breaks down around an arrival rate of 0.7 people per second (see <a href="/assets/buffet/rogue-0.7.mp4">full video here</a>):</p>
<p><img src="https://erikbern.com/assets/buffet/rogue-0.7.gif" alt="rogue 0.7"></p>
<p>The lines in the video above is the shortest path towards the next food item each person wants, or to exit the system on the far right.</p>
<p>The problem is that people get “stuck”. Maybe this is a problem with the simulation, since my simulated puppets are dumb and won't consider the fact that they are blocking each other. The rogue method <em>does</em> in fact have a slightly higher capacity than the classic method, but with maybe other drawbacks (like getting elbowed by someone panicked, starved soul).</p>
<p>Let's consider to some slightly smarter methods.</p>
<h2 id="dont-go-backwards-method">“Don't go backwards” method</h2>
<p>One maybe not obvious observation from the previous system is that the possibility of <em>going backwards</em> (to the left) causes these blockages. If we made it <em>impossible</em> to go backwards, then people would never go further right than their next food item. This would mean people getting the food are never blocked from going to their next item. This simple rule change turns out to increase the capacity of the buffet substantially, to somewhere around 1.0 arrivals per second (see <a href="/assets/buffet/skippable-0.8.mp4">full video here</a>):</p>
<p><img src="https://erikbern.com/assets/buffet/skippable-0.8.gif" alt="skippable 0.8"></p>
<p>This method tends to cause a bit of an accumulation of people at the first food item, especially at a higher arrival rate: <a href="/assets/buffet/skippable-1.0.mp4">see video here</a>. As the rate goes up even more, this jam because a complete gridlock: see a <a href="/assets/buffet/skippable-2.0.mp4">full video here</a>.</p>
<p>In practice, this system is pretty intuitive. Just keep walking towards your next food item, and if you don't want a particular one, just skip it and walk around anyone in between. This basically avoids the “frustrating” points of the classic method, where you're blocked behind someone loading up on food that you don't even want, just because you want something <em>later</em>.</p>
<h2 id="perpendicular-lines-method">“Perpendicular lines” method</h2>
<p>One method is to make the people line up in lines perpendicular to the food. This seems to handle up to roughly 1.0 arrivals per second (see <a href="/assets/buffet/vline-0.8.mp4">full video here</a>):</p>
<p><img src="https://erikbern.com/assets/buffet/vline-0.8.gif" alt="vline 0.8"></p>
<p>This system might seem very orderly, although a drawback is that the long perpendicular lines causes a lot of extra walking: this drives up the total time it takes for people to get food, meaning more people around at any point in time, causing delays for other people. For a video of what happens when the arrival rate goes up to 2.0, <a href="/assets/buffet/vline-2.0.mp4">see here</a>.</p>
<h2 id="which-system-is-the-most-optimal">Which system is the most optimal?</h2>
<p>Given the four methods I've just outlined, the question is: which one is the most efficient? For reasons I've alluded to above, it's not trivial to measure capacity by just simulating. But to spare you the ruminations, I'm jumping straight to the conclusion first. Which system is really the best? If my simulations are correct (a big <em>if</em>), the list looks as follows:</p>
<ol>
<li>“Don't go backwards” method (best)</li>
<li>“Perpendicular lines” method</li>
<li>“Rogue” method</li>
<li>“Classic” method (worst)</li>
</ol>
<h2 id="lets-dig-a-bit-deeper">Let's dig a bit deeper</h2>
<p>Analyzing these methods is somewhat <del>annoying</del> tricky. We have a system with some arrival rate, each person spends some time in the system, and then exits. The (average) time it takes for a person to enter, get all its food, and exit, is called the “cycle time”. There is also an upper limit to the capacity of the method. As the arrival rate gets closer and closer to the capacity, the <em>cycle time goes to infinity</em>. When the arrival rate <em>exceeds</em> the capacity, more and more people accumulate indefinitely, with no end in sight.</p>
<p>I varied the arrival rates by increments of 0.05, from 0.05 to 2.0. If we vary the arrival rate and look at the <em>number of people in the system</em> over time for a particular method, it looks something like this:</p>
<p><img src="https://erikbern.com/assets/buffet/queue_skippable.png" alt="skippable queue size"></p>
<p>What are the colors here? I devised a hypothesis test to see if the queue is “stable” or growing over time. The red lines are the simulations where the arrival rate seems to exceed the capacity: the queue size grows indefinitely in those cases.</p>
<p>Another way to slice the data is to look at the distribution for the time it takes to “finish” for each person. I ended up using my own library <a href="https://github.com/better/convoys">convoys</a> for this.</p>
<p><img src="https://erikbern.com/assets/buffet/cohorts_skippable.png" alt="skippable cohort"></p>
<p>In the chart above, I grouped the arrival rates into slightly larger buckets so it's easier to follow. From both the charts above, we can see that the critical rate for this method seems to be around 0.8-1.0 arrivals per second. Below that, and everyone gets their food eventually. Above that, and the system turns into gridlock. From the cohort chart (the second one), you can see that less than 100% of the people that enter the system ever exit. Poor them!</p>
<p>Comparing all methods for a single rate shows that the “Rogue” method and the “Don't go backwards” are roughly similar up until ~0.6 arrivals per second:</p>
<p><img src="https://erikbern.com/assets/buffet/cohorts_0.45-0.60.png" alt="0.45-0.60 cohort"></p>
<p>However, at 0.8 arrivals per second, the “Rogue” method breaks down into rubbish. The “Don't go backwards” method is still holding strong!</p>
<p><img src="https://erikbern.com/assets/buffet/cohorts_0.65-0.80.png" alt="0.65-0.80 cohort"></p>
<p>Comparing all simulations shows that the “Don't go backwards” method seems to work well for most arrival rates. In the chart below, that method is the <em>most</em> towards the lower right side, which is the best place to be (low cycle time despite a high arrival rate):</p>
<p><img src="https://erikbern.com/assets/buffet/stats.png" alt="stats"></p>
<h2 id="what-else-can-we-do">What else can we do?</h2>
<p>Unrelated to the method itself, there are other things we can change to increase the throughput. Moving the food so that it's accessible from <em>both sides</em> increases throughput a ton. With the “Don't go backwards” method, this lets us handle an arrival rate of 1.5 people/s easily (see <a href="/assets/buffet/skippable-layout2-1.5.mp4">full video here</a>):</p>
<p><img src="https://erikbern.com/assets/buffet/skippable-layout2-1.5.gif" alt="skips layout2 1.5"></p>
<p>There's more experiments that need to be run here: consider it the next frontier for buffet line research.</p>
<h2 id="notes">Notes</h2>
<ul>
<li>If I had a million dollar grant, the next step would be to actually implement this with real humans and study their behavior. After all, this is more empirical research than it is theoretical.</li>
<li>Writing the simulation in Python was probably a bad idea in retrospect: it turns out to be incredibly slow to run Dijkstra's shortest path algorithm on a large grid. Some simulations took more than a day to run (on a c2.8xlarge in AWS).</li>
<li>A ton of time it took to implement the simulation had more to do with weird behaviors that would happen based on your assumption. For instance, I initially modeled people as circular, but they would get stuck in a “hexagonal” pattern. Changing them to be square resolved the issue.</li>
<li>The hypothesis test I mentioned to see if the queue is “stable” is something I cooked up myself: draw samples from a Gamma-Poisson mixture and see if the imbalance between arrivals and exits is at least as extreme as what we observed. No idea if it's the best way but I really only use it to color lines in a graph so who cares.</li>
<li>In order to determine the average latency in the scatter plot, I use <a href="https://en.wikipedia.org/wiki/Little%27s_law">Little's law</a> and compute it from the average queue size and the arrival rate.</li>
<li>The <a href="https://github.com/erikbern/buffet">code is on Github</a>, as always.</li>
</ul>
Miscellaneous unsolicited (and possibly biased) career advice2019-09-26T00:00:00Zhttps://erikbern.com/2019/09/26/misc-unsolicited-career-advice.html<p>No one asked for this, but I'm something like ~12 years into my career and have had my fair share of mistakes and luck so I thought I'd share some.</p>
<p>Honestly, I feel like I've mostly benefitted from luck. Some of the things I did on a whim turned out to be excellent choices many years later. Some of the things were clear blind spots in hindsight. If I could give my 12 years younger self a bunch of career advice, here are some of those things.</p>
<p><img src="https://erikbern.com/assets/double_rainbow.jpeg" alt="double rainbow"></p>
<h2 id="choosing-a-company">Choosing a company</h2>
<p>This roughly boils down into:</p>
<ul>
<li>Pick the fastest growing company you can find. My own personal development was always highly correlated to the company growth. That's really just an empirical observation, but here's an attempt at explaining this relationship: Stagnant companies are zero sum. If your peer gets a promotion, that means the slot is taken and you don't get the promotion. If you get to work on a cool project, someone else can't. In contrast, fast growing companies have this Ponzi-schema quality that <em>everyone gets promoted! everyone can work on interesting projects!</em> On top of that, there's this fundamental mismatch between labor supply and demand internally, where there's a “pull” in every direction. I started managing at 25 and was running a machine learning team soon thereafter, despite having no formal background in machine learning. Why? Not because in the universe of people, I was the best one (by far not). But because there was <em>no one better around and we didn't have time to find one.</em> Someone just has to step up and do it.</li>
<li>When you're young, care more about building human quickly and not so much about financial capital. The human capital will pay much larger dividends over your lifetime.</li>
<li>Go where other smart people are. That's where you're going to build your human capital the fastest.</li>
<li>When I say smart, I really mean <em>people you can learn from.</em> I've worked with some very smart people who I didn't learn from and it was a waste of time.</li>
<li>Don't pick a company because your friends and family think it's cool.</li>
<li>Consider going into an industry where there's not many smart people. A team of smart people in an industry with not a lot of smart people can move mountains. A team of smart people where everyone else is smart will have a harder time.</li>
<li>Don't be afraid of going into a weird industry. No one thought the music industry seemed like a great place when I joined Spotify 2008. I bet people said the same thing about taxi industry in 2011. Etc. Things always look cool in hindsight.</li>
<li>In general, do a lot of internships. It's not just a great experience to have, it's also a great way to learn what <em>you</em> like to to. School is partly just a way to postpone all your major life decisions and learn a bit more about what you want to do.</li>
<li>When you're no longer learning, then it's time to do something else.</li>
</ul>
<h2 id="building-human-capital-vs-building-superficial-markers">Building human capital vs building superficial markers</h2>
<p>I largely think your internal human capital is the only thing that matters in the long run. If for whatever reason someone about to graduate <em><insert elite university here></em> breaks their foot on their graduation day, and then misses it, and then for whatever (dumb hypothetical) reason never gets their diploma, does that make them less productive? Not at all. Another example: there's some evidence that <a href="https://www.sciencedirect.com/science/article/pii/S0167268119302495">people with tattoos</a> are short-sighted. So you can argue that tattoos are a negative external marker. But if <em>you</em> go get a tattoo, it doesn't change <em>anything</em> about your human capital.</p>
<p>Your title is one thing where people pay too much attention. People have a misconception that your title will open more doors. It won't. In fact, it might even hurt. For instance, as soon as you start managing people, your options actually <em>go down,</em> since people assume you want to stick to a management role, but there's less demand in the market for management role (most companies I know prefers to hire ICs and promote them from within).</p>
<p>It's also really dangerous to get carried away by something that's celebrated in whatever world you're in. For instance, in academia, tenure is the ultimate goal. At a big company, your worth is roughly measured in how many people you manage. It's easy to think that those things are universally valuable, but they often don't mean a ton outside. If you're applying to an early stage startup, they probably don't care (or it might even close doors) that you are managing 300 people at a large industrial firm with a huge HQ in a suburb.</p>
<p>That being said, sometimes these markers are useful to get somewhere. The key trick is to focus on the <em>lowest cost highest impact</em> ones. For instance, getting a PhD is an insanely high cost marker, as is going all-in and getting a perfect GPA. Those aren't bad things in themselves, but the <em>signal value compared to the investment</em> is much lower than other things. For some things on the other spectrum, things with high signal value compared to the investment, I would say having built an open source project (that people use), or some award, having written things that got published, having started your own company (even though it failed), or many other things.</p>
<h2 id="acquiring-new-skills">Acquiring new skills</h2>
<p>Some thoughts in no particular order:</p>
<ul>
<li>There's things that you can learn yourself, and things you need to do in order to learn. Those are very different things! Skills in the latter category will often be more valuable in the long term because they will be rarer. These are things like building a startup, or managing people, or building some super complicated distributed system that handles 1M messages per second. Things in the former category are things like learning how to build deep neural networks, or coding in Rust, or iOS development. If you truly want to pick up one of those things, don't expect an opportunity to get paid while learning it. Just learn it yourself first.</li>
<li>Read all the time. Just whatever books about technology or business or management. History is great too. Even fiction is great. Also read a million blogs and follow people on Twitter. There's so many smart people out there saying a lot of smart things so that you don't have to figure everything out yourself. Reading a lot helps you build a <em>mental model of the world</em> which will help you later.</li>
<li>It's easy to confuse wanting to learn something with wanting to <em>have learned</em> something. Honestly if you don't enjoy the process of learning a particular thing, you're probably never going to be very good at it. Sorry.</li>
<li>… that being said, just to counter the somewhat cynical tone, I believe most things <em>can</em> be turned into fun learning experience, if you just gamify it for yourself. For instance, work on some projects on the side and mess around with things. If you want to learn Clojure, build a dumb webapp and deploy it to an EC2 instance. Or whatever it is.</li>
<li>Figure out where you want to be on the spectrum that I call <em>tools-oriented vs goal-oriented</em>. The former category is if you are super into deep learning or functional programming or distributed systems or something else and you want to get really deep in the rabbit hole and become and expert. In that case, you're usually better off at a large company where you can truly go deep. On the other side of the spectrum, if the thing that really excites you is to build business value, then go work at a startup.</li>
<li>It's <em>totally fine</em> to spend all your time on something if you want to. Of course, it's great to have a social life and sometimes relax, but it's also OK to go home after work and stay up until 1am hacking on a side project. This could be a wonderful thing if you enjoy it and are learning things.</li>
</ul>
<h2 id="underrated-skills">Underrated skills</h2>
<p>Some things going back I really wish I would have spent more time learning when I was younger:</p>
<ul>
<li>Communication skills. When I moved to the US, I realized I had completely underinvested in my language. I spent the first year reading a ton of novels, underlining words I didn't know and writing their meaning in the margin. I even recorded myself pronouncing things and listened to it. It's not like my English was terrible when I came, but I wish I'd taken it more seriously earlier.</li>
<li>Presentation/sales skills. I massively failed at this for so many years, thinking that all that matters is to solve hard technical problems. I should have spent at least 10% of that energy and time just trying to get senior people across the org excited about the things I was building. Good ideas don't sell themselves.</li>
<li>Self-sufficiency. With that I mean, are you able to deliver business value by building something across the whole stack, without having to rely on other peoples/teams to help you. If you can do this, you can iterate much quicker. But you can also build a prototype of something and demo it. For instance, I recommend for any aspiring data scientist that they set up an AWS account and deploy a web service and learn the whole thing.</li>
<li>Statistics. Seriously, I really wish I had studied more of it in school. Basically goes for <em>anyone</em> in the STEM field, IMO.</li>
</ul>
<h2 id="what-else">What else?</h2>
<ul>
<li>There's a million other things and these are things biased by my own experiences. Don't take my advice too seriously!</li>
<li>The picture at the top was the view from my office a few days ago. No idea what it has to do with the content.</li>
<li>This is getting old, but I really feel sorry about the super low frequency of blog posts last six months. I went through a tricky phase with a newborn kid, running both product and tech at a startup, buying and renovating an apartment, and other random things. But most of those are now behind me!</li>
</ul>
Modeling conversion rates using Weibull and gamma distributions2019-08-05T00:00:00Zhttps://erikbern.com/2019/08/05/modeling-conversion-rates-using-weibull-and-gamma-distributions.html<p><em>This is a blog post originally featured on the <a href="https://better.engineering">Better engineering blog</a>. If you want to link to this article or share it, please go to the <a href="https://better.engineering/2019/07/29/modeling-conversion-rates-and-saving-millions-of-dollars-using-kaplan-meier-and-gamma-distributions/">original post URL</a>! Separately, I'm sorry it's been so long with no posts on this blog. Between kids, moving, and being a startup CTO, I've been busy. I have a few posts coming down the pipe though, so stay tuned…</em></p>
<p>Lots of companies need to analyze conversion rates. Maybe you want to understand how many people purchased a widget out of the people that landed on your website. Or how many people upgraded to a subscription out of the people that created an account. Computing a conversion rate is often fairly straightforward and involves nothing more than dividing two numbers.</p>
<p>So what else is there to say about it? There is one major catch we had to deal with <a href="https://better.com">Better</a>. When there is a <em>substantial delay</em> until the conversion event, this analysis suddenly gets vastly more complex.</p>
<p>To illustrate what I am talking about, we can look at the conversion rate for borrowers coming to Better.com to get a mortgage, defined in the most simplistic way, dividing the number of converted users by the total cohort size:</p>
<p><img src="https://erikbern.com/assets/convoys-blog-post/conversion_rate.png" alt="conversion rate"></p>
<p>This looks really bad: is the conversion rate truly going down over time? But that's not right: it only looks like it is going down because we have given the later users less time to “bake”.</p>
<p>Another line shows how confusing the definition of conversion rate is. Let's look at <em>time until conversion</em> (right y-axis) as a function of the user cohort:</p>
<p><img src="https://erikbern.com/assets/convoys-blog-post/conversion_rate_and_time_to_conversion.png" alt="conversion rate and time to conversion"></p>
<p>Ok, so the conversion rate is going down over time, but users are converting much faster? Clearly, this is a bogus conclusion, and yet again we are looking at it the wrong way.</p>
<p>(Side note, but throughout this blog post, the y scale is intentionally removed in order for us not to share important business metrics.)</p>
<h2 id="the-basic-way-conversion-at-time-t">The basic way: conversion at time T</h2>
<p>There is a few ways we can resolve this. One way is to look at <em>conversion rate at T = 35 days</em>, or some similar cutoff. That way we can compare and see if conversion rates are going up or down:</p>
<p><img src="https://erikbern.com/assets/convoys-blog-post/conversion_rate_at_time_t.png" alt="conversion rate at time t"></p>
<p>Sadly, this also has a pretty severe issue: we can't compute conversion rates for anything more recent than 35 days ago. Back to the drawing board!</p>
<h2 id="why-does-any-of-this-matter">Why does any of this matter?</h2>
<p>It might be worth taking a step back and considering what types of issues this is causing. At Better, we spend a significant amount of money (millions of dollars) on various types of paid user acquisition. This means that we buy leads/clicks from some source, and drive traffic to our website. Some of those are high intent, some of them are low intent. Some of them can take <em>many months to convert.</em> This makes it challenging to answer a seemingly simple question: <em>what's the cost of user acquisition per channel?</em></p>
<p>If we put ourselves in a position where we have to wait many months for us to measure the efficacy of an acquisition channel, that means it takes forever to iterate and improve our acquisition, and it means a lot of money thrown out the window on bad channels. So, let's consider a few better options culminating in a somewhat complex statistical model we built.</p>
<h2 id="introducing-cohort-models">Introducing cohort models</h2>
<p>A much better way is to look at the conversion on a <em>cohorted basis</em>. There is a number of different ways to do this, and I've written a whole <a href="https://erikbern.com/2017/05/23/conversion-rates-you-are-most-likely-computing-them-wrong.html">blog post</a> about this. I'm going to skip a lot of the intermediate steps, and jump straight to what I consider the best next point: using a <a href="https://en.wikipedia.org/wiki/Kaplan%E2%80%93Meier_estimator">Kaplan-Meier estimator</a>. This is a technique developed over 60 years ago in the field of <a href="https://en.wikipedia.org/wiki/Survival_analysis">survival analysis</a>.</p>
<p>Computing a Kaplan-Meier estimator for each weekly cohort generates curves like this</p>
<p><img src="https://erikbern.com/assets/convoys-blog-post/kaplan_meier.png" alt="kaplan meier"></p>
<p>The insight here is to switch from using the x-axis for the time, and instead let <em>each cohort be its own line</em>. These curves help us with a few things:</p>
<ul>
<li>✅ We can compare curves for cohorts that have been “baking” for a long time and curves that just started.</li>
<li>✅ We don't have to throw away information by picking an arbitrary cutoff (such as “conversion at 30 days”).</li>
<li>✅ We can see some early behavior much quicker, by looking at the trajectory of a recent cohort.</li>
</ul>
<p>For a wide variety of survival analysis methods in Python, I recommend the excellent <a href="https://lifelines.readthedocs.io/en/latest/">lifelines</a> package. As a side note, survival analysis is typically concerned with mortality/failure rates, so if you use any off-the-shelf survival analysis tools, your plots are going to be “upside down” from the plots in this post.</p>
<p>Kaplan-Meier also lets us estimate the uncertainty for each cohort, which I think is always best practice when you plot things!</p>
<p><img src="https://erikbern.com/assets/convoys-blog-post/kaplan_meier_with_uncertainty.png" alt="kaplan meier with uncertainty"></p>
<p>The nice thing about Kaplan-Meier is that it lets us operate on <em>censored</em> data. This means that for a given cohort, we're not going to have observations beyond a certain point for certain members of that cohort. Some users may not have converted yet, but may very well convert in the future.</p>
<p>This is most clear if we segment the users by some other property. In the case below I've arbitrarily segmented users by the first letter of their email address. These two groups contain users on a spectrum between:</p>
<ul>
<li>Some users that just came to our site and have essentially no time to convert</li>
<li>Some users that have had plenty of time to convert</li>
</ul>
<p><img src="https://erikbern.com/assets/convoys-blog-post/kaplan_meier_by_email.png" alt="kaplan meier by email"></p>
<p>Dealing with censoring is a huge focus for survival analysis and Kaplan-Meier does that in a formalized way.</p>
<h2 id="so-far-so-good">So far, so good</h2>
<p>Ok, so this is great: we have are now checking lots of the boxes, but IMO not quite all:</p>
<ul>
<li>✅ Can deal with censored data</li>
<li>✅ Can give us uncertainty estimates</li>
<li>❌ Can extrapolate: it would be amazing if we could look at the early shape of a cohort curve and make some statements about what it's going to converge towards.</li>
</ul>
<p>So, let's switch to something slightly more complex: parametric survival models! Take a deep breath, I'm going to walk you through this somewhat technical topic:</p>
<h2 id="parametric-survival-models">Parametric survival models</h2>
<p>I was working on a slightly simpler cohort chart initially, and my first attempt was to fit an <a href="https://en.wikipedia.org/wiki/Exponential_distribution">exponential distribution</a>. The inspiration came from <a href="https://en.wikipedia.org/wiki/Markov_chain#Continuous-time_Markov_chain">continuous-time Markov chains</a> where you can model the conversions as a very simple transition chart:</p>
<p><img src="https://erikbern.com/assets/convoys-blog-post/exponential_markov_chain.png" alt="exponential markov chain"></p>
<p>In the chart above, we can only <em>observe</em> transitions to the <em>converted</em> state. A lack of observation does not necessarily mean no conversion, it means they are <em>either</em> dead, or will convert, but have not converted <em>yet</em>. This transition diagram actually describes a very simple differential equation that we can solve to get the closed form. I will spare you the details in this blog post, but the form of the curve that we are trying to fit is:</p>
<p>$$ F(t) = c\left(1 - e^{-\lambda t}\right) $$</p>
<p>This gives us two unknown parameters for each cohort: $$ c $$ and $$ \lambda $$. The former explains the conversion rate that the cohort converges towards, the latter explains the speed at which it converges. See below for a few examples of hypothetical curves:</p>
<p><img src="https://erikbern.com/assets/convoys-blog-post/exponential_curves.png" alt="exponential curves"></p>
<p>Note that the introduction of the parameter $$ c $$ departs a bit from most of traditional survival analysis literature. Exponential distributions (as well as Weibull and gamma, which we will introduce in a second) are commonplace when you look at failure rates and other phenomena, but in all cases that I encountered so far, there is an assumption that <em>everyone converts eventually</em> (or rather, that everyone dies in the end). This assumption is no longer true when we consider <em>conversions</em>: not everyone converts in the end! That's why we have to add the $$ 0 \leq c \leq 1 $$ parameter</p>
<h2 id="weibull-distributions">Weibull distributions</h2>
<p>It turns out that exponential distributions fit certain types of conversion charts well, but most of the time, the fit is poor. <a href="https://ragulpr.github.io/2016/12/22/WTTE-RNN-Hackless-churn-modeling/">This excellent blog post</a> introduced me to the world of <a href="https://en.wikipedia.org/wiki/Weibull_distribution">Weibull distributions</a>, which are often used to model <em>time to failure</em> or similar phenomena. The Weibull distribution adds one more parameter $$ p > 0 $$ to the exponential distribution:</p>
<p>$$ F(t) = c\left(1 - e^{-(t\lambda)^p}\right) $$</p>
<p>Fitting a Weibull distribution seems to work really well for a lot of cohort curves that we work with at Better. Let's fit one to the dataset we had earlier:</p>
<p><img src="https://erikbern.com/assets/convoys-blog-post/weibull_distribution.png" alt="weibull distribution"></p>
<p>The solid lines are the models we fit, and the dotted lines the Kaplan-Meier estimates. As you can see, these lines coincide very closely. The nice thing about the extrapolated lines is that we can use them to forecast their expected final conversion rate. We can also fit uncertainty estimates to the Weibull distribution just like earlier:</p>
<p><img src="https://erikbern.com/assets/convoys-blog-post/weibull_distribution_with_uncertainty.png" alt="weibull distribution with uncertainty"></p>
<p>The ability to extrapolate isn't just a “nice to have”, but it makes it possible to make assumptions about final conversion rates <em>much earlier,</em> which in turn means our feedback cycle gets tighter and we can learn faster and iterate quicker. Instead of having to wait months to see how a new acquisition channel is performing, we can get an early signal very quickly, and make business decisions faster. This is extremely valuable!</p>
<h2 id="gamma-and-generalized-gamma-distributions">Gamma and generalized gamma distributions</h2>
<p>For certain types of cohort behavior, it turns out that a <a href="https://en.wikipedia.org/wiki/Gamma_distribution">gamma distributions</a> makes more sense. This distribution can be used to model a type of behavior where there is an initial time lag until conversion starts. The <a href="https://en.wikipedia.org/wiki/Generalized_gamma_distribution">generalized gamma distribution</a> combines the best of Weibull and gamma distributions into one single distribution that turns out to model almost any conversion process at Better. Here is one example:</p>
<p><img src="https://erikbern.com/assets/convoys-blog-post/generalized_gamma_distribution.png" alt="generalized gamma distribution"></p>
<p>The generalized gamma conversion model has just four parameters that we need to fit (three coming from the distribution itself, one describing the final conversion rate). Yet, it seems to be an excellent model that fits almost any conversion behavior at Better. See below for a gif where I fit a generalized gamma model to a diverse set of database queries comprising different groups, different milestones, and different time spans:</p>
<p><img src="https://erikbern.com/assets/convoys-blog-post/lots_of_cohorts.gif" alt="lots of cohorts"></p>
<h2 id="introducing-convoys">Introducing convoys</h2>
<p><a href="https://github.com/better/convoys">Convoys</a> is a small Python package to help you fit these models. It implements everything shown above, as well as something which we didn't talk about so far: regression models. The point of regression models is to fit more powerful models that can predict conversion based on a set of features and learn that from historical data. We use these models for a wide range of applications at Better.</p>
<p>Convoys came out of a few different attempt of building the math to fit these models. The basic math is quite straightforward: fit a probability distribution times a “final conversion rate” using <a href="https://en.wikipedia.org/wiki/Maximum_likelihood_estimation">maximum likelihood estimation</a>. We rely on the excellent <a href="https://github.com/HIPS/autograd">autograd</a> package to avoid taking derivatives ourselves (very tedious!) and <a href="https://docs.scipy.org/doc/scipy/reference/optimize.html">scipy.optimize</a> for the actual curve fitting. On top of that, convoys supports estimating uncertainty using <a href="https://emcee.readthedocs.io/en/latest/">emcee</a>.</p>
<p>You can head over the the <a href="https://better.engineering/convoys/">documentation</a> if you want to read more about the package. Just to mention a few of the more interesting points of developing convoys:</p>
<ul>
<li>For a while, convoys relied on Tensorflow, but it turned out it made the code more complex and wasn't worth it.</li>
<li>To fit gamma distributions, we rely a lot on the <a href="https://docs.scipy.org/doc/scipy/reference/generated/scipy.special.gammainc.html">lower regularized incomplete gamma function</a>. This function has a <a href="https://github.com/tensorflow/tensorflow/issues/17995">bug in Tensorflow</a> where the derivative is incorrect, and it's not supported in autograd. After a lot of banging my head against the wall, I added a simple numerical approximation. Cam Davidson-Pilon (author of lifelines mentioned earlier) later ran into the exact same issue and made a <a href="https://github.com/CamDavidsonPilon/autograd-gamma">small Python package</a> that we're now using.</li>
<li>In order to regularize the models, I have found it useful to put very mild priors on the variance of some of the parameters using an inverse gamma distribution. This ends up stabilizing many of the curves fit in practice, while introducing a very mild bias.</li>
<li>When fitting a regression model, we have separate parameters $$ c_i $$ and $$ \lambda_i $$ for each feature, but shared $$ k $$ and $$ p $$ parameters for the generalized gamma distribution. This is a fairly mild assumption in real world cases and reduces the number of parameters by a lot.</li>
</ul>
<p>Convoys is semi-experimental and the SDK might change very quickly in the future, but we believe it has a quite wide range of applications, so definitely check it out if you are working on similar problems!</p>
<h2 id="finally">Finally…</h2>
<p>We are hiring! If you're interested in these types of problems, definitely <a href="https://boards.greenhouse.io/better/jobs/1424243">let us know</a>! We have a small but quickly growing team in of data engineers/scientists in New York City who are working on many of these types of problems on a daily basis.</p>
Why software projects take longer than you think: a statistical model2019-04-15T00:00:00Zhttps://erikbern.com/2019/04/15/why-software-projects-take-longer-than-you-think-a-statistical-model.html<p>Anyone who built software for a while knows that estimating how long something is going to take is <em>hard</em>.
It's hard to come up with an unbiased estimate of how long something will take, when fundamentally the work in itself is about <em>solving</em> something.
One pet theory I've had for a really long time, is that some of this is really just a statistical artifact.</p>
<blockquote class="twitter-tweet"><p lang="en" dir="ltr">I suspect devs are actually decent at estimating the *median* time to complete a task. Planning is hard because they suck at the *average*.</p>— Erik Bernhardsson (@bernhardsson) <a href="https://twitter.com/bernhardsson/status/862791164759617536?ref_src=twsrc%5Etfw">May 11, 2017</a></blockquote>
<script async src="https://platform.twitter.com/widgets.js" charset="utf-8"></script>
<p>Let's say you estimate a project to take 1 week. Let's say there are three equally likely outcomes: either it takes 1/2 week, or 1 week, or 2 weeks. The <em>median</em> outcome is actually the same as the estimate: 1 week, but the <em>mean</em> (aka <em>average</em>, aka <em>expected value</em>) is 7/6 = 1.17 weeks. The estimate is actually calibrated (unbiased) for the median (which is 1), but not for the the mean.</p>
<p>A reasonable model for the “blowup factor” (actual time divided by estimated time) would be something like a <a href="https://en.wikipedia.org/wiki/Log-normal_distribution">log-normal distribution</a>. If the estimate is one week, then let's model the real outcome as a random variable distributed according to the log-normal distribution around one week. This has the property that the median of the distribution is exactly one week, but the mean is much larger:</p>
<p><img src="https://erikbern.com/assets/software-estimation/log_normal.png" alt="log normal"></p>
<p>If we take the logarithm of the blowup factor, we end up with a plain old normal distribution centered around 0. This assumes the median blowup factor is 1x, and as you hopefully remember, log(1) = 0. However, different tasks may have different uncertainties around 0. We can model this by varying the σ parameter which corresponds to the standard deviation of the normal distribution:</p>
<p><img src="https://erikbern.com/assets/software-estimation/normal.png" alt="normal"></p>
<p>Just to put some numbers on this: when log(actual / estimated) = 1 then the blowup factor is exp(1) = e = 2.72. It's equally likely that a project blows up by a factor of exp(2) = 7.4 as it is that it completes in exp(-2) = 0.14 i.e. completes in 14% of the estimated time. Intuitively the reason the mean is so large is that tasks that complete faster than estimated have no way to compensate for the tasks that take much longer than estimated. We're bounded by 0, but unbounded in the other direction.</p>
<p>Is this just a model? You bet! But I'll get to real data shortly and show that this in fact maps to reality reasonably well using some empirical data.</p>
<h2 id="software-estimation">Software estimation</h2>
<p>So far so good, but let's really try to understand what this means in terms of software estimation. Let's say we look at the roadmap and it consists of 20 different software projects and we're trying to estimate: how long is it going to take to complete <em>all of them</em>.</p>
<p>Here's where the the mean becomes crucial. Means add, but medians do not. So if we want to get an idea of how long it will take to complete the sum of n projects, we need to look at the mean. Let's say we have three different projects in the pipeline with the exact same σ = 1:</p>
<table>
<thead>
<tr>
<th align="center"></th>
<th align="right">Median</th>
<th align="right">Mean</th>
<th align="right">99%</th>
</tr>
</thead>
<tbody>
<tr>
<td align="center">Task A</td>
<td align="right">1.00</td>
<td align="right">1.65</td>
<td align="right">10.24</td>
</tr>
<tr>
<td align="center">Task B</td>
<td align="right">1.00</td>
<td align="right">1.65</td>
<td align="right">10.24</td>
</tr>
<tr>
<td align="center">Task C</td>
<td align="right">1.00</td>
<td align="right">1.65</td>
<td align="right">10.24</td>
</tr>
<tr>
<td align="center">SUM</td>
<td align="right">3.98</td>
<td align="right">4.95</td>
<td align="right">18.85</td>
</tr>
</tbody>
</table>
<p>Note that the means add up and 4.95 = 1.65*3, but the other columns don't.</p>
<p>Now, let's add up three projects with different sigmas:</p>
<table>
<thead>
<tr>
<th align="center"></th>
<th align="right">Median</th>
<th align="right">Mean</th>
<th align="right">99%</th>
</tr>
</thead>
<tbody>
<tr>
<td align="center">Task A (σ = 0.5)</td>
<td align="right">1.00</td>
<td align="right">1.13</td>
<td align="right">3.20</td>
</tr>
<tr>
<td align="center">Task B (σ = 1)</td>
<td align="right">1.00</td>
<td align="right">1.65</td>
<td align="right">10.24</td>
</tr>
<tr>
<td align="center">Task C (σ = 2)</td>
<td align="right">1.00</td>
<td align="right">7.39</td>
<td align="right">104.87</td>
</tr>
<tr>
<td align="center">SUM</td>
<td align="right">4.00</td>
<td align="right">10.18</td>
<td align="right">107.99</td>
</tr>
</tbody>
</table>
<p>The means still add up, but are nowhere near the naïve 3 week estimate you might come up with. Note that the high-uncertainty project with σ=2 basically ends up <em>dominating</em> the mean time to completion. For the 99% percentile, it doesn't just dominate it, it basically absorbs all the other ones. We can do a bigger example:</p>
<table>
<thead>
<tr>
<th align="center"></th>
<th align="right">Median</th>
<th align="right">Mean</th>
<th align="right">99%</th>
</tr>
</thead>
<tbody>
<tr>
<td align="center">Task A (σ = 0.5)</td>
<td align="right">1.00</td>
<td align="right">1.13</td>
<td align="right">3.20</td>
</tr>
<tr>
<td align="center">Task B (σ = 0.5)</td>
<td align="right">1.00</td>
<td align="right">1.13</td>
<td align="right">3.20</td>
</tr>
<tr>
<td align="center">Task C (σ = 0.5)</td>
<td align="right">1.00</td>
<td align="right">1.13</td>
<td align="right">3.20</td>
</tr>
<tr>
<td align="center">Task D (σ = 1)</td>
<td align="right">1.00</td>
<td align="right">1.65</td>
<td align="right">10.24</td>
</tr>
<tr>
<td align="center">Task E (σ = 1)</td>
<td align="right">1.00</td>
<td align="right">1.65</td>
<td align="right">10.24</td>
</tr>
<tr>
<td align="center">Task F (σ = 1)</td>
<td align="right">1.00</td>
<td align="right">1.65</td>
<td align="right">10.24</td>
</tr>
<tr>
<td align="center">Task G (σ = 2)</td>
<td align="right">1.00</td>
<td align="right">7.39</td>
<td align="right">104.87</td>
</tr>
<tr>
<td align="center">SUM</td>
<td align="right">9.74</td>
<td align="right">15.71</td>
<td align="right">112.65</td>
</tr>
</tbody>
</table>
<p>Again, one single misbehaving task basically ends up dominating the calculation, at least for the 99% case. Even for mean though, the one freak project ends up taking over roughly half the time spend on these tasks, despite all of these tasks having a similar median time to completion. To make it simple, I assumed that all tasks have the same estimated size, but different uncertainties. The same math applies if we vary the size as well.</p>
<p>Funny thing is I've had this gut feeling for a while. Adding up estimates rarely work when you end up with more than a few tasks. Instead, figure out which tasks have the highest uncertainty – those tasks are basically going to dominate the mean time to completion.</p>
<blockquote class="twitter-tweet"><p lang="en" dir="ltr">I have two methods for estimating project size:<br>(a) break things down into subprojects, estimate them, add it up<br>(b) gut feeling estimate based on how nervous i feel about unexpected risks<br>So far (b) is vastly more accurate for any project more than a few weeks</p>— Erik Bernhardsson (@bernhardsson) <a href="https://twitter.com/bernhardsson/status/1103871565685391360?ref_src=twsrc%5Etfw">March 8, 2019</a></blockquote>
<script async src="https://platform.twitter.com/widgets.js" charset="utf-8"></script>
<p>A chart summarizes the mean and 99th percentile as a function of the uncertainty (σ):</p>
<p><img src="https://erikbern.com/assets/software-estimation/sigmas.png" alt="sigmas"></p>
<p>There is math to this now! I've started appreciating this during project planning: I truly think that adding up task estimates is a really misleading picture of how long something will take, because you have these crazy skewed tasks that will end up taking over.</p>
<h2 id="wheres-the-empirical-data">Where's the empirical data?</h2>
<p>I filed this in my brain under “curious toy models” for a long time, occasionally thinking that it's a neat illustration of a real world phenomenon I've observed. But surfing around on the interwebs one day, I encountered an interesting dataset of <a href="https://github.com/Derek-Jones/SiP_dataset">project estimation and actual times</a>. Fantastic!</p>
<p>Let's do a quick scatter plot of estimated vs actual time to completion:</p>
<p><img src="https://erikbern.com/assets/software-estimation/scatter.png" alt="scatter"></p>
<p>The median blowup factor turns out to be <em>exactly</em> 1x for this dataset, whereas the mean blowup factor is 1.81x. Again, this confirms the hunch that developers estimate the <em>median</em> well, but the mean ends up being much higher.</p>
<p>Let's look at the distribution of the blowup factor. We're going to look at the logarithm of it:</p>
<p><img src="https://erikbern.com/assets/software-estimation/distribution.png" alt="distribution"></p>
<p>You can see that it's pretty well centered around 0, where the blowup factor is exp(0) = 1.</p>
<h2 id="lets-go-grab-the-statistics-toolbox">Let's go grab the statistics toolbox</h2>
<p>I'm going to get a bit fancy with statistics now – feel free to skip if it's not your cup of tea. What can we infer from this empirical distribution? You might expect that the logarithms of the blowup factor would distribute according to a normal distribution, but that's not quite true.
Note that the σs are themselves random and vary for each project.</p>
<p>One convenient way to model the σs is that they are sampled from an <a href="https://en.wikipedia.org/wiki/Inverse-gamma_distribution">inverse Gamma distribution</a>. If we assume (like previously) that the log of the blowup factors are distributed according to a normal distribution, then the “global” distribution of the logs of blowup factors ends up being <a href="https://en.wikipedia.org/wiki/Student%27s_t-distribution">Student's t-distribution</a>.</p>
<p>Let's fit a Student's t-distribution to the distribution above:</p>
<p><img src="https://erikbern.com/assets/software-estimation/distribution_plus_t.png" alt="distribution"></p>
<p>Decent fit, in my opinion! The parameters of the t-distribution also define the inverse Gamma distribution of the σ values:</p>
<p><img src="https://erikbern.com/assets/software-estimation/sigma_distribution.png" alt="sigma distribution"></p>
<p>Note that values like σ > 4 are incredibly unlikely, but when they happen, they cause a mean blowup of several thousand times.</p>
<h2 id="why-software-tasks-always-take-longer-than-you-think">Why software tasks always take longer than you think</h2>
<p>Assuming this dataset is representative of software development (questionable!), we can infer some more numbers. We have the parameters for the t-distribution, so we can compute the mean time it takes to complete a task, without knowing the σ for that task is.</p>
<p>While the median blowup factor imputed from this fit is 1x (as before), the 99% percentile blowup factor is 32x, but if you go to 99.99% percentile, it's a whopping 55 <em>million</em>! One (hand wavy) interpretation is that some tasks end up being essentially impossible to do. In fact, these extreme edge cases have such an outsize impact on the <em>mean</em>, that the mean blowup factor of <em>any task</em> ends up being <em>infinite</em>. This is pretty bad news for people trying to hit deadlines!</p>
<h2 id="summary">Summary</h2>
<p>If my model is right (a big <em>if</em>) then here's what we can learn:</p>
<ul>
<li>People estimate the <em>median</em> completion time well, but not the mean.</li>
<li>The mean turns out to be substantially worse than the median, due to the distribution being skewed (log-normally).</li>
<li>When you add up the estimates for n tasks, things get even worse.</li>
<li>Tasks with the most uncertainty (rather the biggest size) can often dominate the mean time it takes to complete all tasks.</li>
<li>The mean time to complete a task we know nothing about is actually <em>infinite</em>.</li>
</ul>
<h2 id="notes">Notes</h2>
<ul>
<li>This is obviously just based on one dataset I found online. Other datasets may give different results.</li>
<li>My model is of course also highly subjective, like any statistical model.</li>
<li>I would ❤️ to apply the model to a much larger data set to see how well it holds up.</li>
<li>I assumed all tasks independent. In reality they might have a correlation which would make the analysis a lot more annoying but (I think) ultimately with similar conclusions.</li>
<li>The sum of log-normally distributed value is not another log-normally distributed value. This is a weakness with that distribution, since you could argue most tasks is really just a sum of sub-tasks and it would be nice if our distribution was <a href="https://en.wikipedia.org/wiki/Stable_distribution">stable</a> like that.</li>
<li>I removed small tasks (estimated time less than or equal to 7 hours) from the histogram since small tasks skew the analysis and there there was an odd spike at exactly 7.</li>
<li>The <a href="https://github.com/erikbern/software-estimation">code is on my Github</a>, as usual.</li>
<li>There's some discussion <a href="https://news.ycombinator.com/item?id=19671673">on Hacker News</a> and <a href="https://www.reddit.com/r/programming/comments/bdrmm6/why_software_projects_take_longer_than_you_think/">on Reddit</a>.</li>
</ul>
Headcount goals, feature factories, and when to hire those mythical 10x people2019-02-21T00:00:00Zhttps://erikbern.com/2019/02/21/headcount-targets-feature-factories-and-when-to-hire-those-mythical-10x-people.html<p>When I started building up a tech team for <a href="https://better.com">Better</a>, I made a very conscious decision to pay at the high end to get people. I thought this made more sense: they cost a bit more money to hire, but output usually more than compensates for it. Many fellow CTOs, some went for the other side of the spectrum. This was a mystery to me, until it all made sense to me.</p>
<h2 id="what-is-output">What is output?</h2>
<p>Before we get started, let me clarify what I mean by “output” or “productivity”. I don't mean an engineer just hammering on the keyboard shipping code at light speed. When I talk about it, I refer to a whole range of things, like helping your coworkers, introducing new frameworks, improving the process, and much more. I've <a href="/2016/01/08/i-believe-in-the-10x-engineer-but.html">written about this</a> in the past.</p>
<p>You can't really measure it, of course. But all managers try, when they set the salary of Alice to $110,000 and Bob to $115,000. So on some level, managers certainly believe they have <em>some</em> precise idea of the relative value of each engineer.</p>
<h2 id="headcount-goals">Headcount goals</h2>
<p>Let's dissect an classic management objective: headcount goals. In a typical engineering hiring process, a CTO (or high up person) figures out roughly how much they need to get done compared to how many engineers they have, then goes to the CFO and haggles a bit, then gets assigned a headcount number and a salary range for those people. That then gets distributed across the org recursively, and every hiring manager gets a target for how many people to hire.</p>
<p>Let's say the CTO is absolutely adamant that they need to grow the engineering team by 2x in a year. This bubbles down to a junior engineering manager. If you are running a decentralized interview process, then you know create a <em>great</em> agency problem where the junior manager is told their success at the company is partly measured by how well they reach their hiring goal. Of course they are going to lower their bar for who they hire!</p>
<p>Don't think this happens? I've <em>seen it</em>. I've seen how recruiting bars start slipping because of well-meaning people pushing for more resources. And how over time the average level of engineering talent slowly declines.</p>
<h2 id="solving-the-misalignment">Solving the misalignment</h2>
<p>The right solution to this is partly to make the interview process and decision <em>centralized</em>. No team should impose their own hiring standards because with aggressive headcount goals, everyone on that team will be incentivized to lower the bar.</p>
<p>But let's also on more fundamental level: <em>why headcount goals?</em> This makes the underlying assumption that every engineer has roughly the same productivity. In reality, engineer productivity can be very dispersed.</p>
<p>So why not target a certain output level? Of course it's because engineers don't come with labels that say this one is a 2.3x engineer that costs $140,000 and that other one is a 4.5x that costs $180,000. You don't know! Let's first talk about this relationship though because I think it's important to understand.</p>
<h2 id="cost-as-a-function-of-productivity">Cost as a function of productivity</h2>
<p>What's maybe surprising is that cost as function of productivity seems to be a sub-linear function. A 3x or 4x engineer might cost say 2x more. This is clearly not a law imposed by physics that fits a straight line, but I think most people who have done some serious recruiting would concede that it follows something slightly less than linear.</p>
<p>For instance, let's say the cost of a $$k$$x engineer is $$k^{0.6}$$. So for a 2x engineer we pay 1.5x more and for a 10x engineer we pay 4x more. The choice of the exponent is a bit arbitrary here, but the point is to reflect that the cost scales <em>less than lineary</em>. Any exponent less than 1 works for the purpose of this argument, and note that an exponent larger than 1 would not exist in an efficient market. No one would hire a 2x engineer at 2.1x the cost – they would simply hire 2 1x engineers.</p>
<p><img src="https://erikbern.com/assets/kx-engineer-cost.png" alt="kx engineer"></p>
<p>This seems like a no-brainer then. Why wouldn't everyone pay a ton more money to hire the most senior engineers? Let's throw headcount targets out the window and replace with <em>total output target</em> Maybe we should even go as far as having a <em>total salary dollar target</em>, rather than headcount? Besides the challenge of convincing your CFO of this, it probably misaligns incentives even more.</p>
<p>Headcount targets usually come with salary bands that you agree on beforehand. This is another weird constraint if you think about it – if more expensive engineers have a higher ROI then why cap the cost (and thus the productivity)?</p>
<p>These are things that I've been struggling to understand. It turns out, you can formalize a simple model where it's rational to hire two 1x engineers instead of a 2x engineer even if the total cost is higher.</p>
<h2 id="feature-factories-and-task-overhead">Feature factories and task overhead</h2>
<p>There's one common argument for hiring “cheaper” engineering talent which is that a ton of tasks are straightforward, unsexy, or boring. Maybe an entry-level engineer doesn't mind tweaking WordPress themes all day, but a senior engineer need more challenges. At the extreme end of this spectrum is a type of company often derided as a <em>feature factory</em>, where I suspect people imagine a sweat shop of super inexperienced engineers basically updating forms in HTML or adding tracking pixels.</p>
<p>I'm pretty unconvinced by argument. A senior person will find opportunities to automate and reduce repetitive parts, paying for themselves.</p>
<p>However, there's a slight variant of this idea that I think actually does justify hiring less experienced engineers, which has to do with <em>task overhead.</em> Let's consider a toy model:</p>
<p>Let's say we have two engineers, one called Norm the normal engineer and one Twanda the 2x engineer. Let's say they both work at a company where Norm spends 50% of his time <em>actually</em> working, with the rest of the time lost as “task overhead”. Maybe a bunch of bookkeeping (going into Jira, creating Github pull requests, waiting for CI etc). This is overhead that have to happen for <em>every task</em>.</p>
<p><img src="https://erikbern.com/assets/2x-engineer.png" alt="2x engineer"></p>
<p>How much more productive is Twanda compared to Norm? 2x? No! Twanda generates 4/3 as much value! And in general, if a 1x engineer spends $$ c $$ of their time on “task overhead” items, then a $$ k $$x engineer will have output factor $$ 1 / (c/k + 1-c) $$.</p>
<p>Note that spending time in meetings doesn't have the same impact. In a hypothetical company where 90% of all time is being spent in meetings, a 2x faster engineer would still get 2x more work done (in the 10% of time that isn't spent in meetings). What my model is talking about is <em>task-related overhead</em>.</p>
<p>You can see in this toy model that a lot of the productivity gains of a higher-output engineer will be diminished in an environment with high task overhead. You really benefit a lot more from more productive people if you minimize the amount of task overhead!</p>
<h2 id="the-cost-benefit-analysis-of-high-output-engineers">The cost-benefit analysis of high output engineers</h2>
<p>Now we have a bunch of the assumptions that lets us calculate the <em>output per cost</em> of a $$k$$x engineer. We know the output factor $$ 1/(c/k + 1-c) $$ and the cost $$ k^{0.6} $$ so the <em>output per cost</em> is:</p>
<p>$$ \frac{1}{(c/k + 1-c)k^{0.6}} $$</p>
<p>For any given value of $$ c $$, we can solve for the optimal value for $$ k $$! Take the derivative with respect to $$ k $$ set it to zero.
Because I'm a lazy person, I just <a href="https://www.wolframalpha.com/input/?i=solve+D%5B1%2F((c%2Fx%2B1-c)*x%5E0.6),+x%5D">plugged it into Wolfram Alpha</a> and the optimal value of $$ k $$ as a function of $$ c $$ turns out to be</p>
<p>$$ k = \frac{2}{3}\frac{c}{1-c} $$</p>
<p>Let's plot the optimal value of $$ k $$ with respect to $$ c $$. I had to plot it on the log-scale for the shape to come out nicely:</p>
<p><img src="https://erikbern.com/assets/kx-engineer-productivity.png" alt="kx engineer"></p>
<p>Beautiful! Let's unpack this by picking a few points on the chart:</p>
<ul>
<li>Extreme case: if the overhead is 100% then the best value for money is to hire 0x engineers.</li>
<li>If the overhead is about 80% then the best value for money is to hire 0.2x engineers.</li>
<li>If the overhead is about 40% then the best value for money is to hire 1x engineers.</li>
<li>If the overhead is about 20% then the best value for money is to hire 3x engineers.</li>
<li>If the overhead is about 7% then the best value for money is to hire 10x engineers.</li>
<li>Extreme case: if the overhead is 0% then the best value for money is to hire ∞x engineers.</li>
</ul>
<p>So it's all about getting the overhead of work down.</p>
<h2 id="getting-the-most-value-out-of-your-tech-team">Getting the most value out of your tech team</h2>
<p>We talked a lot about the difference between engineers in terms of productivity vs cost and how to get the most value of them. The good news is that there's really only two things that it boils down to!</p>
<ol>
<li>Have a centralized recruiting process with a consistent high bar</li>
<li>Reduce the task overhead to a minimum</li>
</ol>
<p>If you don't have those things, there's no point trying to hire super senior people: and in particular you are probably <em>better off hiring average engineers.</em> <a href="https://medium.com/@xamat/cultural-overfitting-and-underfitting-or-why-the-netflix-culture-wont-work-in-your-company-af2a62e41288">Xavier Amatriain wrote a blog post</a> with sort of similar conclusions: don't expect that you can cherry-pick elements of the Netflix culture and drop it into your startup. You might have to start with your development process and your hiring process!</p>
<p>If you had asked me before I wrote this blog post why some companies pay top dollars for engineers and other don't, I probably would have said that some companies are super tech focused, and so they can truly get value out of really expensive engineers, whereas some companies are a collection of scripts using some off-the-shelf framework, and an expensive engineer wouldn't make a huge difference.</p>
<p>I still think this is right, but I think the exact causality has to do more with the model posited in this post. As an example, Google (known for paying much) have types of challenges that engineers can work independently for a very long time. That lowers the (amortized) task overhead, which means that they get more value out of an expensive (but more productive) engineer. Other companies have a large quantity of small projects (thus a large task overhead) meaning they rationally shouldn't pay at the top of the market.</p>
<p>This all definitely strikes me as kind of “obvious” in hindsight, and maybe you feel the same. At least you know have some math to back it up!</p>
Data architecture vs backend architecture2019-01-10T00:00:00Zhttps://erikbern.com/2019/01/10/data-architecture-vs-backend-architecture.html<p><img src="https://erikbern.com/assets/refinery.jpeg" alt="refinery"></p>
<p>A modern tech stack typically involves at least a frontend and backend but relatively quickly also grows to include a data platform. This typically grows out of the need for ad-hoc analysis and reporting but possibly evolves into a whole oil refinery of cronjobs, dashboards, bulk data copying, and much more. What generally pushes things into the data platform is (generally) that a number of things are</p>
<ul>
<li>Not latency critical so can run much later, maybe up to 24h (as opposed to reactive synchronous jobs sitting on a request-response cycle)</li>
<li>Easier to express as batch job operating on a large dataset rather than operating on each request</li>
</ul>
<p>Reporting is a decent example. Let's say you need to import all transactions into your accounting system. Rather than doing it directly from the backend, it might be a lot easier to just write a script to do it every 24h.</p>
<p>Training machine learning models is another example. Let's say you are building a fraud detection system and you have a machine learning model to detect if some user action is fradulent. Training the model might take an hour but predictions are quick. It's much easier to re-train the model say every 24h or even every week or month. You can then serialize the model and use that for predictions in your backend system.</p>
<p>At Spotify the data platform started with royalty reporting, but quickly rebuilt the toplists to be a nightly data job. The data platform kept growing, in particular the music recommendation system, which became a humongous data pipeline. We retrained the core models every few weeks but typically regenerated personalized recommendations every night. That was frequent enough that people wouldn't run out of recommendations.</p>
<h2 id="why-bother">Why bother?</h2>
<p>Why bother with a data platform? Because things typically get 10x easier to build and ship. Pushing work out of the backend into a separate data platform helps with a few things:</p>
<ul>
<li>You don't have to worry about latency.</li>
<li>You can control the flow yourself (rather than being at the mercy of a user request waiting for a response)</li>
<li>You can generally write things in a much more fault tolerant way (batch processing is often easier to write as a set of idempotent operations)</li>
<li>Batch processing can be a lot more efficient (generating music recommendations for 1,000,000 users is maybe only 1,000 times more work than generating for 1 user)</li>
<li>If things fail, it's not the end of the world, since you often fix the bug within the next day or so and just re-run the job</li>
</ul>
<p>For instance, consider the basic feature of building a global toplist that updates itself in real time, say showing the top news articles on a news website. I'm willing to bet a substantial amount of money that it's orders of magnitude harder to do this purely in the backend compared to building a cron job in the data platform that updates it every hour or every day and pushes the result back into the backend.</p>
<h2 id="so-you-do-you-do-it-in-the-least-hacky-way">So you do you do it (in the least hacky way)?</h2>
<p>Of course, backend architecture is a bit more mature, and there's about 1,000 blog posts about best practices. <a href="https://martinfowler.com/bliki/">Martin Fowler</a> is one that comes to mind for instance. When we're building backend systems, we've been taught things like:</p>
<ul>
<li>Avoid integration databases (each system should have its own database, and two systems can never touch the same database)</li>
<li>Database queries should be simple (typically refer to an exact key and joining as few tables as possible, ideally zero)</li>
<li>Use transactions (and constraints/keys/etc) for data integrity</li>
<li>Lots of unit tests</li>
<li>Lots of integration tests</li>
<li>Decompose larger services (aka “monoliths”) into smaller ones (aka “microservices”)</li>
</ul>
<p>… aaaaanyway, you can throw all/most of this out the window when you go to the data platform!</p>
<p><img src="https://erikbern.com/assets/defenestration.jpeg" alt="defenestration"></p>
<p><em>Oil painting featuring the defenestration of Prague (1618)</em></p>
<h1 id="the-data-side-the-wild-west">The data side: the wild west</h1>
<p>What I've seen in terms of infrastructure is typically one of these things as a starting point:</p>
<ol>
<li>Backend logs are shipped to some data store</li>
<li>Backend production databases are dumped to some data store</li>
</ol>
<p>Back in the days, this data store was typically Hadoop (HDFS) although these days it's often some scalable database such as Redshift. There's lots of different solutions and I'm not here to opine on any of them.</p>
<p><img src="https://erikbern.com/assets/data-architecture.png" alt="a typical data architecture"></p>
<h2 id="notes-on-data-latency">Notes on data latency</h2>
<p>Anything in the data platform is typically delayed (at Spotify typically up to 24h or even more). If it's not delayed, then it should be considered delayed, meaning anything operating on the data should not be latency critical.</p>
<p>Can you have a data platform that operates on real-time database data rather than a delayed database dump? Yes, in theory. But I think it can encourage really bad practices. For instance if you have cron jobs operating on the production database, then it's easy to do things like <em>writing data back to the database</em> which now creates an integration database with multiple writers and consumers of the same table. This can be a mess! For this reason, the right separation should be that (a) cron jobs operate on delayed data (b) any communication back to the backend system happens through internal endpoints.</p>
<p>And another word of caution: <em>don't give business people access to real-time data!</em> They will start to demand it for everything and you will have to support it forever.</p>
<p>Anyway, what happens on the data side? In my experience, and in my opinion, <em>anything goes.</em> Let's talk about some of those things:</p>
<h2 id="integration-databases">Integration databases</h2>
<p>For instance, the traditional constraint that services should not touch each other's databases and that those layers should be respected. This avoids the so called “integration database” antipattern where you have multiple writers and readers of the same data. In the data world, that rule goes out the window. On the data side, I find it completely kosher to join across 3 different dataset from different services. Why is this acceptable? I think it boils down to two things</p>
<ol>
<li>Schema changes that break any downstream consumers are not the end of the world. You are going to have to update some queries, that's it.</li>
<li>If things break, then you can typically fix it and re-run the job. If some report isn't generated at midnight UTC, you can fix the job in the next few hours and few will complain.</li>
<li>All queries are read-only. That means you never have to worry about transaction integrity, or reading inconsistent data.</li>
</ol>
<p>My conclusions is that integration databases are terrible for backend systems but great and fun in the data layer.</p>
<h2 id="mega-queries">Mega queries</h2>
<p>A backend system will have to deal with low-latency low-throughput queries, that usually touch only one user at a time. But that user is making a request and waiting for a response, so queries need to be <em>fast</em>. So how do you make queries fast?</p>
<ol>
<li>Avoid as many joins as possible. When needed, stick to very simple, indexed joins (typically left join from table A to B)</li>
<li>Every query should refer do a particular item id, eg. <code>... where user_id = 234</code> or similar.</li>
</ol>
<p>I get incredibly suspicious any time I see any queries in a backend system that are more complex than a couple of tables and one or two <code>where</code> conditions.</p>
<p>In the data world, those things don't matter at all. Almost all queries are going to cut “across” all/most of the data, and in fact most queries will boil down to “full table scans”. Queries spanning pages looking like they were written by a early 20th century German philosopher? Bring it on!</p>
<p>This is basically the difference between OLTP and OLAP which are different types of query pattern. There's probably lots of literature if you're willing to go deep!</p>
<h2 id="testing">Testing</h2>
<p>I'm writing this somewhat apologetically, maybe with a sense of guilt as I'm admitting some dark secret. I'm a big proponent of very thorough testing, but getting any reasonable amount of test coverage on the data side is… hard.</p>
<p>For a backend system, you're sort of implementing functions like $$ y = f(x) $$ where $$ x $$ is an input (say a response from a 3rd party API) and $$ y $$ is the result (say, the API response transformed to an internal representation). That's really easy to test! Sometimes you have functions like $$ S_{n+1} = f(S_n, A) $$ where $$ S_{i} $$ is the “state” and $$ A $$ is some action. But the state and the action is super tiny and can be reasonably well represented inside a unit test.</p>
<p>On the data side, the $$ x $$ and $$ S_i $$ are <em>huge</em>. This means any unit test basically ends up being 99% just setting up all the input data. But because the input data is super high dimensional, it also means modeling edge cases becomes exponentially harder. The just to throw a wrench into this, data pipelines can often be nondeterministic (machine learning models) or have very subjective outputs to the point where you can't just write up a bunch of assertions easily. For all these reasons, I've found that tests for data pipelines have pretty low fidelity (they catch few bugs) and have high maintenance costs. Sad! I like to have a few basic tests to make sure things <em>run</em>, but verifying correctness might not always be worth it.</p>
<h2 id="conclusion">Conclusion</h2>
<p>I've found it useful to push <em>as much as you can</em> out of the backend into the data platform. This includes lots of things like</p>
<ul>
<li>Sending (non-transactional) emails to users (like personalized marketing emails)</li>
<li>Generating search indexes</li>
<li>Generating recommendations</li>
<li>Reporting</li>
<li>Generating data for business people</li>
<li>Training machine learning models</li>
</ul>
<p>All of those things <em>could</em> be built into the backend system, but should probably be run as cronjobs in a data platform instead. This will reduce the complexity of your code by (roughly) an order of magnitude.</p>
<h1 id="side-note">Side note</h1>
<p>I just wanted to mention it's been three months since my last blog post. I'm sorry! My second daughter was born in November and life has been pretty busy (but fun!). It didn't help that my last two posts both hit Hacker News front page, putting the bar really high. I have a bunch of low key posts in my head I'm planning to post in the next couple of months. Keep an eye out!</p>
The hacker's guide to uncertainty estimates2018-10-08T00:00:00Zhttps://erikbern.com/2018/10/08/the-hackers-guide-to-uncertainty-estimates.html<p>It started with a tweet:</p>
<blockquote class="twitter-tweet"><p lang="en" dir="ltr">New years resolution: every plot I make during 2018 will contain uncertainty estimates</p>— Erik Bernhardsson (@bernhardsson) <a href="https://twitter.com/bernhardsson/status/950065836194066433?ref_src=twsrc%5Etfw">January 7, 2018</a></blockquote>
<script async src="https://platform.twitter.com/widgets.js" charset="utf-8"></script>
<p>Why? Because I've been sitting in 100,000,000 meetings where people endlessly debate whether the monthly number of widgets is going up or down, or whether widget method X is more productive than widget method Y. For almost any graph, quantifying the uncertainty seems useful, so I started trying. A few months later:</p>
<blockquote class="twitter-tweet"><p lang="en" dir="ltr">I'm four months into this year and I gotta tell you – the rabbit hole of estimating uncertainty is DEEP <a href="https://t.co/wvSlsYskrt">https://t.co/wvSlsYskrt</a></p>— Erik Bernhardsson (@bernhardsson) <a href="https://twitter.com/bernhardsson/status/995359796302876674?ref_src=twsrc%5Etfw">May 12, 2018</a></blockquote>
<script async src="https://platform.twitter.com/widgets.js" charset="utf-8"></script>
<p>I never studied statistics and learned it kind of “backwards” through machine learning, so I consider myself more as a hacker who picked up statistics along the way. Earlier this year I had some basic knowledge of bootstrapping and confidence intervals, but along the way I had to pick up a whole arsenal of tricks going all the way to Monte Carlo methods and inverse Hessians. It seemed useful to share some of the methods I've used the most, so I wrote this post!</p>
<p><em>Note: this post features some math which might not render properly outside the <a href="https://erikbern.com/2018/10/08/the-hackers-guide-to-uncertainty-estimates.html">canonical location</a> of the post.</em></p>
<h1 id="lets-get-started">Let's get started</h1>
<p>I don't believe in learning things without a concrete example, so let's generate some data. We're going to generate a fake time series where the dates range from 2017-07-01 to 2018-07-31. Let's say the observations are all the weights of an elephant.</p>
<div class="highlight"><pre style="color:#f8f8f2;background-color:#272822;-moz-tab-size:4;-o-tab-size:4;tab-size:4"><code class="language-python" data-lang="python"><span style="color:#66d9ef">def</span> <span style="color:#a6e22e">generate_time_series</span>(k<span style="color:#f92672">=</span><span style="color:#ae81ff">200</span>, m<span style="color:#f92672">=</span><span style="color:#ae81ff">1000</span>, sigma<span style="color:#f92672">=</span><span style="color:#ae81ff">100</span>, n<span style="color:#f92672">=</span><span style="color:#ae81ff">50</span>,
start_date<span style="color:#f92672">=</span>datetime<span style="color:#f92672">.</span>date(<span style="color:#ae81ff">2017</span>, <span style="color:#ae81ff">7</span>, <span style="color:#ae81ff">1</span>)):
xs <span style="color:#f92672">=</span> numpy<span style="color:#f92672">.</span>linspace(<span style="color:#ae81ff">0</span>, <span style="color:#ae81ff">1</span>, n, endpoint<span style="color:#f92672">=</span>False)
ys <span style="color:#f92672">=</span> [k<span style="color:#f92672">*</span>x <span style="color:#f92672">+</span> m <span style="color:#f92672">+</span> random<span style="color:#f92672">.</span>gauss(<span style="color:#ae81ff">0</span>, sigma) <span style="color:#66d9ef">for</span> x <span style="color:#f92672">in</span> xs]
ts <span style="color:#f92672">=</span> [start_date <span style="color:#f92672">+</span> datetime<span style="color:#f92672">.</span>timedelta(x)<span style="color:#f92672">*</span><span style="color:#ae81ff">365</span> <span style="color:#66d9ef">for</span> x <span style="color:#f92672">in</span> xs]
x_scale <span style="color:#f92672">=</span> numpy<span style="color:#f92672">.</span>linspace(<span style="color:#f92672">-</span><span style="color:#ae81ff">1</span>, <span style="color:#ae81ff">2</span>, <span style="color:#ae81ff">500</span>) <span style="color:#75715e"># for plotting</span>
t_scale <span style="color:#f92672">=</span> [start_date <span style="color:#f92672">+</span> datetime<span style="color:#f92672">.</span>timedelta(x)<span style="color:#f92672">*</span><span style="color:#ae81ff">365</span> <span style="color:#66d9ef">for</span> x <span style="color:#f92672">in</span> x_scale]
<span style="color:#66d9ef">return</span> xs, ys, ts, x_scale, t_scale
xs, ys, ts, x_scale, t_scale <span style="color:#f92672">=</span> generate_time_series()
</code></pre></div><p>Before we get started with anything, we need graphics. Let's plot to see what's going on!</p>
<div class="highlight"><pre style="color:#f8f8f2;background-color:#272822;-moz-tab-size:4;-o-tab-size:4;tab-size:4"><code class="language-python" data-lang="python">pyplot<span style="color:#f92672">.</span>scatter(ts, ys, alpha<span style="color:#f92672">=</span><span style="color:#ae81ff">0.5</span>, s<span style="color:#f92672">=</span><span style="color:#ae81ff">100</span>)
pyplot<span style="color:#f92672">.</span>xlabel(<span style="color:#e6db74"></span><span style="color:#e6db74">'</span><span style="color:#e6db74">Date</span><span style="color:#e6db74">'</span>)
pyplot<span style="color:#f92672">.</span>ylabel(<span style="color:#e6db74"></span><span style="color:#e6db74">'</span><span style="color:#e6db74">Weight of elephant (kg)</span><span style="color:#e6db74">'</span>)
</code></pre></div><p><img src="https://erikbern.com/assets/uncertainty/output_4_1.png" alt="png"></p>
<p>First of all, let's not fit any fancy models. We're just going to break it up into a few buckets and compute the mean within each bucket. But let's first pause and talk about uncertainty.</p>
<h1 id="distribution-of-the-data-vs-uncertainty">Distribution of the data vs uncertainty</h1>
<p>This makes me sometimes feel dumb but I keep confusing what “uncertainty” means and I think it's important to be hyper clear because we're going to do all of them. There's multiple different things we can estimate the distribution for:</p>
<ol>
<li>The data itself. Given a certain time frame $$(t, t’)$$, what's the distribution of the elephant's weight during that time interval?</li>
<li>The uncertainty of some parameter, like the parameter $$k$$ in a linear relationship $$y = kt + m$$. <em>Or</em> the uncertainty of some estimator, like the <em>mean</em> of a number of observations.</li>
<li>The uncertainty of predicted quantities. So if we predict that for a date $$t$$ (possibly in the future), the elephant is going to weight $$y$$ kg, we want to know the uncertainty of the quantity $$y$$.</li>
</ol>
<p>Hope that makes sense! Let's start with the most basic model – just break things up in buckets. I recommend the excellent <a href="https://seaborn.pydata.org/">Seaborn</a> package if we just want to get some basic idea of distributions and uncertainty estimates. Seaborn usually operates on dataframes so we'll need to convert:</p>
<div class="highlight"><pre style="color:#f8f8f2;background-color:#272822;-moz-tab-size:4;-o-tab-size:4;tab-size:4"><code class="language-python" data-lang="python">d <span style="color:#f92672">=</span> pandas<span style="color:#f92672">.</span>DataFrame({<span style="color:#e6db74"></span><span style="color:#e6db74">'</span><span style="color:#e6db74">x</span><span style="color:#e6db74">'</span>: xs, <span style="color:#e6db74"></span><span style="color:#e6db74">'</span><span style="color:#e6db74">t</span><span style="color:#e6db74">'</span>: ts, <span style="color:#e6db74"></span><span style="color:#e6db74">'</span><span style="color:#e6db74">Weight (kg)</span><span style="color:#e6db74">'</span>: ys})
d[<span style="color:#e6db74"></span><span style="color:#e6db74">'</span><span style="color:#e6db74">Month</span><span style="color:#e6db74">'</span>] <span style="color:#f92672">=</span> d[<span style="color:#e6db74"></span><span style="color:#e6db74">'</span><span style="color:#e6db74">t</span><span style="color:#e6db74">'</span>]<span style="color:#f92672">.</span>apply(<span style="color:#66d9ef">lambda</span> t: t<span style="color:#f92672">.</span>strftime(<span style="color:#e6db74"></span><span style="color:#e6db74">'</span><span style="color:#e6db74">%</span><span style="color:#e6db74">Y-</span><span style="color:#e6db74">%</span><span style="color:#e6db74">m</span><span style="color:#e6db74">'</span>))
seaborn<span style="color:#f92672">.</span>boxplot(data<span style="color:#f92672">=</span>d, x<span style="color:#f92672">=</span><span style="color:#e6db74"></span><span style="color:#e6db74">'</span><span style="color:#e6db74">Month</span><span style="color:#e6db74">'</span>, y<span style="color:#f92672">=</span><span style="color:#e6db74"></span><span style="color:#e6db74">'</span><span style="color:#e6db74">Weight (kg)</span><span style="color:#e6db74">'</span>)
</code></pre></div><p><img src="https://erikbern.com/assets/uncertainty/output_6_1.png" alt="png"></p>
<p>These last charts show the <em>distribution</em> of the dataset. Let's now try to figure out the uncertainty of a very common estimator: the <em>mean</em>!</p>
<h2 id="computing-the-uncertainty-of-the-mean-ndash-normal-distributions">Computing the uncertainty of the mean – normal distributions</h2>
<p>Under some mild assumptions (I'm going to get back to this in a sec and scrutinize it), we can compute the confidence intervals <em>of the mean estimator</em> as:</p>
<p>$$\bar{x} \pm 1.96\sigma / \sqrt{n}$$</p>
<p>Where $$\bar{x}$$ is the mean and $$\sigma$$ is the standard deviation, a.k.a. the square root of the variance. I don't think this formula is super important to remember, but I think it's somewhat useful to remember that the <em>size of the confidence interval is inversely related to the square root of the number of samples.</em> For instance, this is useful when you're running an A/B test – if you want to detect a 1% difference then you need something on the order of $$0.01^{-2} = 10,000$$ samples. (This is a rule of thumb, don't use it for your medical device software).</p>
<p>By the way – what's the 1.96 number from? It's directly related to the size of the uncertainty estimate. With $$\pm 1.96$$ you will cover about 95% of the probability distribution.</p>
<div class="highlight"><pre style="color:#f8f8f2;background-color:#272822;-moz-tab-size:4;-o-tab-size:4;tab-size:4"><code class="language-python" data-lang="python"><span style="color:#66d9ef">def</span> <span style="color:#a6e22e">plot_confidence_interval</span>(observations_by_group):
groups <span style="color:#f92672">=</span> list(sorted(observations_by_group<span style="color:#f92672">.</span>keys()))
lo_bound <span style="color:#f92672">=</span> []
hi_bound <span style="color:#f92672">=</span> []
<span style="color:#66d9ef">for</span> group <span style="color:#f92672">in</span> groups:
series <span style="color:#f92672">=</span> observations_by_group[group]
mu, std, n <span style="color:#f92672">=</span> numpy<span style="color:#f92672">.</span>mean(series), numpy<span style="color:#f92672">.</span>std(series), len(series)
lo_bound<span style="color:#f92672">.</span>append(mu <span style="color:#f92672">-</span> <span style="color:#ae81ff">1.96</span><span style="color:#f92672">*</span>std<span style="color:#f92672">*</span>n<span style="color:#f92672">*</span><span style="color:#f92672">*</span><span style="color:#f92672">-</span><span style="color:#ae81ff">0.5</span>)
hi_bound<span style="color:#f92672">.</span>append(mu <span style="color:#f92672">+</span> <span style="color:#ae81ff">1.96</span><span style="color:#f92672">*</span>std<span style="color:#f92672">*</span>n<span style="color:#f92672">*</span><span style="color:#f92672">*</span><span style="color:#f92672">-</span><span style="color:#ae81ff">0.5</span>)
pyplot<span style="color:#f92672">.</span>fill_between(groups, lo_bound, hi_bound, alpha<span style="color:#f92672">=</span><span style="color:#ae81ff">0.2</span>,
label<span style="color:#f92672">=</span><span style="color:#e6db74"></span><span style="color:#e6db74">'</span><span style="color:#e6db74">Confidence interval (normal)</span><span style="color:#e6db74">'</span>)
pyplot<span style="color:#f92672">.</span>scatter(ts, ys, alpha<span style="color:#f92672">=</span><span style="color:#ae81ff">0.5</span>, s<span style="color:#f92672">=</span><span style="color:#ae81ff">100</span>)
observations_by_month <span style="color:#f92672">=</span> {}
<span style="color:#66d9ef">for</span> month, y <span style="color:#f92672">in</span> zip(d[<span style="color:#e6db74"></span><span style="color:#e6db74">'</span><span style="color:#e6db74">Month</span><span style="color:#e6db74">'</span>], d[<span style="color:#e6db74"></span><span style="color:#e6db74">'</span><span style="color:#e6db74">Weight (kg)</span><span style="color:#e6db74">'</span>]):
observations_by_month<span style="color:#f92672">.</span>setdefault(month, [])<span style="color:#f92672">.</span>append(y)
plot_confidence_interval(observations_by_month)
pyplot<span style="color:#f92672">.</span>ylabel(<span style="color:#e6db74"></span><span style="color:#e6db74">'</span><span style="color:#e6db74">Weight of elephant (kg)</span><span style="color:#e6db74">'</span>)
pyplot<span style="color:#f92672">.</span>legend()
</code></pre></div><p><img src="https://erikbern.com/assets/uncertainty/output_9_1.png" alt="png"></p>
<p>Note that this shows the uncertainty of the <em>mean</em> and that this is not the same thing as the <em>distribution of the data</em> itself. That's why you see far fewer than 95% of the points within the red shaded area. If we added more and more points, the red shaded area would get more and more narrow, whereas the blue dots would still have about the same range. However the true mean should in theory be within the red shaded area 95% of the time.</p>
<p>I mentioned earlier that the formula for confidence interval only applies under some mild assumptions. What are those? It's the assumption of <em>normality</em>. For a large number of observations, this is nothing to worry about, and this is due to the <a href="https://en.wikipedia.org/wiki/Central_limit_theorem">central limit theorem</a>.</p>
<h1 id="confidence-intervals-when-all-outcomes-are-0-or-1">Confidence intervals when all outcomes are 0 or 1</h1>
<p>Let's look at a type of dataset that I often work on: conversions. For the sake of the argument, let's say we're running an A/B test that has some impact, and that we're trying to understand the impact on conversion rate <em>by state</em>. Conversion is always 0 or 1. The code to generate this data set isn't super important, so don't pay too much attention to this:</p>
<div class="highlight"><pre style="color:#f8f8f2;background-color:#272822;-moz-tab-size:4;-o-tab-size:4;tab-size:4"><code class="language-python" data-lang="python">STATES <span style="color:#f92672">=</span> [<span style="color:#e6db74"></span><span style="color:#e6db74">'</span><span style="color:#e6db74">CA</span><span style="color:#e6db74">'</span>, <span style="color:#e6db74"></span><span style="color:#e6db74">'</span><span style="color:#e6db74">NY</span><span style="color:#e6db74">'</span>, <span style="color:#e6db74"></span><span style="color:#e6db74">'</span><span style="color:#e6db74">FL</span><span style="color:#e6db74">'</span>, <span style="color:#e6db74"></span><span style="color:#e6db74">'</span><span style="color:#e6db74">TX</span><span style="color:#e6db74">'</span>, <span style="color:#e6db74"></span><span style="color:#e6db74">'</span><span style="color:#e6db74">PA</span><span style="color:#e6db74">'</span>, <span style="color:#e6db74"></span><span style="color:#e6db74">'</span><span style="color:#e6db74">IL</span><span style="color:#e6db74">'</span>, <span style="color:#e6db74"></span><span style="color:#e6db74">'</span><span style="color:#e6db74">OH</span><span style="color:#e6db74">'</span>]
GROUPS <span style="color:#f92672">=</span> [<span style="color:#e6db74"></span><span style="color:#e6db74">'</span><span style="color:#e6db74">test</span><span style="color:#e6db74">'</span>, <span style="color:#e6db74"></span><span style="color:#e6db74">'</span><span style="color:#e6db74">control</span><span style="color:#e6db74">'</span>]
<span style="color:#66d9ef">def</span> <span style="color:#a6e22e">generate_binary_categorical</span>(states<span style="color:#f92672">=</span>STATES, groups<span style="color:#f92672">=</span>GROUPS, k<span style="color:#f92672">=</span><span style="color:#ae81ff">400</span>,
zs<span style="color:#f92672">=</span>[<span style="color:#ae81ff">0</span>, <span style="color:#ae81ff">0.2</span>], z_std<span style="color:#f92672">=</span><span style="color:#ae81ff">0.1</span>, b<span style="color:#f92672">=</span><span style="color:#f92672">-</span><span style="color:#ae81ff">3</span>, b_std<span style="color:#f92672">=</span><span style="color:#ae81ff">1</span>):
<span style="color:#75715e"># Don't pay too much attention to this code. The main thing happens in</span>
<span style="color:#75715e"># numpy.random.binomial, which is where we draw the "k out of n" outcomes.</span>
output <span style="color:#f92672">=</span> {}
e_obs_per_state <span style="color:#f92672">=</span> numpy<span style="color:#f92672">.</span>random<span style="color:#f92672">.</span>exponential(k, size<span style="color:#f92672">=</span>len(states))
state_biases <span style="color:#f92672">=</span> numpy<span style="color:#f92672">.</span>random<span style="color:#f92672">.</span>normal(b, b_std, size<span style="color:#f92672">=</span>len(states))
<span style="color:#66d9ef">for</span> group, z <span style="color:#f92672">in</span> zip(groups, zs):
noise <span style="color:#f92672">=</span> numpy<span style="color:#f92672">.</span>random<span style="color:#f92672">.</span>normal(z, z_std, size<span style="color:#f92672">=</span>len(states))
ps <span style="color:#f92672">=</span> <span style="color:#ae81ff">1</span> <span style="color:#f92672">/</span> (<span style="color:#ae81ff">1</span> <span style="color:#f92672">+</span> numpy<span style="color:#f92672">.</span>exp(<span style="color:#f92672">-</span>(state_biases <span style="color:#f92672">+</span> noise)))
ns <span style="color:#f92672">=</span> numpy<span style="color:#f92672">.</span>random<span style="color:#f92672">.</span>poisson(e_obs_per_state)
ks <span style="color:#f92672">=</span> numpy<span style="color:#f92672">.</span>random<span style="color:#f92672">.</span>binomial(ns, ps)
output[group] <span style="color:#f92672">=</span> (ns, ks)
<span style="color:#66d9ef">return</span> output
</code></pre></div><p>For each state and each “group” (test and control) we generated $$ n $$ users, out of which $$ k $$ have converted. Let's plot the conversion rate per state to see what's going on!</p>
<div class="highlight"><pre style="color:#f8f8f2;background-color:#272822;-moz-tab-size:4;-o-tab-size:4;tab-size:4"><code class="language-python" data-lang="python">data <span style="color:#f92672">=</span> generate_binary_categorical()
<span style="color:#66d9ef">for</span> group, (ns, ks) <span style="color:#f92672">in</span> data<span style="color:#f92672">.</span>items():
pyplot<span style="color:#f92672">.</span>scatter(STATES, ks<span style="color:#f92672">/</span>ns, label<span style="color:#f92672">=</span>group, alpha<span style="color:#f92672">=</span><span style="color:#ae81ff">0.7</span>, s<span style="color:#f92672">=</span><span style="color:#ae81ff">400</span>)
pyplot<span style="color:#f92672">.</span>ylabel(<span style="color:#e6db74"></span><span style="color:#e6db74">'</span><span style="color:#e6db74">Conversion rate</span><span style="color:#e6db74">'</span>)
pyplot<span style="color:#f92672">.</span>legend()
</code></pre></div><p><img src="https://erikbern.com/assets/uncertainty/output_14_1.png" alt="png"></p>
<p>How do we compute confidence intervals for these numbers? We could of course use the method I just covered further up where we compute the mean and the standard deviations. But in this case there's a trick we can use!</p>
<p>Since all outcomes are 0 or 1, and drawn with the same (unknown) probability, we know that the number of ones and zeros follows a <a href="https://en.wikipedia.org/wiki/Binomial_distribution">binomial distribution</a>. This means that the confidence interval of a “$$k$$ out of $$n$$” scenario is a <a href="https://en.wikipedia.org/wiki/Beta_distribution">Beta distribution</a>.</p>
<p>I've personally benefitted from memorizing the formula for the confidence interval and think I probably use it more than the previous (Normal based) one. In particular all you need to remember is</p>
<div class="highlight"><pre style="color:#f8f8f2;background-color:#272822;-moz-tab-size:4;-o-tab-size:4;tab-size:4"><code class="language-python" data-lang="python">n, k <span style="color:#f92672">=</span> <span style="color:#ae81ff">100</span>, <span style="color:#ae81ff">3</span>
scipy<span style="color:#f92672">.</span>stats<span style="color:#f92672">.</span>beta<span style="color:#f92672">.</span>ppf([<span style="color:#ae81ff">0.025</span>, <span style="color:#ae81ff">0.975</span>], k, n<span style="color:#f92672">-</span>k)
</code></pre></div><pre><code>array([0.00629335, 0.07107612])
</code></pre>
<p>This will compute a 95% confidence interval if you plug in values for $$n$$ and $$k$$. In this case we see that if we have 100 website visitors and 3 of them purchased the product, then range is 0.6%-7.1%. Let's try this for our dataset:</p>
<div class="highlight"><pre style="color:#f8f8f2;background-color:#272822;-moz-tab-size:4;-o-tab-size:4;tab-size:4"><code class="language-python" data-lang="python"><span style="color:#66d9ef">for</span> group, (ns, ks) <span style="color:#f92672">in</span> data<span style="color:#f92672">.</span>items():
lo <span style="color:#f92672">=</span> scipy<span style="color:#f92672">.</span>stats<span style="color:#f92672">.</span>beta<span style="color:#f92672">.</span>ppf(<span style="color:#ae81ff">0.025</span>, ks, ns<span style="color:#f92672">-</span>ks)
hi <span style="color:#f92672">=</span> scipy<span style="color:#f92672">.</span>stats<span style="color:#f92672">.</span>beta<span style="color:#f92672">.</span>ppf(<span style="color:#ae81ff">0.975</span>, ks, ns<span style="color:#f92672">-</span>ks)
mean <span style="color:#f92672">=</span> ks<span style="color:#f92672">/</span>ns
pyplot<span style="color:#f92672">.</span>errorbar(STATES, y<span style="color:#f92672">=</span>mean, yerr<span style="color:#f92672">=</span>[mean<span style="color:#f92672">-</span>lo, hi<span style="color:#f92672">-</span>mean],
label<span style="color:#f92672">=</span>group, alpha<span style="color:#f92672">=</span><span style="color:#ae81ff">0.7</span>, linewidth<span style="color:#f92672">=</span><span style="color:#ae81ff">0</span>, elinewidth<span style="color:#f92672">=</span><span style="color:#ae81ff">50</span>)
pyplot<span style="color:#f92672">.</span>ylabel(<span style="color:#e6db74"></span><span style="color:#e6db74">'</span><span style="color:#e6db74">Conversion rate</span><span style="color:#e6db74">'</span>)
pyplot<span style="color:#f92672">.</span>legend()
</code></pre></div><p><img src="https://erikbern.com/assets/uncertainty/output_18_1.png" alt="png"></p>
<p>Nice! 👌</p>
<h2 id="bootstrapping">Bootstrapping</h2>
<p>Another approach that can be useful is bootstrapping. It allows you do compute the same statistics without memorizing any formulas. The idea is to compute the mean, but do it for $$n$$ <em>bootstraps</em>, where each bootstrap is a random sample (with replacement) from our observations. For every bootstrap, we compute a mean, and then we take the mean in the 97.5th and the 2.5th percentile as the confidence interval:</p>
<div class="highlight"><pre style="color:#f8f8f2;background-color:#272822;-moz-tab-size:4;-o-tab-size:4;tab-size:4"><code class="language-python" data-lang="python">lo_bound <span style="color:#f92672">=</span> []
hi_bound <span style="color:#f92672">=</span> []
months <span style="color:#f92672">=</span> sorted(observations_by_month<span style="color:#f92672">.</span>keys())
<span style="color:#66d9ef">for</span> month <span style="color:#f92672">in</span> months:
series <span style="color:#f92672">=</span> observations_by_month[month]
bootstrapped_means <span style="color:#f92672">=</span> []
<span style="color:#66d9ef">for</span> i <span style="color:#f92672">in</span> range(<span style="color:#ae81ff">1000</span>):
<span style="color:#75715e"># sample with replacement</span>
bootstrap <span style="color:#f92672">=</span> [random<span style="color:#f92672">.</span>choice(series) <span style="color:#66d9ef">for</span> _ <span style="color:#f92672">in</span> series]
bootstrapped_means<span style="color:#f92672">.</span>append(numpy<span style="color:#f92672">.</span>mean(bootstrap))
lo_bound<span style="color:#f92672">.</span>append(numpy<span style="color:#f92672">.</span>percentile(bootstrapped_means, <span style="color:#ae81ff">2.5</span>))
hi_bound<span style="color:#f92672">.</span>append(numpy<span style="color:#f92672">.</span>percentile(bootstrapped_means, <span style="color:#ae81ff">97.5</span>))
pyplot<span style="color:#f92672">.</span>scatter(ts, ys, alpha<span style="color:#f92672">=</span><span style="color:#ae81ff">0.5</span>, s<span style="color:#f92672">=</span><span style="color:#ae81ff">100</span>)
pyplot<span style="color:#f92672">.</span>fill_between(months, lo_bound, hi_bound, alpha<span style="color:#f92672">=</span><span style="color:#ae81ff">0.2</span>,
label<span style="color:#f92672">=</span><span style="color:#e6db74"></span><span style="color:#e6db74">'</span><span style="color:#e6db74">Confidence interval</span><span style="color:#e6db74">'</span>)
pyplot<span style="color:#f92672">.</span>ylabel(<span style="color:#e6db74"></span><span style="color:#e6db74">'</span><span style="color:#e6db74">Weight of elephant (kg)</span><span style="color:#e6db74">'</span>)
pyplot<span style="color:#f92672">.</span>legend()
</code></pre></div><p><img src="https://erikbern.com/assets/uncertainty/output_20_1.png" alt="png"></p>
<p>Miraculously, this charts look very similar to the one before! Just kidding – that was sort of expected :)</p>
<p>Bootstrapping is nice because it lets you dodge any questions about what probability distribution the data is generated from. It's basically plug and play, and works on almost everything, though it can be a bit slow.</p>
<p>☠ Be aware though that there's a <em>danger zone</em> of bootstrapping. My understanding is that bootstrapping will <em>converge</em> towards the correct estimates as the number of samples goes to infinity, but if you're working with small samples, you can get really wonky results. I generally never trust bootstrapping for anything less than say 50 samples, and you probably shouldn't do that either.</p>
<p>As a side note, Seaborn's <code>barplot</code> actually plots confidence intervals using bootstrapping:</p>
<div class="highlight"><pre style="color:#f8f8f2;background-color:#272822;-moz-tab-size:4;-o-tab-size:4;tab-size:4"><code class="language-python" data-lang="python">seaborn<span style="color:#f92672">.</span>barplot(data<span style="color:#f92672">=</span>d, x<span style="color:#f92672">=</span><span style="color:#e6db74"></span><span style="color:#e6db74">'</span><span style="color:#e6db74">Month</span><span style="color:#e6db74">'</span>, y<span style="color:#f92672">=</span><span style="color:#e6db74"></span><span style="color:#e6db74">'</span><span style="color:#e6db74">Weight (kg)</span><span style="color:#e6db74">'</span>)
</code></pre></div><p><img src="https://erikbern.com/assets/uncertainty/output_23_2.png" alt="png"></p>
<p>Again, Seaborn is great for exploratory analysis, and some of its charts can do basic statistics.</p>
<h1 id="regression">Regression</h1>
<p>Let's crank it up a notch. We're going to fit a straight line to this cloud of points.</p>
<p>There's some smart ways you can implement linear regression so that it's extremely fast, but we're not going to use those methods because they don't generalize very well.</p>
<p>I'm going to do it in what I think of as the most general possible way. We're going to define a <em>model</em> (in this case a straight line), a <em>loss function</em> (squared deviations from this straight line) and then optimize it using a general-purpose solver (scipy.optimize.minimize).</p>
<div class="highlight"><pre style="color:#f8f8f2;background-color:#272822;-moz-tab-size:4;-o-tab-size:4;tab-size:4"><code class="language-python" data-lang="python">xs, ys, ts, x_scale, t_scale <span style="color:#f92672">=</span> generate_time_series()
<span style="color:#66d9ef">def</span> <span style="color:#a6e22e">model</span>(xs, k, m):
<span style="color:#66d9ef">return</span> k <span style="color:#f92672">*</span> xs <span style="color:#f92672">+</span> m
<span style="color:#66d9ef">def</span> <span style="color:#a6e22e">l2_loss</span>(tup, xs, ys):
k, m <span style="color:#f92672">=</span> tup
delta <span style="color:#f92672">=</span> model(xs, k, m) <span style="color:#f92672">-</span> ys
<span style="color:#66d9ef">return</span> numpy<span style="color:#f92672">.</span>dot(delta, delta)
k_hat, m_hat <span style="color:#f92672">=</span> scipy<span style="color:#f92672">.</span>optimize<span style="color:#f92672">.</span>minimize(l2_loss, (<span style="color:#ae81ff">0</span>, <span style="color:#ae81ff">0</span>), args<span style="color:#f92672">=</span>(xs, ys))<span style="color:#f92672">.</span>x
pyplot<span style="color:#f92672">.</span>scatter(ts, ys, alpha<span style="color:#f92672">=</span><span style="color:#ae81ff">0.5</span>, s<span style="color:#f92672">=</span><span style="color:#ae81ff">100</span>)
pyplot<span style="color:#f92672">.</span>plot(t_scale, model(x_scale, k_hat, m_hat), color<span style="color:#f92672">=</span><span style="color:#e6db74"></span><span style="color:#e6db74">'</span><span style="color:#e6db74">red</span><span style="color:#e6db74">'</span>,
linewidth<span style="color:#f92672">=</span><span style="color:#ae81ff">5</span>, alpha<span style="color:#f92672">=</span><span style="color:#ae81ff">0.5</span>)
pyplot<span style="color:#f92672">.</span>ylabel(<span style="color:#e6db74"></span><span style="color:#e6db74">'</span><span style="color:#e6db74">Weight of elephant (kg)</span><span style="color:#e6db74">'</span>)
</code></pre></div><p><img src="https://erikbern.com/assets/uncertainty/output_26_1.png" alt="png"></p>
<h2 id="linear-regression-with-uncertainty-using-maximum-likelihood">Linear regression with uncertainty, using maximum likelihood</h2>
<p>We just fit $$k$$ and $$m$$ but there's no uncertainty estimates here. There's several things we could estimate uncertainties for, but let's start with the <em>uncertainty of the predicted values</em>.</p>
<p>We can do that by fitting a normal distribution around the line <em>at the same time</em> as we're fitting $$k$$ and $$m$$. I'm going to do this using <a href="https://en.wikipedia.org/wiki/Maximum_likelihood_estimation">Maximum Likelihood</a>. If you're not familiar with this method, don't be scared! If there's <em>any</em> method in statistics that I've found as easily accessible (it's basic probability theory) and useful, it's this method.</p>
<p>In fact, minimizing squared loss (which we just did, in the previous snippet) is actually a special case of maximum likelihood! Minimizing the squared loss is the same thing as <em>maximizing the logarithm of the probability of all the data.</em> This is usually called the “log likelihood”.</p>
<p>So we already have an expression to minimize the squared loss. If we make the variance an unknown variable $$\sigma^2$$ we can fit that at the same time! The quantity we're going to try to minimize now turns into</p>
<p>$$ \frac{n}{2}\log{2\pi\sigma^2} + \frac{1}{2\sigma^2}\sum \left(y_i - \hat{y_i}\right)^2 $$</p>
<p>Where $$\hat{y_i} = kx_i + m$$ are the predicted values by our model. Let's try to fit that!</p>
<div class="highlight"><pre style="color:#f8f8f2;background-color:#272822;-moz-tab-size:4;-o-tab-size:4;tab-size:4"><code class="language-python" data-lang="python"><span style="color:#f92672">import</span> scipy.optimize
<span style="color:#66d9ef">def</span> <span style="color:#a6e22e">neg_log_likelihood</span>(tup, xs, ys):
<span style="color:#75715e"># Since sigma > 0, we use use log(sigma) as the parameter instead.</span>
<span style="color:#75715e"># That way we have an unconstrained problem.</span>
k, m, log_sigma <span style="color:#f92672">=</span> tup
sigma <span style="color:#f92672">=</span> numpy<span style="color:#f92672">.</span>exp(log_sigma)
delta <span style="color:#f92672">=</span> model(xs, k, m) <span style="color:#f92672">-</span> ys
<span style="color:#66d9ef">return</span> len(xs)<span style="color:#f92672">/</span><span style="color:#ae81ff">2</span><span style="color:#f92672">*</span>numpy<span style="color:#f92672">.</span>log(<span style="color:#ae81ff">2</span><span style="color:#f92672">*</span>numpy<span style="color:#f92672">.</span>pi<span style="color:#f92672">*</span>sigma<span style="color:#f92672">*</span><span style="color:#f92672">*</span><span style="color:#ae81ff">2</span>) <span style="color:#f92672">+</span> \
numpy<span style="color:#f92672">.</span>dot(delta, delta) <span style="color:#f92672">/</span> (<span style="color:#ae81ff">2</span><span style="color:#f92672">*</span>sigma<span style="color:#f92672">*</span><span style="color:#f92672">*</span><span style="color:#ae81ff">2</span>)
k_hat, m_hat, log_sigma_hat <span style="color:#f92672">=</span> scipy<span style="color:#f92672">.</span>optimize<span style="color:#f92672">.</span>minimize(
neg_log_likelihood, (<span style="color:#ae81ff">0</span>, <span style="color:#ae81ff">0</span>, <span style="color:#ae81ff">0</span>), args<span style="color:#f92672">=</span>(xs, ys)
)<span style="color:#f92672">.</span>x
sigma_hat <span style="color:#f92672">=</span> numpy<span style="color:#f92672">.</span>exp(log_sigma_hat)
pyplot<span style="color:#f92672">.</span>scatter(ts, ys, alpha<span style="color:#f92672">=</span><span style="color:#ae81ff">0.5</span>, s<span style="color:#f92672">=</span><span style="color:#ae81ff">100</span>)
pyplot<span style="color:#f92672">.</span>plot(t_scale, model(x_scale, k_hat, m_hat),
color<span style="color:#f92672">=</span><span style="color:#e6db74"></span><span style="color:#e6db74">'</span><span style="color:#e6db74">green</span><span style="color:#e6db74">'</span>, linewidth<span style="color:#f92672">=</span><span style="color:#ae81ff">5</span>)
pyplot<span style="color:#f92672">.</span>fill_between(
t_scale,
model(x_scale, k_hat, m_hat) <span style="color:#f92672">-</span> <span style="color:#ae81ff">1.96</span><span style="color:#f92672">*</span>sigma_hat,
model(x_scale, k_hat, m_hat) <span style="color:#f92672">+</span> <span style="color:#ae81ff">1.96</span><span style="color:#f92672">*</span>sigma_hat,
color<span style="color:#f92672">=</span><span style="color:#e6db74"></span><span style="color:#e6db74">'</span><span style="color:#e6db74">red</span><span style="color:#e6db74">'</span>, alpha<span style="color:#f92672">=</span><span style="color:#ae81ff">0.3</span>)
pyplot<span style="color:#f92672">.</span>legend()
pyplot<span style="color:#f92672">.</span>ylabel(<span style="color:#e6db74"></span><span style="color:#e6db74">'</span><span style="color:#e6db74">Weight of elephant (kg)</span><span style="color:#e6db74">'</span>)
</code></pre></div><p><img src="https://erikbern.com/assets/uncertainty/output_28_2.png" alt="png"></p>
<p>The uncertainty estimate here isn't actually 💯 because it doesn't take into account the uncertainty of $$k$$, $$m$$, and $$\sigma$$ in itself. It's a decent approximation, but to get it right we need to do those things at the same time. So let's do it.</p>
<h1 id="bootstrapping-rebooted">Bootstrapping, rebooted</h1>
<p>So let's take it to the next level and try to estimate the uncertainty estimate of $$k$$ and $$m$$ <em>and</em> $$\sigma$$! I think this will show how bootstrapping is basically cookie cutter — you can plug it into almost anything in order to estimate uncertainties.</p>
<p>For every bootstrap estimate, I'm going to draw a line. We can also take all those lines and compute a confidence interval:</p>
<div class="highlight"><pre style="color:#f8f8f2;background-color:#272822;-moz-tab-size:4;-o-tab-size:4;tab-size:4"><code class="language-python" data-lang="python">pyplot<span style="color:#f92672">.</span>scatter(ts, ys, alpha<span style="color:#f92672">=</span><span style="color:#ae81ff">0.5</span>, s<span style="color:#f92672">=</span><span style="color:#ae81ff">100</span>)
xys <span style="color:#f92672">=</span> list(zip(xs, ys))
curves <span style="color:#f92672">=</span> []
<span style="color:#66d9ef">for</span> i <span style="color:#f92672">in</span> range(<span style="color:#ae81ff">100</span>):
<span style="color:#75715e"># sample with replacement</span>
bootstrap <span style="color:#f92672">=</span> [random<span style="color:#f92672">.</span>choice(xys) <span style="color:#66d9ef">for</span> _ <span style="color:#f92672">in</span> xys]
xs_bootstrap <span style="color:#f92672">=</span> numpy<span style="color:#f92672">.</span>array([x <span style="color:#66d9ef">for</span> x, y <span style="color:#f92672">in</span> bootstrap])
ys_bootstrap <span style="color:#f92672">=</span> numpy<span style="color:#f92672">.</span>array([y <span style="color:#66d9ef">for</span> x, y <span style="color:#f92672">in</span> bootstrap])
k_hat, m_hat <span style="color:#f92672">=</span> scipy<span style="color:#f92672">.</span>optimize<span style="color:#f92672">.</span>minimize(
l2_loss, (<span style="color:#ae81ff">0</span>, <span style="color:#ae81ff">0</span>), args<span style="color:#f92672">=</span>(xs_bootstrap, ys_bootstrap)
)<span style="color:#f92672">.</span>x
curves<span style="color:#f92672">.</span>append(model(x_scale, k_hat, m_hat))
<span style="color:#75715e"># Plot individual lines</span>
<span style="color:#66d9ef">for</span> curve <span style="color:#f92672">in</span> curves:
pyplot<span style="color:#f92672">.</span>plot(t_scale, curve, alpha<span style="color:#f92672">=</span><span style="color:#ae81ff">0.1</span>, linewidth<span style="color:#f92672">=</span><span style="color:#ae81ff">3</span>, color<span style="color:#f92672">=</span><span style="color:#e6db74"></span><span style="color:#e6db74">'</span><span style="color:#e6db74">green</span><span style="color:#e6db74">'</span>)
<span style="color:#75715e"># Plot 95% confidence interval</span>
lo, hi <span style="color:#f92672">=</span> numpy<span style="color:#f92672">.</span>percentile(curves, (<span style="color:#ae81ff">2.5</span>, <span style="color:#ae81ff">97.5</span>), axis<span style="color:#f92672">=</span><span style="color:#ae81ff">0</span>)
pyplot<span style="color:#f92672">.</span>fill_between(t_scale, lo, hi, color<span style="color:#f92672">=</span><span style="color:#e6db74"></span><span style="color:#e6db74">'</span><span style="color:#e6db74">red</span><span style="color:#e6db74">'</span>, alpha<span style="color:#f92672">=</span><span style="color:#ae81ff">0.5</span>)
pyplot<span style="color:#f92672">.</span>ylabel(<span style="color:#e6db74"></span><span style="color:#e6db74">'</span><span style="color:#e6db74">Weight of elephant (kg)</span><span style="color:#e6db74">'</span>)
</code></pre></div><p><img src="https://erikbern.com/assets/uncertainty/output_31_1.png" alt="png"></p>
<p>Whoa, what's going on here? This uncertainty is <em>very</em> different from the earlier plot. This seems confusing until you realize that they show two very different things:</p>
<ul>
<li>The first plot finds <em>one</em> solution of $$k$$ and $$m$$ and shows the uncertainty of the <em>predictions.</em> So, if you're asked what's the range of the elephant's weight in the next month, you can get it from the chart.</li>
<li>The second plot finds <em>many</em> solutions of $$k$$ and $$m$$, and shows the uncertainty of $$kx + m$$. So this answers a different question – what's the trend of the elephant's weight over time and what's the uncertainty <em>of the trend</em>.</li>
</ul>
<p>It turns out we can combine the two approaches and make it even more complicated by fitting drawing bootstrap samples and fitting $$k$$, $$m$$, and $$\sigma$$ at the same time. Then for each of those estimates, we can predict new values $$y$$. Let's do it 😎.</p>
<div class="highlight"><pre style="color:#f8f8f2;background-color:#272822;-moz-tab-size:4;-o-tab-size:4;tab-size:4"><code class="language-python" data-lang="python">pyplot<span style="color:#f92672">.</span>scatter(ts, ys, alpha<span style="color:#f92672">=</span><span style="color:#ae81ff">0.5</span>, s<span style="color:#f92672">=</span><span style="color:#ae81ff">100</span>)
xys <span style="color:#f92672">=</span> list(zip(xs, ys))
curves <span style="color:#f92672">=</span> []
<span style="color:#66d9ef">for</span> i <span style="color:#f92672">in</span> range(<span style="color:#ae81ff">4000</span>):
<span style="color:#75715e"># sample with replacement</span>
bootstrap <span style="color:#f92672">=</span> [random<span style="color:#f92672">.</span>choice(xys) <span style="color:#66d9ef">for</span> _ <span style="color:#f92672">in</span> xys]
xs_bootstrap <span style="color:#f92672">=</span> numpy<span style="color:#f92672">.</span>array([x <span style="color:#66d9ef">for</span> x, y <span style="color:#f92672">in</span> bootstrap])
ys_bootstrap <span style="color:#f92672">=</span> numpy<span style="color:#f92672">.</span>array([y <span style="color:#66d9ef">for</span> x, y <span style="color:#f92672">in</span> bootstrap])
k_hat, m_hat, log_sigma_hat <span style="color:#f92672">=</span> scipy<span style="color:#f92672">.</span>optimize<span style="color:#f92672">.</span>minimize(
neg_log_likelihood, (<span style="color:#ae81ff">0</span>, <span style="color:#ae81ff">0</span>, <span style="color:#ae81ff">0</span>), args<span style="color:#f92672">=</span>(xs_bootstrap, ys_bootstrap)
)<span style="color:#f92672">.</span>x
curves<span style="color:#f92672">.</span>append(
model(x_scale, k_hat, m_hat) <span style="color:#f92672">+</span>
<span style="color:#75715e"># Note what's going on here: we're _adding_ the random term</span>
<span style="color:#75715e"># to the predictions!</span>
numpy<span style="color:#f92672">.</span>exp(log_sigma_hat) <span style="color:#f92672">*</span> numpy<span style="color:#f92672">.</span>random<span style="color:#f92672">.</span>normal(size<span style="color:#f92672">=</span>x_scale<span style="color:#f92672">.</span>shape)
)
<span style="color:#75715e"># Plot 95% confidence interval</span>
lo, hi <span style="color:#f92672">=</span> numpy<span style="color:#f92672">.</span>percentile(curves, (<span style="color:#ae81ff">2.5</span>, <span style="color:#ae81ff">97.5</span>), axis<span style="color:#f92672">=</span><span style="color:#ae81ff">0</span>)
pyplot<span style="color:#f92672">.</span>fill_between(t_scale, lo, hi, color<span style="color:#f92672">=</span><span style="color:#e6db74"></span><span style="color:#e6db74">'</span><span style="color:#e6db74">red</span><span style="color:#e6db74">'</span>, alpha<span style="color:#f92672">=</span><span style="color:#ae81ff">0.5</span>)
pyplot<span style="color:#f92672">.</span>ylabel(<span style="color:#e6db74"></span><span style="color:#e6db74">'</span><span style="color:#e6db74">Weight of elephant (kg)</span><span style="color:#e6db74">'</span>)
</code></pre></div><p><img src="https://erikbern.com/assets/uncertainty/output_33_2.png" alt="png"></p>
<p>Nice! It's getting serious now 😅 – you can see a hyperbolic shape if you look closely!</p>
<p>The trick here is that for every bootstrap estimates of $$(k, m, \sigma)$$ we also need to draw random predictions. As you can see in the code, we're actually adding random normal variables to the predicted values for $$y$$. That's also why the shape end up a big squiggly.</p>
<p>Unfortunately bootstrapping turns out to be fairly slow for this problem – for each of the bootstraps, we need to fit a model. Let's look at another option:</p>
<h1 id="markov-chain-monte-carlo-methods">Markov chain Monte Carlo methods</h1>
<p>It's going to get a bit wilder now. I'm going to switch to some Bayesian methods, where we estimate $$k$$, $$m$$, and $$\sigma$$ by drawing samples. It's similar to bootstrapping, but MCMC has far better theoretical underpinnings (we are sampling from a “posterior distribution” using Bayes rule), and it's often orders of magnitude faster.</p>
<p>For this, we're going to use a library called <a href="http://emcee.readthedocs.io/">emcee</a> which I've found pretty easy to use. All it needs is a log-likelihood function, which as it turns out we just defined earlier! We just need to take the <em>negative</em> of it.</p>
<div class="highlight"><pre style="color:#f8f8f2;background-color:#272822;-moz-tab-size:4;-o-tab-size:4;tab-size:4"><code class="language-python" data-lang="python"><span style="color:#f92672">import</span> emcee
xs, ys, ts, x_scale, t_scale <span style="color:#f92672">=</span> generate_time_series()
<span style="color:#66d9ef">def</span> <span style="color:#a6e22e">log_likelihood</span>(tup, xs, ys):
<span style="color:#66d9ef">return</span> <span style="color:#f92672">-</span>neg_log_likelihood(tup, xs, ys)
ndim, nwalkers <span style="color:#f92672">=</span> <span style="color:#ae81ff">3</span>, <span style="color:#ae81ff">10</span>
p0 <span style="color:#f92672">=</span> [numpy<span style="color:#f92672">.</span>random<span style="color:#f92672">.</span>rand(ndim) <span style="color:#66d9ef">for</span> i <span style="color:#f92672">in</span> range(nwalkers)]
sampler <span style="color:#f92672">=</span> emcee<span style="color:#f92672">.</span>EnsembleSampler(nwalkers, ndim, log_likelihood,
args<span style="color:#f92672">=</span>[xs, ys])
sampler<span style="color:#f92672">.</span>run_mcmc(p0, <span style="color:#ae81ff">10000</span>)
</code></pre></div><p>Let's plot the sampled values for $$k$$ and $$m$$!</p>
<div class="highlight"><pre style="color:#f8f8f2;background-color:#272822;-moz-tab-size:4;-o-tab-size:4;tab-size:4"><code class="language-python" data-lang="python"><span style="color:#75715e"># Grab the last 10 from each walker</span>
samples <span style="color:#f92672">=</span> sampler<span style="color:#f92672">.</span>chain[:, <span style="color:#f92672">-</span><span style="color:#ae81ff">10</span>:, :]<span style="color:#f92672">.</span>reshape((<span style="color:#f92672">-</span><span style="color:#ae81ff">1</span>, ndim))
pyplot<span style="color:#f92672">.</span>scatter(ts, ys, alpha<span style="color:#f92672">=</span><span style="color:#ae81ff">0.5</span>, s<span style="color:#f92672">=</span><span style="color:#ae81ff">100</span>)
<span style="color:#66d9ef">for</span> k, m, log_sigma <span style="color:#f92672">in</span> samples:
pyplot<span style="color:#f92672">.</span>plot(t_scale, model(x_scale, k, m), alpha<span style="color:#f92672">=</span><span style="color:#ae81ff">0.1</span>,
linewidth<span style="color:#f92672">=</span><span style="color:#ae81ff">3</span>, color<span style="color:#f92672">=</span><span style="color:#e6db74"></span><span style="color:#e6db74">'</span><span style="color:#e6db74">green</span><span style="color:#e6db74">'</span>)
pyplot<span style="color:#f92672">.</span>ylabel(<span style="color:#e6db74"></span><span style="color:#e6db74">'</span><span style="color:#e6db74">Weigh of elephant (kg)</span><span style="color:#e6db74">'</span>)
</code></pre></div><p><img src="https://erikbern.com/assets/uncertainty/output_39_1.png" alt="png"></p>
<p>There's a bit more stuff that goes into these methods – the sampling is a bit finicky and requires a bit of handholding to get to work well. I don't want to get into all the specifics, and I'm a layman myself. But it can often be several orders of magnitude faster than booststrapping and it also handles situation with less data much better.</p>
<p>We end up with samples from the posterior distribution of $$k, m, \sigma$$. We can look at the probability distribution of these unknowns:</p>
<div class="highlight"><pre style="color:#f8f8f2;background-color:#272822;-moz-tab-size:4;-o-tab-size:4;tab-size:4"><code class="language-python" data-lang="python"><span style="color:#75715e"># Grab slightly more samples this time</span>
samples <span style="color:#f92672">=</span> sampler<span style="color:#f92672">.</span>chain[:, <span style="color:#f92672">-</span><span style="color:#ae81ff">500</span>:, :]<span style="color:#f92672">.</span>reshape((<span style="color:#f92672">-</span><span style="color:#ae81ff">1</span>, ndim))
k_samples, m_samples, log_sigma_samples <span style="color:#f92672">=</span> samples<span style="color:#f92672">.</span>T
seaborn<span style="color:#f92672">.</span>distplot(k_samples, label<span style="color:#f92672">=</span><span style="color:#e6db74"></span><span style="color:#e6db74">'</span><span style="color:#e6db74">k</span><span style="color:#e6db74">'</span>)
seaborn<span style="color:#f92672">.</span>distplot(m_samples, label<span style="color:#f92672">=</span><span style="color:#e6db74"></span><span style="color:#e6db74">'</span><span style="color:#e6db74">m</span><span style="color:#e6db74">'</span>)
seaborn<span style="color:#f92672">.</span>distplot(numpy<span style="color:#f92672">.</span>exp(log_sigma_samples), label<span style="color:#f92672">=</span><span style="color:#e6db74"></span><span style="color:#e6db74">'</span><span style="color:#e6db74">sigma</span><span style="color:#e6db74">'</span>)
pyplot<span style="color:#f92672">.</span>legend()
</code></pre></div><p><img src="https://erikbern.com/assets/uncertainty/output_41_2.png" alt="png"></p>
<p>You can see that these distribution sort of center around $$k=200$$, $$m=1000$$, and $$\sigma=100$$ which is how we constructed them in the first place. That's somewhat reassuring!</p>
<p>Finally, we can plot the full uncertainty of predictions using the same methodology as for boostraps:</p>
<div class="highlight"><pre style="color:#f8f8f2;background-color:#272822;-moz-tab-size:4;-o-tab-size:4;tab-size:4"><code class="language-python" data-lang="python">pyplot<span style="color:#f92672">.</span>scatter(ts, ys, alpha<span style="color:#f92672">=</span><span style="color:#ae81ff">0.5</span>, s<span style="color:#f92672">=</span><span style="color:#ae81ff">100</span>)
samples <span style="color:#f92672">=</span> sampler<span style="color:#f92672">.</span>chain[:, <span style="color:#f92672">-</span><span style="color:#ae81ff">4000</span>:, :]<span style="color:#f92672">.</span>reshape((<span style="color:#f92672">-</span><span style="color:#ae81ff">1</span>, ndim))
curves <span style="color:#f92672">=</span> []
<span style="color:#66d9ef">for</span> k, m, log_sigma <span style="color:#f92672">in</span> samples:
curves<span style="color:#f92672">.</span>append(
model(x_scale, k, m) <span style="color:#f92672">+</span>
numpy<span style="color:#f92672">.</span>exp(log_sigma) <span style="color:#f92672">*</span> numpy<span style="color:#f92672">.</span>random<span style="color:#f92672">.</span>normal(size<span style="color:#f92672">=</span>x_scale<span style="color:#f92672">.</span>shape)
)
<span style="color:#75715e"># Plot 95% confidence interval</span>
lo, hi <span style="color:#f92672">=</span> numpy<span style="color:#f92672">.</span>percentile(curves, (<span style="color:#ae81ff">2.5</span>, <span style="color:#ae81ff">97.5</span>), axis<span style="color:#f92672">=</span><span style="color:#ae81ff">0</span>)
pyplot<span style="color:#f92672">.</span>fill_between(t_scale, lo, hi, color<span style="color:#f92672">=</span><span style="color:#e6db74"></span><span style="color:#e6db74">'</span><span style="color:#e6db74">red</span><span style="color:#e6db74">'</span>, alpha<span style="color:#f92672">=</span><span style="color:#ae81ff">0.5</span>)
pyplot<span style="color:#f92672">.</span>ylabel(<span style="color:#e6db74"></span><span style="color:#e6db74">'</span><span style="color:#e6db74">Weight of elephant (kg)</span><span style="color:#e6db74">'</span>)
</code></pre></div><p><img src="https://erikbern.com/assets/uncertainty/output_43_1.png" alt="png"></p>
<p>These Bayesian methods don't end here. In particular there's several libraries that work with these kind of problems. It turns out that if you express the problem in a more structured way (not just a negative log-likelihood function), you can make the sampling scale to large problems (as in, thousands of unknown parameters). For Python there's <a href="https://docs.pymc.io/">PyMC3</a> and <a href="http://pystan.readthedocs.io/en/latest/">PyStan</a>, as well as the slightly more experimental (?) <a href="http://edwardlib.org/">Edward</a> and <a href="http://pyro.ai/">Pyro</a>.</p>
<h1 id="wrapping-up">Wrapping up</h1>
<p>I've taken you a bit down the rabbit hole – but it goes much further. In fact, forcing myself to estimate uncertainties for anything I do has been a great forcing function to learn a ton about statistics that I've been deferring for too long and I recommend it to anyone who is interested.</p>
<p>Making decisions based on data is hard! But if we were a bit more disciplined about quantifying the uncertainty, we might make better decisions. It's not easy right now to do this, but I <em>really</em> hope we'll see a popularization of these methods using more accessible tools.</p>
<p>Thanks to <a href="https://twitter.com/jim_savage_">Jim Savage</a> for some feedback on an earlier draft! All the code is available as a <a href="https://github.com/erikbern/uncertainty">notebook on Github</a>.</p>
<h1 id="finally">Finally</h1>
<p>I'm looking for data engineers to join my team at <a href="https://better.com">Better</a>! Feel free to reach out at erik at better dot com, or also DM on Twitter, or <a href="https://boards.greenhouse.io/better/jobs/960417">apply directly</a> if you want to. You can read a bit more about the role in a <a href="https://erikbern.com/2018/01/28/im-looking-for-data-engineers.html">previous blog post</a>.</p>
I don't want to learn your garbage query language2018-08-30T00:00:00Zhttps://erikbern.com/2018/08/30/i-dont-want-to-learn-your-garbage-query-language.html<p>This is a bit of a rant but I really don't like software that invents its own query language. There's a trillion different ORMs out there. Another trillion databases with their own query language. Another trillion SaaS products where the only way to query is to learn some random query DSL they made up.</p>
<p>I just want my SQL back. It's a language <em>everyone</em> understands, it's been around since the seventies, and it's reasonably standardized. It's easy to read, and can be used by anyone, from business people to engineers.</p>
<p>Instead, I have to learn a bunch of garbage query languages because everyone keeps trying to reinvent the wheel.</p>
<p>Take ORMs. Their alleged benefit is they cut down development time. But instead of writing SQL which <em>everyone knows,</em> I now have to scroll back and forth in some ORM documentation to figure out how to write my queries. On top of that, I have to spend time debugging why the ORM translated my query into some monstrosity that joins 17 tables using a full table scan. Instead of sticking to SQL, where it's reasonably easy to argue about the performance (try to stick to <code>where</code> clauses on indexed columns, don't go bananas with <code>join</code>s, et cetera), I have to deal with this opaque translation layer that obscures the exact query. And I end up with bloated higher level data classes rather than easy to understand tuples or dicts that contain the data in a dumb simple format that is trivial to introspect.</p>
<p>Not to mention there's like five thousand ORMs out there, so instead of learning SQL <em>once</em>, I have to learn 34 different ORMs. It's not like people learn an ORM <em>instead</em> of learning SQL anyway.</p>
<p>And all these SaaS products. Just to pick some tools from my company's stack:</p>
<ul>
<li>Splunk has <a href="https://www.splunk.com/en_us/resources/search-processing-language.html">SPL</a></li>
<li>Mixpanel has <a href="https://mixpanel.com/help/reference/jql">JQL</a></li>
<li>Rollbar has <a href="https://docs.rollbar.com/docs/rql">RQL</a></li>
<li>New Relic has <a href="https://docs.newrelic.com/docs/insights/nrql-new-relic-query-language/nrql-resources/nrql-syntax-components-functions">NRQL</a></li>
<li>Adwords has <a href="https://developers.google.com/adwords/api/docs/guides/awql">AWQL</a></li>
</ul>
<p>What's worse than data silos? Data silos that invent their own query language.</p>
<p>To be fair, some of these are SQL <em>flavors,</em> or at least pretends to be, but all with their own quirks that forces me to unlearn everything I knew about SQL to the point that it might as well be something completely different.</p>
<p>Then on top of that, every database seems to reinvent query languages. Mongo has its own <a href="https://docs.mongodb.com/manual/reference/sql-comparison/">terrible query language</a> that I never understood. Lucene has <a href="https://lucene.apache.org/core/2_9_4/queryparsersyntax.html">its own query language</a>. Etc.</p>
<p>What am I asking for? Not a whole lot. Just that:</p>
<ol>
<li>Every SaaS product should offer a plug-and-play thing so that I can copy all the data back into my own SQL-based database (in my case, Postgres/Redshift). I don't want to use their custom made DSL. Maybe European Union can mandate this as the next step after their <a href="https://en.wikipedia.org/wiki/Payment_Services_Directive">PSD2 open banking directive</a>.</li>
<li>There should be a 30 year moratorium on inventing new query languages.</li>
<li>Let's dispel with the myth that ORMs make code cleaner. Join the embedded-SQL movement and discover a much more readable, much more straightforward way to query databases.</li>
</ol>
<p><img src="https://erikbern.com/assets/dsls.png" alt="dsls"></p>
<p>That's it. I realize I sound like a old crank but that's a risk I'll take.</p>
<h2 id="addendum">Addendum</h2>
<p>This post got a fair amount of traffic so it must have resonated with a bunch people. See the <a href="https://news.ycombinator.com/item?id=17890760">Hacker News discussion</a> and the <a href="https://www.reddit.com/r/programming/comments/9bxwba/i_dont_want_to_learn_your_garbage_query_language/">Reddit r/programming</a> comments.</p>
<p>Update(2021): this made it to the Hacker News front page for a second time and generated <a href="https://news.ycombinator.com/item?id=26410047">some more discussion</a>.</p>
Business secrets from terrible people2018-08-16T00:00:00Zhttps://erikbern.com/2018/08/16/business-secrets-from-terrible-people.html<p>I get bored reading management books very easily and lately I've been reading about a wide range of almost arbitrary topics. One of the lenses I tend to read through is to see different management styles in different environments.</p>
<p>It turns out that some truly f—ng horrific people have <em>some</em> smart management ideas. This is not maybe surprising. If you have some twisted goals, you can't have incompetent leadership or you won't get anywhere. I mean, if you have a company like Google generating billions of dollars in cash flow every year, you could probably have almost <em>any</em> management style, and things will seem pretty fine. I find it a bit more impressive what it takes to run a crack-dealing gang consisting of 100s of poorly educated gangsters, trying to deal with supply shocks, fighting turf wars with neighboring gangs, and figuring the best way to keep the police at bay.</p>
<p>So what are some of the things we can learn? Keep reading:</p>
<h2 id="the-taliban">The Taliban</h2>
<p>This is mostly based on the book <a href="https://www.amazon.com/Counterinsurgency-David-Kilcullen/dp/0199737495">Counterinsurgency</a> by David Kilcullen.</p>
<p>So the Taliban were (obviously) bad people, who committed some <a href="https://en.wikipedia.org/wiki/Taliban">truly horrific crimes against humanity</a>. What's surprising reading about them, is to the degree civilians supported the Taliban. They may have been brutal, but they were somewhat just and provided many of the functions that the central government failed to provide:</p>
<p><em>[…] you may think of people having their hands cut off from stealing, women being stoned for adultery, beheadings, and so on. And that does happen. But in fact, the bulk of the work of these courts concerns what in the official system would be considered commercial or civil cases rather than than criminal ones. The Taliban courts issue title deeds and resolve land disputes, settle water and grazing disputes, handle inheritance and family law, and issue identify cards and even passports (in the name of the Islamic Emirate of Afghanistan). They deliver a local dispute resolution and mediation service, with a reputation for harsh but fair and swift justice.</em> (from the Counterinsurgency book)</p>
<p>So why did people support them? The impression I get, is that, sure, no one <em>likes</em> the Taliban, but at least they provided <em>some</em> kind of stability. Picture living in a mostly lawless society, where occasionally bands of thieves come and steal your harvest. In such a society, people would have a much stronger preference for <em>one</em> band of thieves living off the land, than <em>many</em>. It would then be in the self-interest of the thieves to “tax” the population in an optimal way (kind of like the <a href="https://en.wikipedia.org/wiki/Laffer_curve">Laffer curve</a>). Seeing states develop out of these primitive agreements to pilfer a little seems kind of plausible. (I remember reading a paper about the <a href="https://mason.gmu.edu/~atabarro/Lessons%20from%20Gurgaon.pdf">rise of Gurgaon</a> which sort of describes why it's so successful — it's a “monopoly of corruption” compared to other cities where many (uncoordinated) parties try to steal a little, leading to a worse outcome for everyone.)</p>
<p>What can we learn from them? There's a couple of things that stand out to me as smart moves by the Taliban (especially compared to the US military):</p>
<ul>
<li>They identified and targeted the influencer and key decision makers. The key decision makers were (a) the village elders (b) mullahs (a) teachers.</li>
<li>They understood what their pain points were and offered help, for instance <a href="https://landinfo.no/asset/3589/1/3589_1.pdf">offering protection against marauding local gangs</a>.</li>
<li>They listened to user feedback, at least ostensibly, by having a system to file formal complaints against the Taliban.</li>
<li>The Taliban seem reasonably pragmatic, despite their hardline image, often relenting to the villagers, and sheltering NGO projects when they were in the best interest of the local population.</li>
</ul>
<h2 id="theranos">Theranos</h2>
<p>This is mostly based on the book <a href="https://www.amazon.com/Bad-Blood-Secrets-Silicon-Startup/dp/152473165X">Bad Blood</a> by John Carreyrou.</p>
<p>Theranos was a fraud company. I'm still not sure if Elizabeth Holmes (CEO) <em>knew</em> what was going on. Was she delusional? Or an intentional fraudster? Or kept in the dark by her boyfriend/COO Sunny Balwani? Either way, what brought them into brief fame and glory was a super charismatic leader who relentlessly pushed a vision down the rank.</p>
<p>Holmes wanted it to be awesome, so she declared to the world that it was awesome and told her employees that it was awesome. If people dissented, they were done. Hire the worst lawyer scumbags you can ever think of, and ruin the lives of your former employees.</p>
<p>But I think the interesting story here is – how do you push a vision so hard that you end up fooling everyone? Setting a vision and insisting on it (even though you know it's bullshit) can take you <em>very</em> far. Maybe even far enough for reality to catch up with the vision.</p>
<p>Maybe Elizabeth Holmes pushing her vision was just like one of those management techniques where you tell an engineer “I bet you can make that code 10x faster” even though you have no clue if it's possible? Maybe in an alternate universe, the engineers would have finally figured it out? And until then, maybe her “reality distortion field” was an effective way to bootstrap the company? And maybe her super stubborn focus and charisma was the right way to get a ton of brilliant scientists to join, who eventually would have figured it all out?</p>
<p>What ultimately lead to the demise was the complete disconnect between the top and the bottom of the org chart. When vision goes in a one-directional flow, with no feedback loop tying it back, you're basically just running completely blind. When you're building a startup, the <em>tighter you can make the feedback loop, the faster you will innovate.</em> Elizabeth Holmes wasn't a part of any feedback loops. She clearly had no interest in what happened at her company.</p>
<p>More so, she seemed to have a complete lack of tact/class/style. From the book Bad Blood:</p>
<p><em>The resignations infurated Elizabeth and Sunny. The following day, they summoned the staff for an all-hands meeting in the cafeteria. Copies of The Alchemist, Paulo Coelho's famous novel about an Andalusian shepherd boy who finds his destiny by going on a journey to Egypt, had been placed on every chair. Still visibly angry, Elizabeth told the gathered employees that she was building a religion. If there were any among them who didn't believe, they should leave. Sunny put it more bluntly: anyone not prepared to show complete devotion and unmitigated loyalty to the company should get “the fuck out”.</em></p>
<h2 id="the-black-kings">The Black Kings</h2>
<p>This is based on the book <a href="https://www.amazon.com/Gang-Leader-Day-Sociologist-Streets/dp/014311493X">Gang Leader for a Day</a> by Sudhir Venkatesh.</p>
<p>The book follows a crack-dealing gang in Chicago. Similar to the Taliban, the gang enjoys a fair amount of support among the local population, due to their ability to deliver justice swiftly, and because the police doesn't do much for the population anyway. Some leadership lessons include</p>
<ul>
<li>Peace is much better for the business. Avoid fights with other gangs as much as possible. That's a negative-sum trade.</li>
<li>Avoid people dying from your product. That also draws negative attention.</li>
<li>How to you deal with rank-and-file employees who misbehave, for instance diluting the crack? There's an upside if done right, because these individuals might be entrepreneurial. So first time, given them a warning. Second time, beat the living daylight out of them.</li>
<li>How do you get people to work doing illegal things for almost no money? You give them a dream that one day, they can get to the top. This means that as a leader you need to be seen as successful. Of course, it's a Ponzi scheme, but people buy into it.</li>
<li>You can find Pareto efficient outcomes with almost any party. For instance, the local cops might agree to look the other way if you deal in one particular building staircase rather than at a schoolyard. This is positive-sum thinking.</li>
<li>To become a leader in the Black King organization, you <em>had</em> to go to college. The beauty of this is it avoids <a href="https://en.wikipedia.org/wiki/Adverse_selection">adverse selection</a> where people may seek to be leaders for prestige. By enforcing that future leaders have to go to school, Black Kings impose a certain bar that means future leaders are long-term thinkers and reasonably intelligent (qualities that schools select for as well).</li>
</ul>
<h2 id="al-qaeda">Al-Qaeda</h2>
<p>Mostly based on <a href="https://www.amazon.com/gp/product/159184682X/ref=dbs_a_def_rwt_hsch_vapi_taft_p1_i1">My Share of The Task</a> by Stanley McChrystal.</p>
<p>The most interesting takeaway I had about how Al-Qaeda operates from this book is that it was almost entirely decentralized. In fact, Al-Qaeda in Iraq was run by the lunatic <a href="https://en.wikipedia.org/wiki/Abu_Musab_al-Zarqawi">al-Zarqawi</a> who many times were <a href="http://www.washingtonpost.com/wp-dyn/content/article/2006/10/01/AR2006100101083.html?noredirect=on">reprimanded by the central organization</a> for going too far (in particular, targeting Shia muslims). They seem to have grudgingly let him do his thing, partly because the central organization seemed to have few ways to impose accountability.</p>
<p>The organizational model strikes me as fairly close to a business franchise, and apparently <a href="https://www.nytimes.com/2014/01/26/sunday-review/the-franchising-of-al-qaeda.html">I'm not the only</a> one that noticed this. The central organization provides a strong brand, produces propaganda, and has training facilities for new workforce. But on the grounds, it's the individual franchises that run things, with little control over the exact implementation.</p>
<p><a href="https://hbr.org/product/assessing-the-franchise-option/BH009-PDF-ENG">Quoting Harvard Business Review</a>, I think the Al-Qaeda model checks all of these boxes:</p>
<ol>
<li>The advantages of franchising include allowing the firm to overcome resource constraints of limited capital and thin the ranks of experienced managers.</li>
<li>Franchising also provides a means of trading off certain functions; franchisees are more efficient in performing functions whose average cost curve turns up relatively quickly.</li>
<li>It obviates the need for monitoring (and its attendant costs) because franchisees have invested their own capital and are motivated to work hard for profitability.</li>
<li>It offers substantial efficiencies in promotion and advertising by leveraging the value of a trademark and brand image.</li>
</ol>
<h2 id="post-scriptum">Post scriptum</h2>
<ul>
<li>I wish I had enough material to expand on more of these! Some of the more interesting leader I'd love to learn from would be Wehrmacht, Pablo Escobar, Baader-Meinhof, and Mao Zedong (in particular during the <a href="https://en.wikipedia.org/wiki/Long_March">Long March</a>).</li>
<li>It's been too long since my last blog post (two months) and I feel bad that this is something silly, non-technical, but this blog has always been an outlet for me to write about random silly things!</li>
<li>The title of this blog post was a nod to the (fictional) book Business Secrets from the Pharaohs, from Peep Show, the best TV series to come out of the UK.</li>
</ul>
<p><img src="https://erikbern.com/assets/business_secrets_of_the_pharaohs.jpeg" alt="pharaohs"></p>
New approximate nearest neighbor benchmarks2018-06-17T00:00:00Zhttps://erikbern.com/2018/06/17/new-approximate-nearest-neighbor-benchmarks.html<p>As some of you may know, one of my side interests is approximate nearest neighbor algorithms. I'm the author of <a href="https://github.com/spotify/annoy">Annoy</a>, a library with 3,500+ stars on Github as of today. It offers fast approximate search for nearest neighbors with the additional benefit that you can load data super fast from disk using mmap. I built it at Spotify to use for music recommendations where it's still used to power millions (maybe billions) of music recommendations every day.</p>
<p>Approximate nearest neighbor search is very useful when you have a large dataset of millions of datapoints and you learn some kind of vector representation of these items. Word2vec might be the most well known example of this, but there's plenty of other examples. For an introduction of this topic, check out an older series of blog posts: <a href="https://erikbern.com/2015/09/24/nearest-neighbor-methods-vector-models-part-1.html">Nearest neighbor methods and vector models</a>.</p>
<p>Anyway, at some point I got a bit tired of reading papers of various algorithms claiming to be the fastest and most accurate, so I built a benchmark suite called <a href="https://github.com/erikbern/ann-benchmarks">ann-benchmarks</a>. It pits a number of algorithms in a brutal showdown. I recently Dockerized it and wrote about it <a href="https://erikbern.com/2018/02/15/new-benchmarks-for-approximate-nearest-neighbors.html">previously on this blog</a>. So why am I blogging about it just three months later? Well…there's a lot of water under the bridge in the world of approximate nearest neighbors, so I decided to re-run the benchmarks and publish new results. I will probably do this a few times every year, at my own questionable discretion.</p>
<h2 id="changes">Changes</h2>
<p>There were several new libraries added to this benchmark:</p>
<ul>
<li><a href="https://github.com/yahoojapan/NGT">NGT-Panng</a> from Yahoo! Japan, a graph-based search structure</li>
<li><a href="https://github.com/lmcinnes/pynndescent">pynndescent</a> which is also a graph-based search algorithm, in fact based on the same paper as k-graph</li>
<li><a href="https://github.com/teemupitkanen/mrpt">MRPT</a> which is based on random projects, like Annoy.</li>
</ul>
<p>On top of that, hnsw are included in three different flavor, one as a part of <a href="https://github.com/nmslib/nmslib">NMSLIB</a>, one as a part of <a href="https://github.com/nmslib/nmslib">FAISS</a> (from Facebook) and one as a part of <a href="https://github.com/nmslib/hnsw">hnswlib</a>. I also dropped a few slow or semi-broken algorithms.</p>
<p>Another change this time was that I'm enforcing single-CPU queries. This made the benchmarks marginally slower, but I think it's the most “fair” way to compare. I think batching is not always applicable for real world application. Previously, I used a thread pool to saturate all CPUs on the instance, but there was some concern that this might affect certain algorithms in different ways. So I used Docker's ability to tie the container to a single CPU.</p>
<h2 id="results">Results</h2>
<p>Without further ado, here's the results for the latest run. For the glove-100-angular dataset:</p>
<p><img src="https://erikbern.com/assets/ann-benchmarks-2018-06/glove-100-angular.png" alt="glove 100 angular"></p>
<p>sift-128-euclidean</p>
<p><img src="https://erikbern.com/assets/ann-benchmarks-2018-06/sift-128-euclidean.png" alt="glove 100 euclidean"></p>
<p>nytimes-256-angular</p>
<p><img src="https://erikbern.com/assets/ann-benchmarks-2018-06/nytimes-256-angular.png" alt="nytimes 256 angular"></p>
<p>gist-960-euclidean</p>
<p><img src="https://erikbern.com/assets/ann-benchmarks-2018-06/gist-960-euclidean.png" alt="gist 960 euclidean"></p>
<h2 id="results-summarized">Results: summarized</h2>
<p>By now, you're probably squinting at charts to figure out which library is the best. To save you the pain, I'm just going to summarize it into a somewhat subjective list:</p>
<ol>
<li>hnsw(nmbslib)</li>
<li>hnswlib</li>
<li>hnsw(faiss)</li>
<li>kgraph</li>
<li>NGT-panng</li>
<li>pynndescent</li>
<li>SW-graph(nmslib)</li>
<li>annoy</li>
<li>flann</li>
<li>BallTree(nmslib)</li>
<li>mrpt</li>
<li>rpforest</li>
</ol>
<p>The various flavors of hnsw are all at the top, but that's partly because they were all built by the same person, <a href="https://github.com/yurymalkov">Yury Malkov</a> with <a href="https://arxiv.org/abs/1603.09320">a paper</a> describing the approach.</p>
<p>pynndescent and kgraph are both based on <a href="http://wwwconference.org/proceedings/www2011/proceedings/p577.pdf">the same paper</a> so it's not surprising their performance is fairly similar.</p>
<p>For some reason, MRPT would crash when I ran it on angular data, and I gave up after some time investigating it. Hopefully next benchmark will feature MRPT for angular data as well.</p>
<p>There's more goodies! <a href="https://github.com/maumueller">Martin Aumüller</a> and <a href="https://github.com/ale-f">Alexander Faithfull</a> have contributed code to export all the results to a website. <a href="http://vectors.erikbern.com/">I put it up on a temporary URL</a> for you to enjoy.</p>
<p>That's it! <a href="https://github.com/erikbern/ann-benchmarks">ann-benchmarks</a> <del>currently has almost 500 stars on Github, so I'd love it if you can pay it a visit and who knows… starring a repo just takes a second. Just saying!</del> just passed 500 stars on Github, meaning it's a legitimate project now! 🎉</p>
Missing the point about microservices: it's about testing and deploying independently2018-06-04T00:00:00Zhttps://erikbern.com/2018/06/04/missing-the-point-about-microservices.html<p>Ok, so I have to first preface this whole blog post by a few things:</p>
<ol>
<li>I really struggle with the term <em>microservices</em>. I can't put my finger on exactly why. Maybe because the term is hopelessly ill-defined, maybe because it's gotten picked up by the hype train. Whatever. But I have to stick to some type of terminology so let's just roll with it.</li>
<li>This blog post might be mildly controversial, but I'm throwing it out there because I've had this itchy feeling for so long and I can't get rid of it. I respect it if you want to disagree vehemently, and maybe there's something both of us can learn.</li>
<li>I have a weird story. My first “real” company, Spotify, used a service-oriented architecture from scratch. I also spent some time at Google which used a service-oriented architecture. So basically since 2006 I've been continuously working in what people now call a “microservice architecture”. It didn't even <em>occur</em> to me that some people might want to build things as <em>monoliths</em>. So I guess I'm coming at it from a different direction than many other. Either way, there were particular non-standard reasons why Spotify and Google had to do this that I'll get back to later.</li>
</ol>
<p>Let's start by talking about iteration speed!</p>
<h2 id="whats-up-with-iteration-speed">What's up with iteration speed!</h2>
<p>I'm sort of obsessed about iteration speed. I've <a href="/2017/07/06/optimizing-for-iteration-speed.html">written about this</a> in the past and it deserves more posts in the future, but the quick summary is that iteration speed is always going to be the strongest competitive advantage in this industry. You can't really patent anything and proprietary technology is often much less valuable than companies would like to admit. So what do you do? You start shipping new feature quicker, you learn faster from users, and you run faster than your competitors (a.k.a. the <a href="https://stratechery.com/2017/snaps-apple-strategy/">“gingerbread man strategy”</a>).</p>
<h2 id="lets-talk-about-testing-and-deploying">Let's talk about testing and deploying</h2>
<p>There's of course many ways we can iterate faster, but for today let's focus on two particular aspects of it: <em>testing and deploying more often.</em> I'm a big proponent of continuous deployment. I'm also a huge proponent of fast test suites. Why? You have been reading this far without any graphics so you deserve one. Tracing back all the dependencies and how it fits together, it looks like something like this in my head:</p>
<p><img src="https://erikbern.com/assets/test_cycle.png" alt="test cycle"></p>
<p>So it seems like we could improve a lot of things if we could test and deploy things faster! Of course, there's a long series of steps to get there:</p>
<ol>
<li>Do you have fully automated tests? If not, write them, then come back.</li>
<li>Are deploys automated? If not, do them, then come back.</li>
<li>Are you deploying multiple times per day? If not, figure out how to get there, then come back.</li>
</ol>
<p>Anyway, if only there was a “trick” to test and deploy things faster… maybe splitting things up into small independent units… if only there was a way 🤔</p>
<h2 id="98-of-microservice-benefit-is-being-able-to-test-and-deploy-independently">98% of microservice benefit is being able to test and deploy independently</h2>
<p>By now it should be clear why splitting things up makes sense. But just as xy=0 when y=0 regardless of how large x is, don't expect that you can just breaking your sweet old monolith up into two services and derive tremendous value from that. It's rarely very valuable <em>unless you can test and deploy those parts independently:</em></p>
<p>Here's where I see so many blog posts where people are <em>missing the point:</em></p>
<ul>
<li>If you need to deploy two services to production in tandem, you're doing things wrong</li>
<li>If you need to run two services together in order to run tests, you're doing things wrong</li>
<li>If you end up with a microservice that can't be tested in isolation, you're doing things wrong</li>
<li>If you end up with a microservice that can't be deployed in isolation, you're doing things wrong</li>
</ul>
<p>Why are you doing wrong things? Because you're putting in <em>tons</em> of work separating out things into independent units, <em>without reaping the benefits of fast testing and deploying cycles</em>.</p>
<h2 id="of-course-things-get-harder">Of course, things get harder</h2>
<p>I'm not going to dwell on this and there's much that has been written, including <a href="https://plus.google.com/+RipRowan/posts/eVeouesvaVX">Steve Yegge's epic rant</a>. Testing things in isolation means each part needs to make assumptions about how the other parts will behave and mock them out properly. Deploying a new version of an API call can be annoying and has to be done in multiple smaller steps. Tracing requests can be a massive pain. I could go on all day.</p>
<p>But as Americans are fond of saying, <em>there are no free lunches.</em></p>
<h2 id="some-questionable-reasons-to-consider-microservices">Some questionable reasons to consider microservices</h2>
<p>I mentioned 98% of the value is being able to test and deploy things independently? I think the other benefits are fairly marginal at best:</p>
<ol>
<li><em>Writing services in different languages.</em> I think this argument is mostly invoked by some junior dev who wants to implement a new system in Clojure. Great news for the poor person waking up at 2am getting paged because the shopping cart service is down.</li>
<li><em>Forcing applications into independent pieces so they don't sprawl into cobwebs of interdependencies.</em> I used to think this was a super strong argument! But clearly, some huge monolithic code bases are great. The Linux kernel shows that you can write highly modular code, all inside a single process (actually, the <a href="https://groups.google.com/forum/#!topic/comp.os.minix/wlhw16QWltI%5B1-25%5D">Torvalds-Tennenbaum flame war from 1992</a> is still highly relevant)</li>
<li><em>Scaling two pieces of software independently.</em> Not necessarily a strong reason, since you can also scale up a fat binary – look at Facebook.</li>
<li><em>Breaking up software with different performance characteristics.</em> This could occasionally be a valid argument, say if you have a Node-based webserver and you need to do something CPU heavy. But could in many cases be solved by something like background threads or “modes” – the same codebase is run both for worker processes and web server processes.</li>
</ol>
<h2 id="summary">Summary</h2>
<p>I'm obsessed with iteration speed and could write about 17 more blog posts about it. If there are any takeaways I want to leave you with, it's these</p>
<ul>
<li>Automated testing is awesome.</li>
<li>Continuous deployment is really sweet.</li>
<li>Do those two things first.</li>
<li>Once you see engineers starting to twiddle thumbs waiting for tests to run, you know the time is right to split things up.</li>
<li>Microservices can be awesome for this.</li>
<li>Keep splitting until you no longer see engineers twiddling thumbs and all tests blazingly fast.</li>
<li>Lean back, relax, and watch your company out-iterate all your competitors through a superior development process.</li>
</ul>
<p><img src="https://erikbern.com/assets/ninja.gif" alt="ninja"></p>
Interviewing is a noisy prediction problem2018-05-02T00:00:00Zhttps://erikbern.com/2018/05/02/interviewing-is-a-noisy-prediction-problem.html<p>I have done roughly 2,000 interviews in my life. When I started recruiting, I had so much confidence in my ability to assess people. Let me just throw a couple of algorithm questions at a candidate and then I'll tell you if they are good or not!</p>
<p>Over time I've come to the (slightly disappointing) realization that <em>knowing who's going to be good at their job</em> is an <em>extremely hard problem.</em> The correlation between who <em>did really well in the interview process</em> and who <em>performs really well at work</em> is really weak.</p>
<p>Confronted by this observation I've started thinking about this process as inherent noise reduction problem. Interviewing should be thought of as information gathering. You should consciously design the process to be the most predictive of future job performance. Given that you have limited time to measure, you need spend your time measuring things that have <em>high signal-to-noise ratio</em> and things that have <em>low correlation</em> with each other.</p>
<h2 id="interviewing-as-a-prediction-problem">Interviewing as a prediction problem</h2>
<p><img src="https://erikbern.com/assets/job-interview-devil-wears-prada.jpeg" alt="devil wears prada">
<em>Job interview scene from Devil Wears Prada (2006)</em></p>
<p>Let's start by stating the problem. We're trying to predict <em>job performance</em> from a series of measurements (interviews). Those measurements are <em>noisy</em> meaning that any individual measurement is not very predictive in itself, but hopefully all of them taken in aggregate can be predictive. We can also <em>choose</em> what we want to observe ahead of time, by coming up with an interview process where we think the aggregate judgement correlates the most with job performance. So we can choose to spend one hour on system design, one hour on algorithms, etc.</p>
<p><em>If</em> we had complete data about candidates and their future job performance, it would look something like this</p>
<table>
<thead>
<tr>
<th></th>
<th align="right">Algorithms</th>
<th align="right">System design</th>
<th align="right">Grades</th>
<th align="right">Github portfolio</th>
<th align="right">Actual job performance</th>
</tr>
</thead>
<tbody>
<tr>
<td>Abdullah</td>
<td align="right">5</td>
<td align="right">4</td>
<td align="right">2</td>
<td align="right">3</td>
<td align="right">5</td>
</tr>
<tr>
<td>Barbara</td>
<td align="right">1</td>
<td align="right">5</td>
<td align="right">1</td>
<td align="right">1</td>
<td align="right">3</td>
</tr>
<tr>
<td>Chloe</td>
<td align="right">2</td>
<td align="right">3</td>
<td align="right">5</td>
<td align="right">2</td>
<td align="right">2</td>
</tr>
<tr>
<td>David</td>
<td align="right">4</td>
<td align="right">1</td>
<td align="right">4</td>
<td align="right">5</td>
<td align="right">4</td>
</tr>
<tr>
<td>…</td>
<td align="right">…</td>
<td align="right">…</td>
<td align="right">…</td>
<td align="right">…</td>
<td align="right">…</td>
</tr>
</tbody>
</table>
<p>There's many simplifications of thinking about it this way. For instance, we don't necessarily know the <em>actual job performance</em> until they already got hired and worked with us (and even then, that's a hard problem to estimate, but a <em>separate</em> hard problem). But let's stick to this way of thinking because it will become useful later. Note that it's not just a table, it's also a matrix! I will get back to this and do some magic linear algebra on it later.</p>
<p>Restating interviewing as a prediction problem might seem like a super obvious thing, but I think people often forget this point. I've read about 1,000 Hacker News comments complaining that interview questions about turning a binary tree upside down (or whatever) are stupid because no one would ever do that, or there's already a library for it, or something else. I think that's completely besides the point! The real question is: <em>does solving a problem about turning a binary tree upside down predict future job performance?</em></p>
<p>Interviewing is tricky – you only have a few hours to collect measurements. I have no moral objection against asking “unrealistic” questions, as long as I have some reasonable expectation that they predict future job performance. In fact, I think any sort of interviewing is going to be unrealistic, and I'm very happy that there are <em>some</em> decent ways to evaluate the performance of engineers. I have no idea of how carpenters hire carpenters or how investment bankers hire investment bankers, but I wouldn't be surprised to hear that their interview process they have is far less objective.</p>
<h2 id="the-depressing-science-on-interviews">The depressing science on interviews</h2>
<p>Let's review research and see what measurements to pick that are most predictive. Turns out there's a bit of research suggesting interesting things. One thing that almost all research seems to indicate is that overall, <em>interviewing is a lot less predictive than we want it to be</em>.</p>
<ul>
<li><a href="https://www.researchgate.net/profile/Stephanie_Payne2/publication/229503170_The_Incremental_Validity_of_Interview_Scores_Over_and_Above_Cognitive_Ability_and_Conscientiousness_Scores/links/545a551c0cf25c508c307d7a.pdf">Cortina, Goldstein et. al. (2000)</a> find that highly structured interviews add some signal on top of testing cognitive ability + conscientiousness, but that unstructured interviews are almost useless.</li>
<li><a href="http://blogg.hrsverige.nu/wp-content/uploads/2010/04/Stubborn1.pdf">Highhouse (2008)</a> finds that interviewers <em>perceive</em> of unstructured interviews as the <em>most</em> predictive, and intelligence tests as the <em>least</em> predictive, although the estimated actual effectiveness is actually the opposite.</li>
<li>The jury is still out whether grades predict much: <a href="https://qz.com/382570/goldman-sachs-actually-google-gpas-arent-worthless/">Google claims no</a> and <a href="http://blog.alinelerner.com/lessons-from-a-years-worth-of-hiring-data/">this blog post</a> sees no relationship between grades and interview performance, whereas <a href="http://www.pnas.org/content/113/47/13354.abstract">this paper</a> claims that grades are more predictive of “important life outcomes than IQ”.</li>
<li>Some recent news articles include <a href="https://www.bloomberg.com/view/articles/2016-11-04/job-interviews-are-useless">Bloomberg calling interviews useless</a>, <a href="https://www.nytimes.com/2017/04/08/opinion/sunday/the-utter-uselessness-of-job-interviews.html">NYT calling them utterly useless</a>, and <a href="https://www.theguardian.com/lifeandstyle/2015/nov/22/why-job-interviews-are-pointless">The Guardian calling them pointless</a>. To be clear, they all attack the <em>unstructured</em> interview.</li>
</ul>
<p>A few studies seem to at least call out intelligence as a decent predictor:</p>
<ul>
<li><a href="http://citeseerx.ist.psu.edu/viewdoc/download?doi=10.1.1.459.1742&rep=rep1&type=pdf">Vinchur and Shlippmann (1998)</a> performs a meta-analysis on sales data and find that <em>“general cognitive”</em> ability is the strongest predictor for job rating, although a weak one for sales (N = 1200)</li>
<li><a href="http://www.hucama.se/uploads/1/6/5/0/16501994/g-factor_intellligence_1998.pdf">Gottfredson (1998)</a> finds that IQ is a good predictor for life outcomes overall.</li>
<li><a href="http://www.unc.edu/~nielsen/soci708/cdocs/Schmidt_Hunter_2004.pdf">Schmidt and Hunter (2004)</a>: <em>General mental ability predicts both occupational level attained and performance within one’s chosen occupation and does so better than any other ability, trait, or disposition and better than job experience</em> (here's <a href="https://80000hours.org/2013/05/intelligence-matters-more-than-you-think-for-career-success/">a summary</a> of a lot of the work by the authors).</li>
</ul>
<p>I'm not a scholar and I can't claim to have done an extensive literature review, but here's my biased summary:</p>
<ol>
<li>Intelligence tests seem to be the strongest predictors of job performance (although possibly offensive, and probably <a href="https://en.wikipedia.org/wiki/Griggs_v._Duke_Power_Co.">illegal in the US</a>)</li>
<li>… followed by structured interviews</li>
<li>… followed by unstructured interviews (which have very little predictive power).</li>
</ol>
<h2 id="picking-the-measurements-that-matter-the-most">Picking the measurements that matter the most</h2>
<p>Let's focus for a second on what measurements matter the most. Since we can't measure actual job performance, we need to measure other skills. Those measurements will be highly noisy. So we need to find measurements that (a) are decent proxies (b) have as high signal-to-noise ratio.</p>
<p>I don't have a grand unified theory here. But I have a long list of ideas I think are helpful.</p>
<h3 id="bad-interview-signals">Bad interview signals</h3>
<ul>
<li>Judging by the literature review earlier in this post, <em>unstructured interviews</em> are almost useless. Avoid them.</li>
<li>Some interview questions spend 60 minutes focusing on a problem that relies on a single insight to solve. That's extremely low signal-to-noise ratio! Try to avoid such problems.</li>
<li>Likewise, avoid long interview questions depend on some kind of “trick” or “insight”. You get basically 1 bit of information out of this question.</li>
<li>You want the highest signal-to-noise ratio, so you should design your interview to make the <em>candidate</em> talk as much as possible. Besides the time set aside for questions, the candidate should do 80-90% of the talking, not the interviewer. Every minute the interviewer spends talking is opportunity cost!</li>
<li>However, it's important the interviewer keeps driving the discussion. If the candidate is talking about something and it veers off into tangential territory, you need to bring it back asap. Again, opportunity cost!</li>
<li>Certain signals like “having a great Github portfolio” can be great signals, but have tons of false negatives. Meaning that the presence of those signals can be great, but the <a href="https://www.benfrederickson.com/github-wont-help-with-hiring/">absence isn't necessarily a big deal</a>. I've hired many amazing engineers that had absolutely nothing on their Github, and that's fine!</li>
<li>I'm a bit skeptical of live coding as an interview, mostly because it's hard to do without forcing a certain environment or methodology onto a developer. As a result, you end up measuring mostly how familiar they are with the environment. But maybe it could be done well for certain tasks.</li>
<li>I don't think algorithms on a whiteboard are great, but mostly because <em>they take so much time</em>. Asking a candidate to implement <a href="https://en.wikipedia.org/wiki/Levenshtein_distance">Levenshtein distance</a> can take up a full hour, and again, the opportunity cost matters. Quick algorithm questions (max 5-10 min) can be fine, although another concern I have with algorithm questions is that junior CS grads score well for no other reason than having their algo class fresh in mind.</li>
<li>I'm not a big fan of take-home projects. They hurt people with families and commitments. It also tends to increase dropoff for the people that are in highest demand, which is exactly the people you don't want to lose. I still do homework assignments for a few roles where I haven't found a better interview format, but we limit them to 3-5 hours and we <em>pay for them.</em></li>
<li>Cultural interviews and using the “beer test” is great if you want to hire people for no other reason than they are similar to you. I don't do them. If a candidate is a wacko, you'll notice it anyway. I do take candidates out for lunch as a way for them to get to know us, but there's no evaluation going on.</li>
<li>I find questions like “what are your weaknesses” or “what is your superpower” to be silly. A good answer just means the candidate is verbal and can ramble on the spot. It favors verbal extroverted people without reflecting on their actual skills.</li>
<li>I don't think knowing a lot of obscure features of a particular language is super useful. Good engineers know a bunch of languages and can pick up new languages quickly. If you're interviewing for a backend role, don't spend 60 minutes probing into C++ template metaprogramming. The main exception to this rules is roles that are obviously tied to a particular tool (like CSS for frontend engineers).</li>
</ul>
<h3 id="good-interview-signals">Good interview signals</h3>
<ul>
<li>While I don't like long problems that rely on knowing a certain trick, I think it's great to have <em>many short interview questions</em> that rely on knowing particular things. If you can go through 20 such problems in one single interview, you increase the signal-to-noise ratio a lot!</li>
<li>I've experimented with many types of interviews, but one thing I really dig lately is <em>code reading</em>. I print out 10-15 code snippets (not just code, but also UNIX commands, regular expressions, SQL queries and many other things). I then go through and ask: what does this snippet do, how does it work, are there any bugs, etc.? Reading code (as opposed to writing) means I can cover a <em>lot</em> of ground extremely quickly, spending no more than a minute or two on each problem.</li>
<li>Homework assignment <em>can</em> be OK, although I think it's important to limit them to 3-5 hours, and definitely pay for them!</li>
<li>Consulting agreements (with the intent to hire) are great for the people that have that flexibility. It gives an opt-out on both sides after a certain time period.</li>
<li>I like system design questions (“how would you build this feature”). Anecdotally they seem to capture experience quite well.</li>
<li>While I'm skeptical about going deep into a <em>particular</em> language's features, I think it can be a good idea to cover many <em>different</em> languages and their features. Not everyone is proficient in every language, but decent engineers have at least one or two languages that they have a deeper knowledge of.</li>
<li>…however, some roles are intimiately tied to one particular tool (like frontend engineers and JavaScript). In that case I think it actually does make sense to ask about a lot of obscure language features! But to get the highest possible signal-to-noise ratio, ask 20 different questions and don't spend more than a minute or two on each.</li>
<li>I have had some decent success using online coding tests like <a href="https://www.hackerrank.com/">Hackerrank</a>. They skew way too algorithmic IMO, but so far they seem to be a fairly good predictor of future job performance. The main issue is that senior candidates often find it offensive to do these tests, so I usually reserve them for more junior candidates.</li>
<li>I'm skeptical about trying to assess communication skills directly, but I do think there's a certain “clarity of thought” that intelligent people exhibit.</li>
<li>While the absense of cool projects on Github is not a big deal, the <em>presence</em> of projects is a very positive signal to me. Same goes with open source contributions, blog posts, or other things.</li>
<li>There's another 100 things I could list about how I evaluate a candidate's resume, but I think in the interest of brevity I'll leave it for another blog post!</li>
<li>A final word on intelligence tests. Literature suggests that they can have decent predictive power. I think “brain teasers” can work as a proxy for intelligence tests. I've never used them during interviews but I'd imagine they might have a certain place, like maybe if you're interviewing for a weird role where there's literally nothing else that you can measure. I don't think we should categorically throw them out.</li>
</ul>
<h2 id="combining-measurements">Combining measurements</h2>
<p><img src="https://erikbern.com/assets/job-interview-office-space.jpeg" alt="office space">
<em>Job interview scene from Office Space (1999)</em></p>
<p>Going back to the table of interview rankings and let's introduce some math. Stay calm, the math is not harmful! If you are squeamish about math, feel free to skim.</p>
<p>Let's assume all the entries in the matrix are known, and that we are trying to find the best linear combination $$ \beta_1, \beta_2, \ldots \beta_k $$ that predicts the <em>future job performance</em> the best. One way you can phrase this problem is to say you want the $$ \beta $$'s that minimize the quadratic error. This is a classic linear regression problem:</p>
<p>$$ \min_\beta \left( y - \mathbf{M}\beta \right)^2 $$</p>
<p>The matrix $$ \mathbf{M} $$ is the matrix with interview scores, i.e.</p>
<p>$$\mathbf{M} = \left( \begin{matrix}
5 & 4 & 2 & 3 \\<br>
1 & 5 & 1 & 1 \\<br>
2 & 3 & 5 & 2 \\<br>
4 & 1 & 4 & 5 \\<br>
\ldots & \dots & \ldots & \ldots
\end{matrix} \right) $$</p>
<p>And the vector $$ y $$ is the vector of actual job performance, i.e.</p>
<p>$$ y = \left( \begin{matrix} 5 & 3 & 2 & 4 & \ldots \end{matrix} \right)^T $$</p>
<p>This isn't a particularly hard problem from a mathematical point of view to solve (it even has a <a href="https://en.wikipedia.org/wiki/Ordinary_least_squares#Estimation">closed form solution</a>). But it's going to be super noisy! Why?</p>
<ol>
<li>We don't have much complete data, not substantially more than the number of people you ever hired.</li>
<li>Each interview is a super noisy measurement of the underlying ability.</li>
<li>You only collected data for the handful of interview types that you have been focusing on. Everything else is unknown.</li>
<li>There's a tricky survivor bias where we only observe the $$ y $$ for the people that we hire. This can lead to weird patterns due to something called <a href="https://en.wikipedia.org/wiki/Berkson%27s_paradox">Berkson's paradox</a> (like when <a href="https://erikbern.com/2015/04/07/norvigs-claim-that-programming-competitions-correlate-negatively-with-being-good-on-the-job.html">Google noticed that programming competitions were negatively correlated with job performance</a>).</li>
</ol>
<p>So how can we combine signals more efficiently?</p>
<ol>
<li>We should try to pick interviews that are proxies that have <em>little correlation with each other</em>. If we do two interviews that have absolutely no correlation, but each of them is a proxy for actual job performance, then the aggregate error decreases.</li>
<li>If you have no idea which interviews are predictive, at least it seems reasonable to assume that at least all $$ \beta \ge 0 $$, i.e. no interview is negatively correlated with future job performance. From that point of view, it makes sense to try to cover <em>as many different topics as possible</em>. A bunch of them might not say anything about future job performance, some of them do, you don't know which ones so why not cover many different topics?</li>
<li>There's an inherent <a href="https://en.wikipedia.org/wiki/Bias%E2%80%93variance_tradeoff">bias-variance tradeoff</a>. It might be worth lowering the error a bit while introducing a bit more bias. This actually gets interesting when you think about the risk aversity that different companies may have.</li>
</ol>
<ul>
<li>A large company like Google might actually afford to be a lot more risky. They can hire effectively for the expected value. For them, putting all their weight on a few things that correlate the most with job performance (intelligence test and various proxies for it, like algorithm puzzles).</li>
<li>A small startup might be super risk averse. The cost of hiring the wrong person is super high because it can completely derail their momentum. So they might hire for some expected risk-adjusted function of the future job performance. This effectively ends up distributing the $$ \beta $$ weights over <em>more</em> interviews. So rather than going all in on one or two interviews, it might be wise to focus on <em>many different things</em>. And I literally mean something like: spend 10 minutes on regular expressions, 10 minutes on HTML, 10 minutes on functional programming, 10 minutes on SQL, 10 minutes on AWS, etc. etc.</li>
<li>This also reminds me of <a href="https://en.wikipedia.org/wiki/Portfolio_optimization">portfolio optimization</a>. If you can tolerate more risk, invest everything in stocks. If you are risk averse, hedge your bets and diversify over many asset classes.</li>
</ul>
<h2 id="staying-objective">Staying objective</h2>
<p>Humans are prone to <a href="https://en.wikipedia.org/wiki/Confirmation_bias">confirmation bias</a>. We subconsciously form an opinion about things, and let that influence our decision making. <em>This is dangerous!</em> You start to like a particular candidate a lot for whatever superficial reason, you drop your guard, start giving them a bit more hints or give them the benefit of the doubt in a way that some other candidate wouldn't get.</p>
<p>The main remedy is to have a structured interview process. If everyone goes through (roughly) the same questions, your judgement becomes more objective. The benefit isn't just that it's more fair and you're not perpetuating biases – you also end up hiring better talent.</p>
<p>There's a separate trick I have for trying to make more neutral judgement is to ask myself: <em>what would I have to see in order for me to change my mind about this candidate?</em> If I start out super excited about a candidate, and they nail three questions in a row about system design, then I try to bring out devil's advocate: maybe this person lacks something else? And I switch to some completely different topic, like regular expressions or UNIX commands. Conversely if someone doesn't do well, think of a hypothetical question where they might win you back. Always try to poke holes in your own judgement.</p>
<p>Side note, but a fascinating study on objective interviews is how <a href="http://gap.hks.harvard.edu/orchestrating-impartiality-impact-%E2%80%9Cblind%E2%80%9D-auditions-female-musicians">blind orchestra auditions</a> became prevalent a few decades ago.</p>
<h2 id="sanity-checking-your-interview-process-would-your-best-engineers-do-well">Sanity checking your interview process: would your best engineers do well?</h2>
<p><img src="https://erikbern.com/assets/job-interview-trainspotting.jpeg" alt="trainspotting">
<em>Job interview scene from Trainspotting (1996)</em></p>
<p>I have mentioned a lot of interview formats that I think are better than others. On top of that, the most critical thing is that you <em>learn</em> from your interviews and continuously refine your interview set up. Over time, look at the people that you hired and ask yourself, <em>what are the strongest predictors of future job performance?</em></p>
<p>I find this to be a powerful sanity check. Look at the best engineers in your company and try to picture them going through your interview process. Would they do extremely well in the process? Conversely, would the low performance engineers do worse? Or you can also look at the current top performers at your company, and ask yourself: <em>what type of interview would have selected these people?</em> If your interview process would have filtered out your best engineers, then you should probably reevaluate the process.</p>
<h2 id="some-final-thoughts">Some final thoughts</h2>
<p>Interviewing is one of those things where every year I realize how much I sucked at it a year ago. I think my ability to predict future job performance has increased over time, but more importantly I've learned the hard way how <em>hard it is.</em> If I were to write this same blog post in a year, I'm sure it will look slightly different. As many other things, the most important thing is to keep learning and iterating.</p>
<h2 id="addendum-2018-06-04">Addendum (2018-06-04)</h2>
<p><a href="https://twitter.com/marcusf">Markus Frödin</a> pointed out a <a href="https://testingtalent.com/wp-content/uploads/2017/04/2016-100-Yrs-Working-Paper-on-Selection-Methods-Schmit-Mar-17.pdf">well-written meta-analysis</a> that revisits a lot of the job performance prediction literature and arrive at slightly different findings. Their main contribution is to correct for the “range restriction” problem – the bias you get from only measuring the people you hire. Their top predictor is intelligence tests, interestingly followed by “integrity tests”. Unstructured and structured interviews have fairly similar strength.</p>
<p>If I interpret the results correctly, maybe unstructured interviews <em>are</em> useful, but people put <em>too much weight</em> on them. That would cause the correlation between interview performance job performance in the <em>hired</em> group to be zero, even though it could be possible across the whole population. Alternatively, unstructured interviews might be a great way to <em>turn down candidates</em>, but maybe not discern among the “good enough” group. Anyway, my approach is always evolving!</p>
Waiting time, load factor, and queueing theory: why you need to cut your systems a bit of slack2018-03-27T00:00:00Zhttps://erikbern.com/2018/03/27/waiting-time-load-factor-and-queueing-theory.html<p><img src="https://erikbern.com/assets/queue.jpeg" alt="queue"></p>
<p>I've been reading up on operations research lately, including <a href="https://en.wikipedia.org/wiki/Queueing_theory">queueing theory</a>. It started out as a way to understand the very complex mortgage process (I work at <a href="https://better.com/">a mortgage startup</a>) but it's turned into my little hammer and now I see nails everywhere.</p>
<p>One particular relationship that turns out to be somewhat more complex is the relationship between <em>cycle time</em> and <em>throughput</em>. Here are some examples of situations where this might apply:</p>
<ul>
<li>What's a good CPU load for a database? If the CPU load is 50%, how much does that impact latency vs if CPU load is 25%?</li>
<li>What's the average time it takes to respond to an email as a function of how busy I am?</li>
<li>What's the relationship between the tech team's throughput (in terms of Trello cards per day or whatever) and the cycle time (time from adding a card until it's done)?</li>
<li>If we need an loan to be underwritten in at most 2 days, how many underwriters do we need?</li>
<li>I need to book a meeting with my manager. His/her calendar is 80% full. All meetings are 1h and s/he works 40h/week. How far out am I going to have to book the meeting?</li>
<li>Same situation as above but I need to book a meeting with 5 people, all having 80% full calendars (that are independent of each other). How far out?</li>
<li>Users file bugs to the developer. Assuming we put 1 developer full time on triaging/solving incoming bugs, and that keeps the person x% busy, what's the time until a bug gets resolved?</li>
</ul>
<p>In all these cases, it turns out that <em>running a system at a lower throughput can yield dramatic cycle time improvements</em>. For instance me being just “kind of busy” 😅 vs SUPER SWAMPED 😰 anecdotally impacts my email response time easily by 5-10x.</p>
<p>I've <a href="/2017/07/06/optimizing-for-iteration-speed.html">written about this in the past</a> but in an almost mythical way – I didn't understand the math behind these principles.</p>
<p>First of all, the relationship might seem nonsensical. If you have a garden hose, the throughput of the hose (liter/s water) is completely independent of the cycle time (the <em>length</em> of the hose). If a database can handle 1000 queries per second, and we're currently doing 500 queries/s (so 50% load), why is the latency higher than if we're doing 100 queries/s (10% load?)</p>
<p>The reason, like much else in life, is <em>variability</em>. If the database can be thought of as a worker that can handle exactly one query at a time, there's going to be a queue that at any time has any nonnegative number of queries in it. The number of queries sitting in the queue will vary over time. Due to chance, we might have a 10 queries that arrive at almost the same time. In that case the worker will have to process each query serially and work its way through the queue.</p>
<p>As it turns out, we can simulate this fairly easily using <a href="https://en.wikipedia.org/wiki/Dynamic_programming">dynamic programming</a>. Let's say the time between queries are <a href="https://en.wikipedia.org/wiki/Exponential_distribution">exponentially distributed</a> and the time of the query itself is <a href="https://en.wikipedia.org/wiki/Log-normal_distribution">log-normally distributed</a> (the exact distributions here aren't super important, but there are some good reasons to model the world using those ones). You can simulate the whole system doing something like this:</p>
<div class="highlight"><pre style="color:#f8f8f2;background-color:#272822;-moz-tab-size:4;-o-tab-size:4;tab-size:4"><code class="language-python" data-lang="python">query_enqueued <span style="color:#f92672">=</span> numpy<span style="color:#f92672">.</span>cumsum(numpy<span style="color:#f92672">.</span>random<span style="color:#f92672">.</span>exponential(
size<span style="color:#f92672">=</span>(n,), scale<span style="color:#f92672">=</span><span style="color:#ae81ff">1.</span><span style="color:#f92672">/</span>k))
query_time <span style="color:#f92672">=</span> numpy<span style="color:#f92672">.</span>random<span style="color:#f92672">.</span>lognormal(size<span style="color:#f92672">=</span>(n,))
query_finished <span style="color:#f92672">=</span> numpy<span style="color:#f92672">.</span>zeros((n, ))
<span style="color:#66d9ef">for</span> i <span style="color:#f92672">in</span> range(n):
query_finished[i] <span style="color:#f92672">=</span> query_enqueued[i] <span style="color:#f92672">+</span> query_time[i]
<span style="color:#66d9ef">if</span> i <span style="color:#f92672">></span> <span style="color:#ae81ff">0</span>:
<span style="color:#75715e"># Can't finish before the previous query finished</span>
<span style="color:#75715e"># plus the time for this query</span>
query_finished[i] <span style="color:#f92672">=</span> max(
query_finished[i],
query_finished[i<span style="color:#f92672">-</span><span style="color:#ae81ff">1</span>] <span style="color:#f92672">+</span> query_time[i])
</code></pre></div><p>If you run this snippet with different values for k and plot the latency as a function of load factor, you get a chart that's super interesting (in my opinion!):</p>
<p><img src="https://erikbern.com/assets/wait-time.png" alt="wait time"></p>
<p>At 50% utilization, you get twice the latency that you do with 0% utilization. Once you start hitting say 80% utilization then it goes up. And it goes up FAST. Getting towards 100% utilization, the asymptote here is the vertical line.</p>
<p>If you want to optimize for higher-percentiles (such as 90th or 99th) then just a little bit of load pushes the latencies up a LOT. Basically you are forced to run the system at a really low load factor to have some leeway.</p>
<p>The system described above is called an <a href="https://en.wikipedia.org/wiki/M/G/1_queue">M/G/1</a> using fancy notation. Turns out for a slightly simpler case where instead of a lognormal distribition, we have an exponential distribution (M/M/1), we can <a href="http://www.win.tue.nl/~iadan/queueing.pdf">derive exact values</a> for these latencies. The key observation is that the number of events in the queue will have a <a href="https://en.wikipedia.org/wiki/Geometric_distribution">Geometric distribution</a>. The mean ends up being $$ 1 / (1 - f) $$ where $$ f $$ is the load factor. But my mom told me not to trust equations on the internet, so let's simulated it just to be on the safe side:</p>
<p><img src="https://erikbern.com/assets/wait-time-2.png" alt="wait time"></p>
<p>In case you can't see, there are two lines <em>exactly on top of each other</em> 💯.</p>
<h2 id="one-use-case-ndash-get-more-done-and-be-less-stressed">One use case – get more done and be less stressed</h2>
<p>I talked a lot about this in a technical context but let's switch gears a bit and allow me to put on my corporate philosopher hat. It's a metaphorical hat that I like to wear, and when I wear it, I mutter things like: <em>the speed at which a company innovates is fundamentally limited by the size of the iteration cycle.</em> So what can you do to reduce the size of that cycle? The observation is that if I'm spending <em>100%</em> of my time on super urgent stuff, all highest priority, then with fairly mild assumptions, that stuff will have an <em>extremely long cycle time</em>.</p>
<p>So how do we prevent that? Let's split up work into “things that need to happen now” vs “things that can wait”. You really don't want to spend 100% of your time being in the critical path for all the company's major projects. It's exactly the times when I'm stuck in “reactive mode” where my backlog of stuff builds up. Instead, make sure that a big chunk is <em>important</em>, but has no imminent deadline attached to it.</p>
<p>My strategy is to take all the urgent things, and delegate/automate it until the average load of “urgent things” is below 50%. It's possible some of the output is marginally lower quality, but the upside is now I can improve the <em>latency</em> by an order of magnitude. I can respond to emails and Slack messages faster, I can find time for an unexpected meeting, etc, and more generally, <em>information can propagate faster.</em></p>
<h2 id="other-notes">Other notes</h2>
<ul>
<li>It makes sense to co-locate batch jobs with low-latency processing and let the latter take precedence at any time. In fact I think this was the intuition behind building <a href="https://research.google.com/pubs/pub43438.html">Google Borg</a>.</li>
<li>It might seem like parallelization would help, but in fact it makes the problem even harder. A 2x faster machine with a single request queue will always have lower latency that two 1x machines with their own request queues. This in fact reminds me of a really old (2013) blog post that got widespread attention about <a href="https://genius.com/James-somers-herokus-ugly-secret-annotated">Heroku's routing</a>.</li>
</ul>
Lessons from content marketing myself (aka blogging) for five years2018-03-07T00:00:00Zhttps://erikbern.com/2018/03/07/lessons-from-content-marketing-myself-aka-blogging-for-five-years.html<p>I started writing this blog in late 2012, partly because I felt like it would help me improve my English and my writing skills, partly because I kept having a lot of random ideas in my head and I wanted to write them down somewhere. I honestly never cared too much about finding a particular niche, I just wanted to write down stuff that I found interesting. I set up a Wordpress blog on my crappy Swedish virtual private server.</p>
<p>2012 and 2013 were pretty slow, but a few of my blog posts would occasionally get picked up by some obscure online forum and get a few hundred hits in a day. <em>A few hundred hits in a day!</em> Back in the day when I saw a sudden spike of say 200 users in a day, that was a massive deal. I kept writing stuff for more than two years without really getting many readers. Looking back I'm sometimes asking myself <em>why?</em> But I kind of just wrote random things and was happy about it.</p>
<p>In late 2014, I wrote a blog post about my experiment <a href="https://erikbern.com/2014/11/29/deep-learning-for-chess.html">training a neural network to play chess</a>. It hit Hacker News front page and generated something like 50k page views in a few days. Since then, I've had several blog posts that “went viral” and generated a bunch of traffic.</p>
<ul>
<li><a href="https://erikbern.com/2014/11/29/deep-learning-for-chess.html">Deep learning for chess</a></li>
<li><a href="https://erikbern.com/2016/01/21/analyzing-50k-fonts-using-deep-neural-networks.html">Generating fonts using deep learning</a></li>
<li><a href="https://erikbern.com/2016/01/08/i-believe-in-the-10x-engineer-but.html">I believe in the 10x engineer, but…</a></li>
<li><a href="https://erikbern.com/2016/03/16/exploding-offers-are-bullshit.html">Exploding offers are bullshit</a></li>
<li><a href="https://erikbern.com/2016/04/04/nyc-subway-math.html">NYC Subway math</a></li>
<li><a href="https://erikbern.com/2016/12/05/the-half-life-of-code.html">The half life of code</a></li>
<li><a href="https://erikbern.com/2017/03/15/the-eigenvector-of-why-we-moved-from-language-x-to-language-y.html">The eigenvector of “why we moved from language x to language y”</a></li>
<li><a href="https://erikbern.com/2017/08/29/the-software-engineering-rule-of-3.html">The software engineering rule of 3</a></li>
</ul>
<p>It's not a ton of volume compared to New York Times, but for me it's a lot. My top post (the eigenvector post) is at 128k page views so far.</p>
<h2 id="history-of-my-blog-as-told-by-google-analytics">History of my blog, as told by Google Analytics</h2>
<p><img src="https://erikbern.com/assets/blog-page-views.png" alt="blog page views"></p>
<p>This is monthly page views since 2013. I'm now averaging about 20,000 pageviews per month so about 600/day although it's extremely spiky. If I switch to daily granularity it looks kind of silly:</p>
<p><img src="https://erikbern.com/assets/blog-page-views-daily.png" alt="blog page views daily"></p>
<p>The average (as I mentioned) is about 600 but the maximum is more than 50k. This is clearly not a Poisson but some really fat tailed distribution!</p>
<p>I get about 50 page views per day from Google search results. Not sure if this number should be higher.</p>
<p><img src="https://erikbern.com/assets/google-traffic.png" alt="google traffic"></p>
<p>I also have 1k+ subscribers on Feedly. I don't know the exact number, since it just shows up as “1K” once I crossed the 1,000 limit. I think you can tell from the User-Agent strings of the access logs but it's not showing up for some reason.</p>
<h2 id="history-of-my-blog-as-told-by-pingdom">History of my blog, as told by Pingdom</h2>
<p>Looking at uptime and page view latency is a bit like understanding volcano eruptions by digging out ice from Greenland:</p>
<p><img src="https://erikbern.com/assets/blog-latency.png" alt="blog latency"></p>
<p>Almost all the red lines are caused by blog posts going viral. It's honestly something I'm pretty embarrassed by! In total the uptime is 99.85% which I guess isn't terrible, but weighted by traffic volume it's probably far less.</p>
<p>But here's the good news. The uptime since April 2017 is ONE HUNDRED PERCENT 💯 .</p>
<p><img src="https://erikbern.com/assets/blog-uptime-100.png" alt="blog uptime 100"></p>
<p>I've had a lot of downtime in the past, cause by traffic spikes. The worst one was when my font post landed on Hacker News in the middle of the night. I woke up and my blog had been down all night. It did generate a lot of traffic from other sites, but sadly very little from Hacker News.</p>
<p>Honestly I think the hardest problem about provisioning my blog for traffic spikes is fighting my Swedish modesty that always tells me no one is going to read my blog posts anyway. But some stuff on the technical side I've learned:</p>
<ul>
<li>Set up <a href="https://pingdom.com">Pingdom</a> to track uptime, with text message alerts.</li>
<li>Wordpress on a private server is slow as hell. I switched to <a href="https://jekyllrb.com/">Jekyll</a> and wrote a <a href="https://gist.github.com/erikbern/5e81bf7d68e9deab9c55">conversion script</a> to move everything. Honestly not a big fan of Jekyll, but seems like that's what most people use.</li>
<li>Jekyll on a private server is also kind of slow. Use something like <a href="https://pages.github.com/">Github pages</a> or (I do this) <a href="https://aws.amazon.com/cloudfront/">Cloudfront</a>+S3.</li>
</ul>
<p>In retrospect, I should have just used a static site generator and S3+Cloudfront from scratch. Don't run your own server, it's just a recipe for failure. Cloudfront is also nice because it lets you set up HTTPS termination very easily, but if you don't care about HTTPS, you can also just use <a href="https://docs.aws.amazon.com/AmazonS3/latest/dev/WebsiteHosting.html">S3 and run it on HTTP</a>. I've also heard good things about Cloudflare. My AWS bill for Cloudfront and S3 is about ~$5-10/month these days, so not a lot of money.</p>
<p>At some point I also became obsessed with page speed. The choice of the very minimalistic theme made it easy, so after some minor tweaks (like inlining all CSS), I'm now proud to announce that I have a <a href="https://developers.google.com/speed/pagespeed/insights/?url=erikbern.com">99/100 score</a> on Pagespeed Insights ⚡.</p>
<h2 id="some-stuff-ive-learned-about-writing">Some stuff I've learned about writing</h2>
<ul>
<li>There's definitely some superlinear relationship between how much effort I put into things, and how much traffic I get. Putting in 2x efford can give you 10x or 100x the traffic, if you are writing something people care about.</li>
<li>As a corollary, I'm fairly sure you end up with far more hits if you spend twice as much on each article but publish half as often.</li>
<li>The title of the blog post matters a LOT. One of the most interesting blog posts I've written in my own opinion, was called <a href="https://erikbern.com/2017/02/01/language-pitch.html">Language pitch</a>. Someone posted it to the Hacker News frontpage, but it fell off almost immediately. Clickbait titles matter! I suspect you get a 5x traffic boost if you put “deep learning” or something similar in the title.</li>
<li>I added AMP to my site, but not really sure if it was worth it. It's already ridiculously fast, so it's just annoying with the slow updates from the AMP cache, that MathJax doesn't work, etc.</li>
<li>HTTPS is also not super important for blogs, and it does slow down the requests a bit. But I like the philosophy of always using HTTPS and I think it might give a marginal boost to search engine rankings.</li>
<li>RSS is a no-brainer, and I baffles me that some blogs don't have it. Without it, you can't subscribe using something like <a href="http://feedly.com/">Feedly</a>.</li>
<li>I <em>think</em>, but have no evidence for it, that meta tags (like <a href="http://ogp.me/">OpenGraph</a> and <a href="https://developer.twitter.com/en/docs/tweets/optimize-with-cards/overview/markup">Twitter</a>) matter a lot. Once I set the metadata correctly to get <a href="https://developer.twitter.com/en/docs/tweets/optimize-with-cards/overview/markup">big-ass previews in Twitter</a>, I feel like I'm getting a lot more traffic from Twitter.</li>
<li>Blog and Twitter sort of reinforces each other. Days when I get a spike of visitors on my blog, I also get a lot of new Twitter followers. Conversely, tweeting a link to my blog generally drives a fair amount of traffic.</li>
<li>Something similar applies to my <a href="https://github.com/erikbern">Github projects</a>. Blogging about projects and linking from projects back to the blog seems to reinforce and drive traffic to both.</li>
<li>I set up a Mailchimp email collection form a month ago as an experiment. It automatically sends a email summary of all blog posts every week and took about <a href="https://kb.mailchimp.com/campaigns/blog-posts-in-campaigns/share-your-blog-posts-with-mailchimp">20 minutes to set up</a>. I've been pretty surprised with the amount of people signing up. Getting about 2-3 per day, which doesn't seem like a whole lot, but that's potentially 500-1,000 people in a year. I got the idea from <a href="https://jvns.ca/blog/2017/12/28/making-a-weekly-newsletter/">Julia Evans</a>.</li>
<li>I haven't considered adding comments so far. I find the comments of blogs that I read to be mostly a distraction, and I also dread writing posts with few or no comments. But maybe one day.</li>
<li>Blogging seems to help a bit professionally. I don't think it's helped me directly (it certainly hasn't gotten me a job or gotten me promoted) but it does help me a bit in my current job with recruiting. A large fraction of people I talk to have seen my blog. I hink it acts as some form of compound marketing, where it's sometimes easier to get a foot in the door with a candidates because they have read my blog in the past.</li>
<li>The original purpose of this blog was to improve my English/writing skills, and I'm fairly happy with it as such. Practicing how to put a thought into a few hundred words succinctly is a good skill to have.</li>
<li>A really nice side effect is that I can use this blog as a excuse to mess around with new stuff. For instance, writing the deep chess article was a great way to make myself learn Theano. It's a nice motivator for finishing my side projects.</li>
<li>I probably should focus this blog a bit more. Software engineering? Machine learning? Management? But I honestly wouldn't have written all this stuff it wasn't for the fact that I enjoy writing about whatever I'm thinking about, so regular readers have to live with random side topics… e.g. this particular blog post :)</li>
</ul>
New benchmarks for approximate nearest neighbors2018-02-15T00:00:00Zhttps://erikbern.com/2018/02/15/new-benchmarks-for-approximate-nearest-neighbors.html<p>UPDATE(2018-06-17): There are is a <a href="/2018-06-17-new-approximate-nearest-neighbor-benchmarks">later blog post with newer benchmarks</a>!</p>
<p>One of my super nerdy interests include approximate algorithms for nearest neighbors in high-dimensional spaces. The problem is simple. You have say 1M points in some high-dimensional space. Now given a query point, can you find the nearest points out of the 1M set? Doing this fast turns out to be tricky.</p>
<p>I'm the author of <a href="https://github.com/spotify/annoy">Annoy</a> which has more than 3,000 stars on Github. Spotify used a lot of vector spaces models for music recommendations, and I think as people embrace vector space models more and more, we'll see more attention to fast approximate searches.</p>
<p>What's bothered me about the research is that there's a thousand papers about how to do this, but very little empirical comparison. I built <a href="https://github.com/erikbern/ann-benchmarks">ANN-benchmarks</a> to address this. It pits a bunch of implementations (including Annoy) against each other in a death match: which one can return the most accurate nearest neighbors in the fastest time possible. It's not a new project, but I haven't actively worked on it for a while.</p>
<p>Recently, two researchers (Martin Aumüller and Alexander Faithfull) published a <a href="http://www.itu.dk/people/maau/additional/sisap2017-preprint.pdf">paper</a> featuring ANN-benchmarks and were nice enough to include me as a co-author (despite not writing a single word in the paper). They contributed a ton of useful stuff into ANN-benchmarks which made me realize that my tool could be some kind of “golden standard” for all approximate nearest neighbor benchmarking going forward. So I decided to spend a bit more time making ANN-benchmarks <em>ridiculously</em> easy to use for researchers or industry practitioners active in this field.</p>
<p>My hope is that there is a group of people who care about approximate nearest neighbor search, and hopefully people everyone can stick to the same benchmarks going forward. That would be great, because it makes everyone's lives easier (kind of like how ImageNet made it easier for the deep learning crowd).</p>
<h2 id="whats-new-in-ann-benchmarks">What's new in ANN-benchmarks?</h2>
<p>What are the things I've added in the last few months? A bunch of stuff:</p>
<ul>
<li>All algorithms are now Dockerized. This means you don't have to install a bunch of stuff on the host computer, and deal with all the mess that that entails. All you need to do to add a new algorithm is to create a Dockerfile and some more config. Very nice!</li>
<li>It comes with pre-computed datasets. I've collected a bunch of different vector datasets (MNIST and many other ones), split in train and test sets, and computed the nearest neighbors for the test set. Everyone can just download the dataset and use it.</li>
<li>I finally got the <a href="https://travis-ci.org/erikbern/ann-benchmarks">Travis-CI test working</a> kind of (it's still a bit flaky).</li>
</ul>
<p>I re-ran all benchmarks, which took a few days and about $100 in EC2 costs. The results depend on what dataset you use, but are somewhat consistent. I'm not going to get into the details. All you need to know for now is that the further up and to the right is better. Feel free to check out <a href="https://github.com/erikbern/ann-benchmarks">ANN-benchmarks</a> for more info.</p>
<p>glove-100-angular:
<img src="https://erikbern.com/assets/glove-100-angular.png" alt="glove-100-angular"></p>
<p>sift-128-euclidean:
<img src="https://erikbern.com/assets/sift-128-euclidean.png" alt="sift-128-euclidean"></p>
<p>fashion-mnist-784-euclidean:
<img src="https://erikbern.com/assets/fashion-mnist-784-euclidean.png" alt="fashion-mnist-784-euclidean"></p>
<p>gist-960-euclidean:
<img src="https://erikbern.com/assets/gist-960-euclidean.png" alt="gist-960-euclidean"></p>
<p>In almost all the datasets the top 5 are in the following order:</p>
<ol>
<li>HNSW (hierarchical navigable small world) from <a href="https://github.com/searchivarius/nmslib">NMSLIB</a> (non metric search library) knocks it out of the park. It's over 10x faster than Annoy.</li>
<li><a href="https://github.com/aaalgo/kgraph">KGraph</a> is not far behind, which is another graph-based algorithm</li>
<li>SW-graph from NMSLIB</li>
<li>FAISS-IVF from <a href="https://github.com/facebookresearch/faiss">FAISS</a> (from Facebook)</li>
<li><a href="https://github.com/spotify/annoy">Annoy</a> (I wish it was a bit faster, but think this is still honorable!)</li>
</ol>
<p>In previous benchmarks, <a href="https://github.com/FALCONN-LIB/FALCONN">FALCONN</a> used to perform very well, but I'm not sure what's up with the latest benchmarks – seems like a huge regression. If any of the authors are reading this, I'd love it if you can figure out what's going on. FALCONN somewhat interesting because it's the the only library I've seen that gets decent results using <a href="https://en.wikipedia.org/wiki/Locality-sensitive_hashing">locality sensitive hashing</a>. Other than that, I haven't been very impressed by LSH. Graph-based algorithms seem be the state of the art, in particular HNSW. Annoy uses a very different algorithms (recursively partitions the space using a two-means algorithm).</p>
<h2 id="a-final-word">A final word</h2>
<p>Going forward, if I see a paper about fast approximate nearest neighbor queries, and it doesn't include proper benchmarks against any of the top libraries, I'm not going to give a 💩! ANN-benchmarks makes it too easy not to have an excuse for it!</p>
I'm looking for data engineers2018-01-28T00:00:00Zhttps://erikbern.com/2018/01/28/im-looking-for-data-engineers.html<p><img src="https://erikbern.com/assets/binary_globe.jpeg" alt="binary globe"></p>
<p>I'm interrupting the regular programming for a quick announcement: we're looking for data engineers at <a href="https://better.com">Better</a>. You would be the first one to join and would work a lot directly with me.</p>
<p>Some fun things you <em>could</em> work on (these are all projects I'm working on right now):</p>
<ul>
<li>Building a forecasting model <a href="https://github.com/pymc-devs/pymc3">using MCMC</a> to predict volume the next few months. Productionize it in the form of a job that posts an updated visualization to Slack every night.</li>
<li>Migrate our data warehouse to Redshift.</li>
<li>Write and productionize a web scraper to ingest a bunch of financial third party data.</li>
<li>Work with business people to figure out what to measure and define KPIs for the company.</li>
<li><a href="https://github.com/better/convoys">Fit Gamma distributions</a> to conversion data to understand the time lag and conversion rates.</li>
<li>Work on <a href="https://github.com/better/champy">mixed-integer optimization</a> problems to find the best loans for borrowers.</li>
<li>Work with the product team to understand our conversion funnel and friction points to the user.</li>
<li>Build an ETL pipeline that downloads phone call mp3s, transcribes them to text, and ingests them into the database.</li>
</ul>
<p>This position is very engineering-heavy at its core, and the main qualification is solid programming skills. I like to see at least a couple of years of professional software experience, and a programming skills that go back at least five years.</p>
<p>Other than that, we don't require any particular skills, and certainly no fancy academic credentials. However, a curiosity about what makes a startup succeed is great, and if you know some basic statistics that doesn't hurt (but certainly isn't required).</p>
<p>What does Better do? I've written a blog post about <a href="/2017/02/17/why-i-went-into-the-mortgage-industry.html">why I went into the mortgage industry</a> if you're interested. In short, it's an <em>enormous</em> industry and also a very terrible one. We think we can fix it, by making mortgages fast, easy, and inexpensive. And we're not fixing it in a sketchy way (for instance by lending to people who can't afford the loan). We focus on the seven million Americans who get a normal plain mortgage every year, and we are making the experience better by solving all the pain points using technology.</p>
<p>Sounds interesting? Definitely let me know at erik at better.com!</p>
<p>(The binary globe picture is somewhat ironic. I have fascination for “data” stock photos.)</p>
Books I consumed in 20172018-01-17T00:00:00Zhttps://erikbern.com/2018/01/17/books-i-consumed-in-2017.html<p><img src="https://erikbern.com/assets/library.jpeg" alt="library"></p>
<p>Turns out having a toddler isn't super compatible with reading. I used to read ~100 books/year as a teenager, but it has slowly deteriorated to maybe 20-30 books, at most. And I don't even finish all of them because life is too short! Some books are just not that interesting. So what were some of the books worth mentioning?</p>
<h2 id="economics--venture-capital--misc">Economics / Venture capital / Misc</h2>
<p>I'm a sucker for behavioral economics, and I usually keep it pretty superficial. So I wasn't surprised that <a href="https://www.amazon.com/gp/product/039335279X/ref=oh_aui_detailpage_o08_s00?ie=UTF8&psc=1">Misbehaving</a> by Richard Thaler was a pretty nice book. It probably resurged in rankings after his well-deserved Nobel Prize in Economics at the end of last year.</p>
<p>A book on history and economics that keeps coming up is <a href="https://www.amazon.com/gp/product/1843763311/ref=oh_aui_detailpage_o04_s00?ie=UTF8&psc=1">Technological Revolutions and Financial Capital</a>. I'm always a bit skeptical of these books trying to find predictable pattern in history (reminds me of pseudoscientific <a href="https://en.wikipedia.org/wiki/Kondratiev_wave">Kondratiev waves</a> and crackpot stuff like that) but still, there are probably some legit patterns that we can learn from. Worth reading.</p>
<p><a href="https://www.amazon.com/gp/product/0544602315/ref=oh_aui_detailpage_o08_s00?ie=UTF8&psc=1">Unbanking of America</a> is a great book about financial services for poor people in America. It went a long way explaining the alternative banking systems they use and why it makes sense for them.</p>
<p><a href="https://www.amazon.com/gp/product/0470874449/ref=oh_aui_detailpage_o07_s00?ie=UTF8&psc=1">The Business of Venture Capital</a> is a pretty dry book about venture capital, and a bit dated, but it's definitely the best one out of a few books I read trying to wrap my head around how the industry works. A very different book was <a href="https://www.amazon.com/gp/product/039959101X/ref=oh_aui_detailpage_o03_s00?ie=UTF8&psc=1">Reset</a> by Ellen Pao. The book does not paint a rosy picture of behavior in the VC industry, but I also can't help but getting the feeling that Pao throughout the book is a bit… naïve? I read the book partly as a story of a high performing “work hard and everything will follow” person oblivious of the power structures and the politics that exists basically everywhere. As such, I think it was an interesting book, and something I can sympathize with myself.</p>
<p>A hyped up book that I couldn't <em>stand</em> was <a href="https://www.amazon.com/gp/product/0143121359/ref=oh_aui_detailpage_o08_s00?ie=UTF8&psc=1">The Beginning of Infinity</a>. I gave up after a few hundred pages. The author loves using the word “parochial” about five times on every page and goes on long rants about cosmology and many other things. I studied physics in school, but one thing I despise about physics people is they have a tendency to assume everything in physics generalizes to everything and that physics students are omnipotent mathemagicians who can sprinkle their mathematical models on basically every possible sociological/economical/whatever phenomenon. Similarly I gave up on <a href="https://www.amazon.com/gp/product/0231180721/ref=oh_aui_detailpage_o07_s00?ie=UTF8&psc=1">How Much Inequality Is Fair</a> which is some arbitrary mathematical model of equality the author cooked up that is <em>just one out of thousands of plausible models you can cook up</em>. But enough ranting about physics!</p>
<h2 id="operations-research">Operations research</h2>
<p>I read a whole pile of books on how to structure work efficiently. Partly because our mortgage process has a lot of parallels to a manufacturing pipeline, partly because software development has that too.</p>
<p><a href="https://www.amazon.com/gp/product/0884271951/ref=oh_aui_detailpage_o06_s01?ie=UTF8&psc=1">The Goal</a> is a classic “business fiction” book that is worth reading for anyone with a manufacturing pipeline. I think of it as the base case: low variability, <em>find the bottleneck</em> kind of process, and the “theory of constraints” probably works well in those cases. The whole book can be summed up as “find the bottleneck and sometimes you have to do slightly inefficient things to expand it”. <a href="https://www.amazon.com/gp/product/1935401009/ref=oh_aui_detailpage_o00_s00?ie=UTF8&psc=1">The Principles of Product Development Flow</a> build upon The Goal pretty nicely and handles the case of substantial variance (like in the case of software engineering).</p>
<p><a href="https://www.amazon.com/gp/product/0071326227/ref=oh_aui_detailpage_o05_s00?ie=UTF8&psc=1">Matching Supply with Demand</a> is a bit more theoretic and introduces some of the basic math of queue theory. <a href="https://www.amazon.com/gp/product/0060559535/ref=oh_aui_detailpage_o07_s00?ie=UTF8&psc=1">Reengineering the Corporation</a> goes through a few case studies of how to streamline work processes.</p>
<h2 id="business--management">Business / management</h2>
<p><a href="https://www.amazon.com/gp/product/1491973897/ref=oh_aui_detailpage_o06_s00?ie=UTF8&psc=1">The Manager's Path</a> is by far the best book I've read about technical management. Highly recommended to anyone who writes code and reads book.</p>
<p>Mostly out of curiousity, I read <a href="https://www.amazon.com/gp/product/0470139889/ref=oh_aui_detailpage_o00_s00?ie=UTF8&psc=1">The Science of Success</a> by the notorious Koch brothers. It's not a masterpiece, and I'm not going to recommend it, but I found myself agreeing with basically their whole theory on “market based management”. The book is basically a whole case for making more economically rational decisions, which is hard to disagree with.</p>
<p><a href="https://www.amazon.com/gp/product/1501135910/ref=oh_aui_detailpage_o01_s00?ie=UTF8&psc=1">Shoe Dog</a> was a great summary of the early days of Nike and I'm left with tremendous respect for the copious amounts of hustle going into it. Not sure what's going on with your supplier? Jump onto the next plane to Japan and show up at the factory next day. <a href="https://www.amazon.com/gp/product/1250096065/ref=oh_aui_detailpage_o00_s00?ie=UTF8&psc=1">Losing the Signal</a> was a fun story about Research In Motion (makers of Blackberry) and their decay after living in denial about the IPhone. <a href="https://www.amazon.com/gp/product/0385479506/ref=oh_aui_detailpage_o04_s00?ie=UTF8&psc=1">Co-opetition</a> was a pretty good book about “collusion” (despite some dumb blunders early on like predicting the IPhone will fail)</p>
<p>I got a bit tired of management books at some point so I turned to other areas for inspiration. I ended up reading <a href="https://www.amazon.com/gp/product/0960273603/ref=oh_aui_detailpage_o04_s00?ie=UTF8&psc=1">Attacks</a> by the infamous German general Rommel. I don't think I can recommend it, but it still left me with some thoughts. First of all, the guy is a massive psycho. But what strikes me is to what lengths Rommel goes to <em>lead by example.</em> At some point, he gets excited about putting his bayonet skills to practice when he rushes through the woods with his troops towards the French. He doesn't hesitate to crawl ahead of his platoon through the muddy trenches to ambush the enemy. Over time he's promoted several times but I think his obsessive attention to everything that matters on the battlefield makes him a lot more effective as a general. I've seen leaders in tech who stopped coding way too early and I see how their leadership skills end up suffering because their technical judgement was never fine tuned.</p>
<p>One military leader with a very different perspective is Stanley McChrystal. His book <a href="https://www.amazon.com/Share-Task-General-Stanley-McChrystal/dp/159184682X">My Share of the Task</a> describes a leader who does a great job de-bottlenecking information and setting the high level strategy right (I loved this book <a href="https://www.amazon.com/Team-Teams-Rules-Engagement-Complex/dp/1591847486">Team of Teams</a>). But the whole book leaves me with the feeling that he just never <em>gets it.</em> Never having been a foot soldier, he fails to empathize with his troops on the ground. The whole war in Afghanistan makes it seem like a terrible startup without any product market fit (the Afghans don't <em>want</em> the Americans to help them) who keeps raising more money (asking for more troops).</p>
<p>The chasm between a general like McChrystal and Rommel is pretty striking as a top-down ivory tower style management vs a decentralized bottom up approach. There's some interesting things to learn from both perspectives.</p>
<h2 id="stuff-i-listened-to">Stuff I listened to</h2>
<p>My 2017 music consumption was fairly label-centric. I finally felt like Sweden regained its rumor as a reliable producer of electronic music. Both <a href="https://open.spotify.com/user/kornelkovacs/playlist/63jx9auELtv22jqOvYHbaB">Studio Barnhus</a> and <a href="https://open.spotify.com/user/brainsprain/playlist/7qXwFMsNzMrnaNKDP8p1WG">Northern Electronics</a> are two labels releasing a long string of fine techno (and they couldn't be more different!). Another label I enjoyed quite a lot was <a href="https://open.spotify.com/user/htphinney/playlist/215TGFgN1aCZ94BBouUYKv">Lobster Theremin</a> from UK.</p>
Plotting author statistics for Git repos using Git of Theseus2018-01-03T00:00:00Zhttps://erikbern.com/2018/01/03/plotting-author-statistics-for-git-repos-using-git-of-theseus.html<p>I spent a few days during the holidays fixing up a bunch of semi-dormant open source projects and I have a couple of blog posts in the pipeline about various updates. First up, I made a number of fixes to <a href="https://github.com/erikbern/git-of-theseus">Git of Theseus</a> which is a tool (written in Python) that generates statistics about Git repositories. I've <a href="https://erikbern.com/2016/12/05/the-half-life-of-code.html">written about it previously</a> on this blog. The name is a horrible pun (I'm a dad!) on <a href="https://en.wikipedia.org/wiki/Ship_of_Theseus">Ship of Theseus</a> which is a philosophical thought experiment about what happens if you replace every single part of a boat — is it still the same boat ⁉️ 🤔</p>
<p>So anyway, here's one of the plots you can generate for <a href="https://github.com/kubernetes/kubernetes">Kubernetes</a> — a somewhat arbitrarily picked repository.</p>
<p><img src="https://erikbern.com/assets/git-kubernetes.png" alt="k8s git"></p>
<p>So what's new? I've updated the color scheme a bit, but also added the option to plot author statistics:</p>
<p><img src="https://erikbern.com/assets/git-kubernetes-authors.png" alt="k8s git"></p>
<p>And it doesn't stop there! Here are some other minor updates:</p>
<ul>
<li>I published the <a href="https://pypi.python.org/pypi/git-of-theseus">whole thing to PyPI</a> which also means that the installation is far simpler: just run <code>pip install git-of-theseus</code>.</li>
<li>The pip package also installs binaries that lets you run the analyses in a more straightforward way: just run <code>git-of-theseus-analyze</code> on the command line.</li>
<li>By default it now only analyzes file types of certain extensions that indicate source code (by leveraging <a href="http://pygments.org/">pygments</a>)</li>
<li>You can also normalize stats using the <code>--normalize</code> flag. See plot below:</li>
</ul>
<p><img src="https://erikbern.com/assets/git-git-authors-normalized.png" alt="git git"></p>
<p>That's it! As I mentioned I got more where this came from. Some future blog posts will cover:</p>
<ul>
<li><a href="https://github.com/erikbern/ann-benchmarks">ann-benchmarks</a> which is a tool to benchmark approximate nearest neighbor methods. Very niche, but very useful within its niche. I just spent a lot of time precomputing datasets and Dockerizing all algorithms.</li>
<li><a href="https://github.com/better/convoys">convoys</a> a new tool I built to model and plot time-lagged conversion. Fun stuff with Gamma and Weibull distributions.</li>
<li><a href="https://github.com/better/champy">champy</a> which is a halfway implementation wrapper that lets you formulate and solve <a href="https://en.wikipedia.org/wiki/Linear_programming">linear programming</a>, <a href="https://en.wikipedia.org/wiki/Integer_programming">mixed integer programming</a>, and <a href="https://en.wikipedia.org/wiki/Constraint_programming">constraint programming</a> problems in a much nicer way (IMO) than any other library I've encountered. Don't hold your breath for this one — it's pretty far from being production-grade.</li>
</ul>
<p>EDIT(2018-01-16): added a few more notes</p>
Toxic meeting culture2017-12-29T00:00:00Zhttps://erikbern.com/2017/12/29/toxic-meeting-culture.html<p><img src="https://erikbern.com/assets/dogs-meeting.jpg" alt="dogs meeting"></p>
<p>I spent six years at a company that went from 50 people to 1500 and one contributing factor leading to my departure was that I went from a “maker” to a person stuck in meetings every day. It wasn't that I wanted to do that, but everyone else kept dragging me into meetings.</p>
<p>There's about 47 million blog posts about why meetings suck and I'm not going to pile more onto that heap. For the record – a well run meeting is great! But thinking back I think there was a number of things that absolutely completely sucked about the meeting culture. Rather than focusing on how to run meetings better, let's try to backtrack the issues back to the organizational culture that created this mess? What is it? Here's some armchair philosophizing:</p>
<h2 id="people-feeling-good-about-being-in-meetings">People feeling good about being in meetings</h2>
<p>People are hardcoded to seek proxies where you do something and you feel good about it right away. We do that because delayed gratification is a hard thing. We're constantly at risk of failing the <a href="https://en.wikipedia.org/wiki/Stanford_marshmallow_experiment">marshmallow test</a> and succumb to the urge of getting satisfaction right now. Software engineers like to crank out code, because years of coding have made it feel really good. So what's the issue with that? It leads to things that might not have anything to do with business value. Vanity refactoring, spending too much time on technically interesting problems, etc.</p>
<p>So why do managers feel good about being in meetings? Because they seek vague proxies for feeling like they “got things done”. Coming out of a long day of meetings, with discussion with people, validates their feeling of purpose in an organization.</p>
<p><em>How to solve:</em> promote people based on their actual work output and the value of their decisions.</p>
<h2 id="decision-meetings-that-turn-into-shitty-brainstorming-meetings">“Decision” meetings that turn into shitty brainstorming meetings</h2>
<p>It seems like there's <a href="http://tomtunguz.com/brainstorming/">substantial evidence</a> that it's a bad idea to put a bunch of people in a room to come up with anything creative. But people still try. Silly people!</p>
<p>I suspect the biggest losers of these poorly run meetings are (a) introverts (b) people who combine lots of different signals into a single conclusion (aka <a href="https://en.wikipedia.org/wiki/The_Hedgehog_and_the_Fox">foxes</a>) (c) people with language or cultural barriers. I suffer from all three of these, which sucks. Putting a bunch of people to brainstorm in a room and most likely an alpha male Ivy League guy is going to argue for their thesis eloquently in a way that leaves you speechless. And it sucks for people like me who like to think for a bit and weigh different signals together. My first three years in the US, I struggled just getting anything said in a unmoderated discussion. Americans love to interrupt and they expect you to! Anyway, I digress…</p>
<p><em>How to solve:</em> never have meetings with more than 4 people if you are planning to brainstorm to reach to a conclusion. Be incredibly suspicious of people having meetings with more than 4 people trying to make a decision.</p>
<h2 id="fear-of-leaving-people-out">Fear of leaving people out</h2>
<p>Any recurring meeting with senior people will slowly be debased by invitee inflation. But that devalues the meeting and wastes peoples times.</p>
<p><em>How to solve:</em> start telling people: thanks for not inviting me to a meeting! Cap all recurring meetings to at most 10 times.</p>
<h2 id="load-factor-and-iteration-cycle">Load factor and iteration cycle</h2>
<p>One thing I noticed about many (especially ineffective) managers is they basically let their calendar availability be a prioritization filter. They would let their calendars slowly fill up, until it was impossible to find any time on that. At that point people would either (a) accept that they have to wait until a meeting in the week after the next to make a decision (b) give up and try to figure out some other ways to make progress.</p>
<p>This is kind of similar to what happens with a system with high variability and near 100% load factor. The cycle time shoots up, from 0 to infinity as the load factor goes towards 100%. Basically the average time it takes to make decisions might be a few hours or a day or two with 25% calendar load, but with 75% calendar load it's almost impossible to find a time on everyone's calendars. As a result, the time it takes to make decisions shoots up to <em>weeks</em>. Since decisions tend to be highly dependent on each other, you basically slow down decision making across the whole organization.</p>
<p><em>How to solve:</em> don't defer decisions to meetings. Make decisions on the spot, communicate it over email, and use the meeting to discuss it.</p>
Learning from users faster using machine learning2017-12-12T00:00:00Zhttps://erikbern.com/2017/12/12/learning-from-users-faster-using-machine-learning.html<p>I had an interesting idea a few weeks ago, best explained through an example. Let's say you're running an e-commerce site (I <a href="https://better.com">kind of do</a>) and you want to optimize the number of purchases.</p>
<p>Let's also say we try to learn as much as we can from users, both using A/B tests but also using just basic slicing and dicing of the data. We are looking at how many people convert (buy our widgets) but a constant problem is there's just <em>too much uncertainty</em>.</p>
<p>How can we learn faster? In particular, is there a way to incorporate <em>additional data</em> somehow? This struck me as a very universal problem, so I <a href="https://twitter.com/bernhardsson/status/931734871168503808">tweeted this</a> and got some interesting pointers.</p>
<h2 id="reading-material">Reading material</h2>
<p><a href="https://twitter.com/jeremystan">Jeremy Stanley</a> pointed out: “If you can place a dollar value on a unit of each metric, then you could use the total as a single metric”. I like that approach because it's super simple and it's easy to understand how it works.</p>
<p><a href="https://twitter.com/johnmyleswhite">John Myles White</a> sent a link to a blog post: <a href="http://www.deaneckles.com/blog/745_using-covariates-to-increase-the-precision-of-randomized-experiments/">Using covariates to increase the precision of randomized experiments</a>. I don't quite follow it, but my understanding is that it's more of a way to reduce noise caused by uneven assignment between the test and control group. <a href="https://twitter.com/eyadsibai">Eyad Sibai</a> pointed out a KDD paper: <a href="http://www.kdd.org/kdd2016/subtopic/view/boosted-decision-tree-regression-adjustment-for-variance-reduction-of-onlin">Boosted Decision Tree Regression Adjustment for Variance Reduction of Online Controlled Experiments</a>. The idea is simple. Instead of using say “purchased a widget” as an outcome metric, try to predict based on user attributes whether the user is going to purchase the widget. Then, use the deviation between the prediction and the real value (whether the user purchased the widget) as the target metric in the test. Using this approach, they reach the same level of statistical significance with 63% less data. Nice!</p>
<p><a href="https://twitter.com/shalituri">Uri Shalit</a> sent a link to a paper: <a href="https://www.ncbi.nlm.nih.gov/pmc/articles/PMC2818753/">Correlated Bivariate Continuous and Binary Outcomes: Issues and Applications</a>. The paper looks cool, but is way over my head, sadly.</p>
<p><a href="https://twitter.com/measurestuff">Adrian Palacios</a> sent a link to a new Netflix blog post: <a href="https://medium.com/netflix-techblog/interleaving-in-online-experiments-at-netflix-a04ee392ec55">Innovating Faster on Personalization Algorithms at Netflix Using Interleaving</a>. This research focuses on a very narrow problem: ranking video recommendations. By scrapping A/B testing for “interleaving”, they show that they get to significance about two orders of magnitude (100x) faster! That's extremely impressive, but it's not clear to me if it generalizes to any other type of tests.</p>
<h2 id="a-simple-toy-model">A simple toy model</h2>
<p>Enough literature study. I wanted to try this in practice. My idea is: create a model that predicts whether someone is going to purchase a widget <em>given a lot of additional data</em>. And instead of using the actual target metric (what fraction of people bought widgets) we use the <em>predicted</em> metric, using our machine learning model. So for instance as inputs to the model we throw in all kinds of features, and then try to predict the target (did the user buy the widget or not?)</p>
<p>I experimented with a few different models and the one that seemed to work the best was the most basic model you could ever think of: <em>linear regression</em>. The inputs are all binary variables that denote whether the user hits certain pages in the conversion flow. In total there's 70 different features (we have a lot of special pages only some users hit). The predictor is a binary variable indicating whether the user converted. I train the model to minimize the squared loss.</p>
<p>One cool feature is we can apply dropout on the inputs, since that makes it possible to include the target itself as an input. It turns out doing that and using <em>extreme</em> dropout actually seems to work really well. I ended up dropping 90% of the inputs during training. The model is a few lines using Keras:</p>
<div class="highlight"><pre style="color:#f8f8f2;background-color:#272822;-moz-tab-size:4;-o-tab-size:4;tab-size:4"><code class="language-python" data-lang="python">inputs <span style="color:#f92672">=</span> keras<span style="color:#f92672">.</span>layers<span style="color:#f92672">.</span>Input(shape<span style="color:#f92672">=</span>(X<span style="color:#f92672">.</span>shape[<span style="color:#ae81ff">0</span>],))
inputs_dropout <span style="color:#f92672">=</span> keras<span style="color:#f92672">.</span>layers<span style="color:#f92672">.</span>Dropout(<span style="color:#ae81ff">0.90</span>)(inputs)
outputs <span style="color:#f92672">=</span> keras<span style="color:#f92672">.</span>layers<span style="color:#f92672">.</span>Dense(<span style="color:#ae81ff">1</span>, activation<span style="color:#f92672">=</span><span style="color:#e6db74"></span><span style="color:#e6db74">'</span><span style="color:#e6db74">linear</span><span style="color:#e6db74">'</span>)(inputs_dropout)
model <span style="color:#f92672">=</span> keras<span style="color:#f92672">.</span>models<span style="color:#f92672">.</span>Model(inputs<span style="color:#f92672">=</span>inputs, outputs<span style="color:#f92672">=</span>outputs)
model<span style="color:#f92672">.</span>compile(optimizer<span style="color:#f92672">=</span>keras<span style="color:#f92672">.</span>optimizers<span style="color:#f92672">.</span>SGD(lr<span style="color:#f92672">=</span><span style="color:#ae81ff">1e-2</span>), loss<span style="color:#f92672">=</span><span style="color:#e6db74"></span><span style="color:#e6db74">'</span><span style="color:#e6db74">mse</span><span style="color:#e6db74">'</span>)
model<span style="color:#f92672">.</span>fit(X, y, batch_size<span style="color:#f92672">=</span><span style="color:#ae81ff">16</span>, epochs<span style="color:#f92672">=</span><span style="color:#ae81ff">300</span>)
</code></pre></div><h2 id="results">Results</h2>
<p>I “simulated” a conversion rate A/B test by picking three random subsets of users to our site in some way I'm not going to disclose. We want to understand if the conversion rate is different between the three subsets.</p>
<p>Let's first run the analysis the “traditional” way. We look at the fraction of users who make it through the entire conversion flow, and we plot the conversion rate with a confidence interval. As we get more and more data, the confidence interval for each group shrinks:</p>
<p><img src="https://erikbern.com/assets/funnel_model_reals.png" alt="pic"></p>
<p>Then, I train a model on data from earlier this year so that it's properly out of sample. Let's plot the same thing again, but replace all the “real” values with their <em>predicted</em> values. Each predicted value is obtained by feeding in <em>all</em> the 70 binary values for each user.</p>
<p>We can see that the confidence intervals are <em>much</em> tighter and that the conversion rate curve is much smoother:</p>
<p><img src="https://erikbern.com/assets/funnel_model_preds.png" alt="pic"></p>
<p>This is actually pretty cool! In this case, it looks like we can actually get a confidence interval that's almost 50% smaller, which means we can get to statistical significance about 4x faster. If we plot the conversion rates and the confidence intervals for a larger set of groups, we can see that the uncertainty is consistently smaller using the predicted values:</p>
<p><img src="https://erikbern.com/assets/funnel_model_bars.png" alt="pic"></p>
<h2 id="conclusion">Conclusion</h2>
<p>Consider this blog post a bit of a wacky experiment – I think the outcome is super interesting, and worth thinking more about.</p>
<p>One downside of this model is that the reduction of variance doesn't come for free. We're basically trading a bit of <a href="https://en.wikipedia.org/wiki/Bias%E2%80%93variance_tradeoff">bias for variance</a>. The predicted conversion rate might have a tighter confidence interval, but it's no longer guaranteed to converge to the “correct” value. Is that acceptable? I don't know. Another issue is you can have some kind of “covariate shift” where the data distribution changes over time. For instance what if your conversion flow completely changes.</p>
<p>I haven't spent enough time understanding this, and I haven't made up my mind if this tool is going to be something I'm planning to use for real data. This is admittedly a bit of a half-baked idea that I would love to get some feedback on!</p>
<h2 id="postscript">Postscript</h2>
<p>The almighty John Myles White <a href="https://twitter.com/johnmyleswhite/status/940927599726997504">tweeted</a> a link to this blog post but raised a number of concerns with the methodology. We had bit of back and forth but I think I was able to <a href="https://twitter.com/johnmyleswhite/status/941308333558063105">address</a> the concerns. I think it's useful to rehash some of the arguments for other people:</p>
<ul>
<li>Rather than focusing on some particular target metric (eg conversion rate), let's focus on the underlying “user value”.</li>
<li>“user value” is a continuous variable rather than binary, so should have lower variance (everything else equals).</li>
<li>We define “user value” by running a regression model that find a linear combination of many different user metrics in a way that predicts the original target.</li>
<li>So basically we learn to replace one value with a lower variance version of itself (but with slight bias).</li>
</ul>
<p>Some more notes:</p>
<ul>
<li>Why using a neural network for this? It's basically a linear regression, but we need some kind of regularization. I have a mild preference for dropout since it's dimensionless.</li>
<li>Why do we need regularization? Without it, the linear regression would just learn the trivial mapping where the target predicts the target and everything else is ignored.</li>
<li>You can see the bias-variance tradeoff pretty clearly here. If you set the dropout to 0, you get zero bias, high variance. As you increase the dropout rate, you increaes the bias, but lower the variance.</li>
<li><a href="https://twitter.com/SergeyFeldman">Sergey Feldman</a> also pointed out <a href="https://arxiv.org/pdf/1608.00060.pdf">this paper</a>: Double/Debiased Machine Learning for Treatment and Structural Parameters. Seems interesting.</li>
</ul>
Annoy 1.10 released, with Hamming distance and Windows support2017-11-26T00:00:00Zhttps://erikbern.com/2017/11/26/annoy-1.10-released-with-hamming-distance-and-windows-support.html<p>I've been a bit bad at posting things with a regular cadence lately, partly because I'm trying to adjust to having a toddler, partly because the hunt for clicks has caused such a high bar for me that I feel like I have to post something Pulitzer-worthy. But things are always cooking, so let's break this pattern with a quick notice on something I've been working on!</p>
<h2 id="annoy-1100-is-out">Annoy 1.10.0 is out</h2>
<p><img src="https://erikbern.com/assets/2015/05/ann.png" alt="pic"></p>
<p><a href="https://github.com/spotify/annoy">Annoy</a> is a library I built at Spotify that helps your search for approximate nearest neighbors in high-dimensional spaces. This is super useful if you use vector models, which Spotify uses a lot. Every track/album/artist/playlist/user ends up being a vector in some high dimensional space (typically 40D, sometimes more). The problem is that <em>searching</em> in that space is a nontrivial art (if I recall correctly, it's expected but not proven to be to be NP-complete).</p>
<p>Annoy solves this issue by relaxing the search to be <em>approximate</em>. You can usually get 90% or 99% recall with only 1% of the runtime of an exhaustive search. This is great in many applications like recommendations where the cost of a false negative isn't the end of the world.</p>
<p>Annoy 1.10.0 features mind-altering things like <a href="https://en.wikipedia.org/wiki/Hamming_distance">Hamming distance</a> added by <a href="https://github.com/maumueller">Martin Aumüller</a>. Hamming distance is great when your vectors can be represented in binary form (every coordinate is either 0 or 1). This means that vectors can be stored very efficiently as 64-bit integers and distance can be computed using primitives like <a href="https://gcc.gnu.org/onlinedocs/gcc/Other-Builtins.html">__builtin_popcountll</a> which I think is a single CPU cycle on modern machines. The tree-building method right now only consider axis aligned splits (effectively making it a <a href="https://en.wikipedia.org/wiki/K-d_tree">k-d tree</a>) but I'm hoping to experiment with a few other heuristics at some point in the future.</p>
<p>The other main thing that 1.10.0 adds is Windows support with a proper <a href="https://ci.appveyor.com/project/erikbern/annoy">CI pipeline</a>, contributed by <a href="https://github.com/tjrileywisc">Timothy Riley</a>. Annoy has had some semi-broken Windows support for a very long time, but several people have reported that it doesn't work. Since I haven't had access to any Windows machines, it's been tricky for me to debug. The Windows build only works on Python 3.6 (but quite frankly: I'm a big proponent of Py3 – and my sympathy for people on Py2 is very limited).</p>
<h2 id="what-else">What else?</h2>
<ul>
<li>I got an email saying Annoy powers a <a href="https://omdb.diracmaterials.org/">database for condensed matter physics</a>. See corresponding <a href="https://arxiv.org/abs/1710.11611">paper 1</a> and <a href="https://arxiv.org/abs/1709.03151">paper 2</a>. Always fun when things end up in unexpected fields.</li>
<li>There's a long list of companies using Annoy (including Spotify). Instacart <a href="https://tech.instacart.com/3-million-instacart-orders-open-sourced-d40d29ead6f2">is a new entry to that list</a>. They use it to recommend groceries.</li>
<li><a href="http://www.itu.dk/people/maau/additional/sisap2017-preprint.pdf">A paper about approximate nearest neighbor benchmarks</a> was recently accepted at <a href="http://www.sisap.org/2017/">SISAP</a> and the authors were nice enough to include me as a co-author. This relates to a similar open source project I have: <a href="https://github.com/erikbern/ann-benchmarks">ann-benchmarks</a>. There's a lot going on right now with that project that will be its own blog post in the future, but one thing worth mentioning so far is I've built a number of benchmark datasets for approximate nearest neighbors that I encourage you to use if you're interested!</li>
<li>What's up next for Annoy? There's a work in progress pull request for <a href="https://github.com/spotify/annoy/pull/246">threaded index building</a> which should speed things up a lot.</li>
<li>I'm speaking about Annoy at the <a href="https://pages.dataiku.com/egg2017-non-conforming-data-science-conference">EGG2017 conference</a> in NYC on Nov 30. Feel free to drop by and say hi! It will cover basically a slightly updated version of my serious of blog posts from before: <a href="/2015/09/24/nearest-neighbor-methods-vector-models-part-1.html">part 1</a>, <a href="/2015/10/01/nearest-neighbors-and-vector-models-part-2-how-to-search-in-high-dimensional-spaces.html">part 2</a>, and <a href="/2015/10/20/nearest-neighbors-and-vector-models-epilogue-curse-of-dimensionality.html">part 3</a>. Expect a number of dad jokes about dimensionality and slides like the one below.</li>
</ul>
<p><img src="https://erikbern.com/assets/2015/10/curse-of-dimensionality.png" alt="pic"></p>
Why conversion matters: a toy model2017-10-30T00:00:00Zhttps://erikbern.com/2017/10/30/why-conversion-matters-a-toy-model.html<p><img src="https://erikbern.com/assets/funnel.gif" alt="funnel"></p>
<p>There are often close relationships between top level business metrics. For instance, it's well known that retention has a <a href="https://25iq.com/2017/01/27/everyone-poops-and-has-customer-churn-and-a-dozen-notes/">super strong impact</a> on the valuation of a subscription business. Or that the % of occupied seats is super important for an airline. A fun little <a href="https://en.wikipedia.org/wiki/Toy_model">toy model</a> that I can up with generates a curious relationship between conversion rates and revenue.</p>
<h2 id="the-intuition">The intuition</h2>
<p>Let's look at an ecommerce company. I'm working at a company that does mortgage online, for instance.</p>
<p>My intuition is roughly:</p>
<ol>
<li>Higher conversion rates means more volume. That's the obvious first order effect.</li>
<li>Higher conversion rates means better unit economics, meaning you can now acquire a bunch of customers that previously did not make sense. You can keep growing volume until the marginal acquisition cost catches up with the new break even point.</li>
</ol>
<p>Let's formalize it and make some assumptions. We need to first assume something about how aquisition costs increases with volume. Marginal CAC (customer acquisition cost) is not constant, because you have to spend a little bit more effort for every lead you acquire. So we want to pick some function that grows pretty slowly.</p>
<p>Note that it's very important not to confuse the <em>marginal</em> acquisition cost (the cost of acquiring user $$ n $$) with the <em>average</em> acquisition cost or the <em>total</em> acquisition cost. The total acquisition cost is the integral of the marginal acquisition cost so it will always grow <em>more</em> than linearly (since the marginal acquisition cost is non-decreasing).</p>
<h2 id="the-model">The model</h2>
<p>I'm going to go out on a limb here, and this is the model: the acquisition cost of lead $$ n $$ is proportional to $$ n^{0.4} $$. Let's go through the math and then let get back to the (somewhat arbitrary) choice of function.</p>
<p>This function has the property that it's reasonably slow-growing. With $$ n^{0.4} $$, the cost of acquiring lead #2000 is roughly 32% more than acquiring lead #1000.</p>
<p>Note that I'm saying the cost of <em>lead</em> $$ n $$, not user. The difference is that not all leads convert into users. The difference is the conversion rate. So the total cost of acquiring a <em>user</em> is $$ n^{0.4} / r $$ where $$ r $$ is the conversion rate.</p>
<p>We're acquiring leads as long as we make money from them, so up until the marginal acquisition cost equals some constant (basically revenue minus auxiliary costs). So $$ n^{0.4} / r = C $$ and it follows that $$ n = (Cr)^{2.5} = \mathcal{O}( r^{2.5}) $$. The weird $$ \mathcal{O} $$ symbol is just fancy notation from computer science that means that you can ignore all the constants.</p>
<p>So this is pretty interesting. Basically it says if we improve the conversion rate by 20%, the total volume will increase by 58%. This is a highly nonlinear relationship between conversion rate and volume.</p>
<h2 id="what-about-the-total-profit">What about the total profit?</h2>
<p>Ignoring all the fixed costs of running a company, the profit for each unit is some constant minus the acquisition cost:</p>
<p>$$ \int_0^n \left( C_1 - C_2 m^{0.4}/r \right) dm = \left[ C_1 m - C_2/1.4 m^{1.4}/r \right]_0^n = C_1 n - C_2/1.4 n^{1.4} / r $$</p>
<p>Plugging in the earlier expression for $$ n $$ we get</p>
<p>$$ = C_1 (r^{2.5}) - C_2/1.4 ((Cr)^{2.5})^{1.4} / r = C_3 r^{2.5} = \mathcal{O}(r^{2.5})$$</p>
<p>Magically this comes out to the same thing here – if you increase the conversion rate from say 5% to 6% (an increase by 20%), the total gross profit increases by 58%. If you <em>double</em> the conversion rate (which isn't entirely unreasonable for an early-stage startup with an unoptimized conversion funnel), then the gross profit goes up by 5.7x. Kind of sweet, and again the same nonlinear relationship between two variables.</p>
<p><img src="https://erikbern.com/assets/conversion-toy-model.png" alt="conversion chart"></p>
<p>Graphical interpretation above. The “flatter” the acquisition curve is, the more the dollar gain is. That's because a flat acquisition cost curve means we're going to have to move the breakeven quantity very quickly to the right.</p>
<h2 id="more-ruminations">More ruminations</h2>
<p>You don't think $$ n^{0.4} $$ is reasonable? Fine, make it $$ \sqrt{n} $$. You can do the same thing but instead of $$ \mathcal{O}(r^{2.5}) $$, you end up with $$ \mathcal{O}(r^2) $$.</p>
<p>Of course, it doesn't have to be a polynomial – logarithms are fine, as are exotic animals like the <a href="https://en.wikipedia.org/wiki/Lambert_W_function">Lambert W function</a>. In fact, in all those cases, the results are even more dramatic. The key thing here is that if we take a slow-growing function and <em>invert</em> it, we end up with a fast-growing function. As long as we pick a function that grows <em>less than linearly</em>, we get a <em>superlinear</em> relationship between conversion rate and gross profit.</p>
<p>So what's the right choice of function? I really think this depends on the industry. If you're selling pet rabbit tiaras, your total market size is pretty tiny, and the acquisition cost is going to shoot up very drastically once you exhausted it. The inverse of a function that shoots up is a function that stagnates, so your revenue as a function of conversion rate is almost flat.</p>
<p>But let's say you're selling mortgages (I am!) or groceries or gasoline. Then the market size is enormous and the acquisition cost will grow slowly going from user 1000 to user 10,000 to user 100,000. Anywhere we see a large company, that's a sign that the marginal acquisition cost has to grow quite slowly (otherwise it would be prohibitively expensive to compete with smaller companies) and thus as a result you can also see that conversion rates will matter in a highly nonlinear way.</p>
<p>Feel free to poke a hole in this theory and by all means please let me know if you do!</p>
On the Equifax breach and how to really prevent identity theft2017-09-26T00:00:00Zhttps://erikbern.com/2017/09/26/on-the-equifax-breach-and-how-to-really-secure-prevent-theft.html<p><img src="https://erikbern.com/assets/bar-code-tattoo.jpg" alt="bar code tattoo"></p>
<p>A funny thing about being a foreigner is how you realize people take broken things for granted. I'm going to go out on a limb here claiming that <em>the US has a pretty dumb banking system</em>. I could talk about it all day, but right now I want to focus on a very particular piece of it: <em>how to verify your identity online.</em></p>
<p>Of course, since the Equifax breach, people are freaking out about the fact that your SSN are floating around all over internet. That's bad. But what's even worse is that the system was built to fail like this eventually. SSN is a terrible secret to authenticate with. The first three numbers <a href="https://en.wikipedia.org/wiki/List_of_Social_Security_Area_Numbers">are based on the area</a>, credit checks usually allow one or even two digits to be wrong, and at some point we're going to have to recycle social security numbers from dead people. Sounds fun. So what should we do? I think the correct thing is to assume that <em>social security numbers are a publicly known number.</em></p>
<p>There's nothing weird about this. Sweden has a similar number, and while sharing is not recommended, it's certainly not a big deal.</p>
<h2 id="lets-talk-about-">Let's talk about 🇸🇪</h2>
<p>So how do you verify your identity online in Sweden? Through this wonderful thing called <a href="https://www.bankid.com/en/">BankID</a> – a service that claims 7.5M active users. This is out of a population of 10M people, meaning basically everyone has it.</p>
<p>How does it work? Basically as a two-factor authentication system. You install an app on your phone. Any time you need to identify yourself online, you usually start with your “SSN”:</p>
<p><img src="https://erikbern.com/assets/bank-id-1.png" alt="bank id 1"></p>
<p>After that, the website asks you to launch the app on the phone:</p>
<p><img src="https://erikbern.com/assets/bank-id-2.png" alt="bank id 2"></p>
<p>On the phone, you now have to approve the request by typing in a password:</p>
<p><img src="https://erikbern.com/assets/bank-id-3.jpg" alt="bank id 3"></p>
<p>Sweden's version of the IRS uses it if you want to pay your taxes online. You can even use it to buy stuff. The most sick thing though, is that BankID has an API. So if you're some random third party whatever provider, and you want to verify the identity of a person, you can integrate it. There's a bunch of <a href="https://www.npmjs.com/browse/keyword/bankid">node packages</a> even.</p>
<p>How do you get a BankID though? Online banks offer to set you up. And online banks always use two-factor authentications in Sweden, usually through a physical device that you have to pick up at a bank branch (where you have to go visit and show an ID card or drivers license to pick it up… the card carries biometric information so is very hard to forge).</p>
<p>So why does this work? Basically everyone in Sweden has a bank account. There's only a handful of banks, which are pretty much colluding to some extent, but on the other hand the government has regulated all their fees down to basically zero, meaning they don't make all their money <a href="https://www.amazon.com/Unbanking-America-Middle-Class-Survives-ebook/dp/B01912OYO0">screwing lower income people</a>. So I think Sweden ended up in some kind of weird Nash equilibrium where there's so few of them that collaborating on an ID service is not very hard, and they are regulated enough to realize they might as well take their fees and try to build useful consumer products out of it. It's not just this. They also built <a href="https://en.wikipedia.org/wiki/Swish_(payment)">their own version of Venmo</a> that something like 70% of the population uses.</p>
<p>Anyway, I think the probability that this will ever happen in the US is roughly zero, sadly. The banking industry is too fragmented and many people don't have bank accounts, so we can rule out that player. The federal government would never do it, but maybe adopt it if someone else does it. So I think realistically maybe the only one that could pull something off is if the state like California adopts it. More specifically maybe the <a href="http://www.taxes.ca.gov">Tax Service Center</a> or <a href="https://www.dmv.ca.gov/portal/dmv">DMV</a>. But I don't know, and I'm not going to describe a comprehensive launch plan here. All I can do is dream of a time where the US would actually do digital infrastructure efficiently.</p>
The number of letters in the word for each number2017-09-06T00:00:00Zhttps://erikbern.com/2017/09/06/the-number-of-letters-in-the-word-for-each-number.html<p>Just for fun, I generated these graphs of the number of letters in the word for each number. I really spent about 10 minutes on this (ok…possibly also another 40 minutes tweaking the plots):</p>
<p><img src="https://erikbern.com/assets/num-letters-en.png" alt="en"></p>
<p>More languages!!</p>
<p><img src="https://erikbern.com/assets/num-letters-es.png" alt="es"></p>
<p>I love how Spanish has a few super compact words: “cien mil” for 100,000 for instance. Only eight letters, versus English “one hundred thousand” (20 letters).</p>
<p><img src="https://erikbern.com/assets/num-letters-fr.png" alt="fr"></p>
<p>I don't know much about French but I think they have some kind of weird system based on 20s. Which by the way also Danish has.</p>
<p><img src="https://erikbern.com/assets/num-letters-de.png" alt="de"></p>
<p>If your stereotype of German is long words, you won't be disappointed. <em>Siebenhundertsiebenundzwanzigtausentsiebenhundertsiebenundzwanzig</em>. But I also think that fascination is somewhat misguided – German (and many languages like Swedish) just compounds words when other languages would put a space in between. Big deal.</p>
<p>But anyway, speaking of stereotypes, look at the <em>regularity</em> of this chart. <em>Ordnung muss sein.</em> Turns out the reason is mostly that the German words for multiple of ten all have the same length: zwanzig, dreißig, vierzig, fünfzig, …</p>
<p><img src="https://erikbern.com/assets/num-letters-ar.png" alt="ar">
<img src="https://erikbern.com/assets/num-letters-ru.png" alt="ru"></p>
<p>Overall, I kind of like the jagged form of the curves… there's something fractal about it.</p>
<p>Roman numerals… because I don't have anything better to do:</p>
<p><img src="https://erikbern.com/assets/num-letters-ro.png" alt="ro"></p>
<p>Finally here's the <em>cumulative average length</em> of each language, all on one chart:</p>
<p><img src="https://erikbern.com/assets/num-letters-avg.png" alt="avg"></p>
<p>It's a bit interesting to note that English has longer words than any of the other languages. And Arabic seems most compact, which is sort of interesting.</p>
<p>All of this was done using the <a href="https://github.com/savoirfairelinux/num2words">num2words</a> Python library. Full code below:</p>
<div class="highlight"><pre style="color:#f8f8f2;background-color:#272822;-moz-tab-size:4;-o-tab-size:4;tab-size:4"><code class="language-python" data-lang="python"><span style="color:#f92672">from</span> num2words <span style="color:#f92672">import</span> num2words
<span style="color:#f92672">from</span> matplotlib <span style="color:#f92672">import</span> pyplot
<span style="color:#f92672">import</span> numpy
<span style="color:#f92672">import</span> roman
<span style="color:#66d9ef">def</span> <span style="color:#a6e22e">l</span>(lang):
<span style="color:#66d9ef">return</span> <span style="color:#66d9ef">lambda</span> i: num2words(i, lang<span style="color:#f92672">=</span>lang)
<span style="color:#66d9ef">def</span> <span style="color:#a6e22e">r</span>(i):
<span style="color:#66d9ef">if</span> i <span style="color:#f92672">==</span> <span style="color:#ae81ff">0</span>: <span style="color:#66d9ef">return</span> <span style="color:#e6db74"></span><span style="color:#e6db74">'</span><span style="color:#e6db74">nulla</span><span style="color:#e6db74">'</span>
<span style="color:#66d9ef">if</span> i <span style="color:#f92672"><</span> <span style="color:#ae81ff">5000</span>: <span style="color:#66d9ef">return</span> roman<span style="color:#f92672">.</span>toRoman(i)
<span style="color:#66d9ef">else</span>: <span style="color:#66d9ef">return</span> <span style="color:#e6db74"></span><span style="color:#e6db74">'</span><span style="color:#e6db74">'</span><span style="color:#f92672">.</span>join(c <span style="color:#f92672">+</span> <span style="color:#e6db74"></span><span style="color:#e6db74">'</span><span style="color:#ae81ff">\u0305</span><span style="color:#e6db74">'</span> <span style="color:#66d9ef">for</span> c <span style="color:#f92672">in</span> roman<span style="color:#f92672">.</span>toRoman(i<span style="color:#f92672">/</span><span style="color:#f92672">/</span><span style="color:#ae81ff">1000</span>)) <span style="color:#f92672">+</span> \
(i<span style="color:#f92672">%</span><span style="color:#ae81ff">1000</span> <span style="color:#f92672">and</span> roman<span style="color:#f92672">.</span>toRoman(i<span style="color:#f92672">%</span><span style="color:#ae81ff">1000</span>) <span style="color:#f92672">or</span> <span style="color:#e6db74"></span><span style="color:#e6db74">'</span><span style="color:#e6db74">'</span>)
data <span style="color:#f92672">=</span> []
<span style="color:#66d9ef">for</span> lang, func, language, color <span style="color:#f92672">in</span> [
(<span style="color:#e6db74"></span><span style="color:#e6db74">'</span><span style="color:#e6db74">ro</span><span style="color:#e6db74">'</span>, r, <span style="color:#e6db74"></span><span style="color:#e6db74">'</span><span style="color:#e6db74">Roman</span><span style="color:#e6db74">'</span>, <span style="color:#e6db74"></span><span style="color:#e6db74">'</span><span style="color:#e6db74">orange</span><span style="color:#e6db74">'</span>),
(<span style="color:#e6db74"></span><span style="color:#e6db74">'</span><span style="color:#e6db74">en</span><span style="color:#e6db74">'</span>, <span style="color:#66d9ef">lambda</span> i: num2words(i)<span style="color:#f92672">.</span>replace(<span style="color:#e6db74"></span><span style="color:#e6db74">'</span><span style="color:#e6db74"> and</span><span style="color:#e6db74">'</span>, <span style="color:#e6db74"></span><span style="color:#e6db74">'</span><span style="color:#e6db74">'</span>), <span style="color:#e6db74"></span><span style="color:#e6db74">'</span><span style="color:#e6db74">English</span><span style="color:#e6db74">'</span>, <span style="color:#e6db74"></span><span style="color:#e6db74">'</span><span style="color:#e6db74">blue</span><span style="color:#e6db74">'</span>),
(<span style="color:#e6db74"></span><span style="color:#e6db74">'</span><span style="color:#e6db74">fr</span><span style="color:#e6db74">'</span>, l(<span style="color:#e6db74"></span><span style="color:#e6db74">'</span><span style="color:#e6db74">fr</span><span style="color:#e6db74">'</span>), <span style="color:#e6db74"></span><span style="color:#e6db74">'</span><span style="color:#e6db74">French</span><span style="color:#e6db74">'</span>, <span style="color:#e6db74"></span><span style="color:#e6db74">'</span><span style="color:#e6db74">red</span><span style="color:#e6db74">'</span>),
(<span style="color:#e6db74"></span><span style="color:#e6db74">'</span><span style="color:#e6db74">de</span><span style="color:#e6db74">'</span>, l(<span style="color:#e6db74"></span><span style="color:#e6db74">'</span><span style="color:#e6db74">de</span><span style="color:#e6db74">'</span>), <span style="color:#e6db74"></span><span style="color:#e6db74">'</span><span style="color:#e6db74">German</span><span style="color:#e6db74">'</span>, <span style="color:#e6db74"></span><span style="color:#e6db74">'</span><span style="color:#e6db74">black</span><span style="color:#e6db74">'</span>),
(<span style="color:#e6db74"></span><span style="color:#e6db74">'</span><span style="color:#e6db74">es</span><span style="color:#e6db74">'</span>, l(<span style="color:#e6db74"></span><span style="color:#e6db74">'</span><span style="color:#e6db74">es</span><span style="color:#e6db74">'</span>), <span style="color:#e6db74"></span><span style="color:#e6db74">'</span><span style="color:#e6db74">Spanish</span><span style="color:#e6db74">'</span>, <span style="color:#e6db74"></span><span style="color:#e6db74">'</span><span style="color:#e6db74">yellow</span><span style="color:#e6db74">'</span>),
(<span style="color:#e6db74"></span><span style="color:#e6db74">'</span><span style="color:#e6db74">ar</span><span style="color:#e6db74">'</span>, l(<span style="color:#e6db74"></span><span style="color:#e6db74">'</span><span style="color:#e6db74">ar</span><span style="color:#e6db74">'</span>), <span style="color:#e6db74"></span><span style="color:#e6db74">'</span><span style="color:#e6db74">Arabic</span><span style="color:#e6db74">'</span>, <span style="color:#e6db74"></span><span style="color:#e6db74">'</span><span style="color:#e6db74">green</span><span style="color:#e6db74">'</span>),
(<span style="color:#e6db74"></span><span style="color:#e6db74">'</span><span style="color:#e6db74">ru</span><span style="color:#e6db74">'</span>, l(<span style="color:#e6db74"></span><span style="color:#e6db74">'</span><span style="color:#e6db74">ru</span><span style="color:#e6db74">'</span>), <span style="color:#e6db74"></span><span style="color:#e6db74">'</span><span style="color:#e6db74">Russian</span><span style="color:#e6db74">'</span>, <span style="color:#e6db74"></span><span style="color:#e6db74">'</span><span style="color:#e6db74">purple</span><span style="color:#e6db74">'</span>)]:
words <span style="color:#f92672">=</span> [func(i) <span style="color:#66d9ef">for</span> i <span style="color:#f92672">in</span> range(<span style="color:#ae81ff">1000000</span>)]
fig <span style="color:#f92672">=</span> pyplot<span style="color:#f92672">.</span>figure(dpi<span style="color:#f92672">=</span><span style="color:#ae81ff">288</span>, figsize<span style="color:#f92672">=</span>(<span style="color:#ae81ff">9</span>, <span style="color:#ae81ff">7</span>))
ax <span style="color:#f92672">=</span> fig<span style="color:#f92672">.</span>add_subplot(<span style="color:#ae81ff">111</span>)
lens <span style="color:#f92672">=</span> numpy<span style="color:#f92672">.</span>array([len(word) <span style="color:#66d9ef">for</span> word <span style="color:#f92672">in</span> words])
ax<span style="color:#f92672">.</span>semilogx(lens, color<span style="color:#f92672">=</span>color)
data<span style="color:#f92672">.</span>append((language, color, lens))
<span style="color:#66d9ef">for</span> p <span style="color:#f92672">in</span> range(<span style="color:#ae81ff">0</span>, <span style="color:#ae81ff">6</span>):
lo, hi <span style="color:#f92672">=</span> <span style="color:#ae81ff">10</span><span style="color:#f92672">*</span><span style="color:#f92672">*</span>p, <span style="color:#ae81ff">10</span><span style="color:#f92672">*</span><span style="color:#f92672">*</span>(p<span style="color:#f92672">+</span><span style="color:#ae81ff">1</span>)
<span style="color:#66d9ef">if</span> hi <span style="color:#f92672">></span> len(words):
<span style="color:#66d9ef">break</span>
x_max <span style="color:#f92672">=</span> max(range(lo, hi), key<span style="color:#f92672">=</span><span style="color:#66d9ef">lambda</span> x: len(words[x]))
kwargs <span style="color:#f92672">=</span> dict(horizontalalignment<span style="color:#f92672">=</span><span style="color:#e6db74"></span><span style="color:#e6db74">'</span><span style="color:#e6db74">right</span><span style="color:#e6db74">'</span>,
arrowprops<span style="color:#f92672">=</span>dict(shrink<span style="color:#f92672">=</span><span style="color:#ae81ff">0.05</span>,
width<span style="color:#f92672">=</span><span style="color:#ae81ff">2.0</span>,
headwidth<span style="color:#f92672">=</span><span style="color:#ae81ff">5.0</span>,
headlength<span style="color:#f92672">=</span><span style="color:#ae81ff">2.0</span>,
facecolor<span style="color:#f92672">=</span><span style="color:#e6db74"></span><span style="color:#e6db74">'</span><span style="color:#e6db74">black</span><span style="color:#e6db74">'</span>))
ax<span style="color:#f92672">.</span>annotate(<span style="color:#e6db74"></span><span style="color:#e6db74">'</span><span style="color:#e6db74">%d</span><span style="color:#e6db74">: </span><span style="color:#e6db74">"</span><span style="color:#e6db74">%s</span><span style="color:#e6db74">"</span><span style="color:#e6db74"> (</span><span style="color:#e6db74">%d</span><span style="color:#e6db74">)</span><span style="color:#e6db74">'</span> <span style="color:#f92672">%</span> (len(words[x_max]), words[x_max], x_max),
xy<span style="color:#f92672">=</span>(x_max, len(words[x_max])),
xytext<span style="color:#f92672">=</span>(x_max, len(words[x_max])<span style="color:#f92672">+</span><span style="color:#ae81ff">10</span>), <span style="color:#f92672">*</span><span style="color:#f92672">*</span>kwargs)
pyplot<span style="color:#f92672">.</span>xlim([<span style="color:#ae81ff">1</span>, len(words)])
pyplot<span style="color:#f92672">.</span>ylim([<span style="color:#ae81ff">0</span>, <span style="color:#ae81ff">100</span>])
pyplot<span style="color:#f92672">.</span>title(<span style="color:#e6db74"></span><span style="color:#e6db74">'</span><span style="color:#e6db74">Number of letters of the </span><span style="color:#e6db74">%s</span><span style="color:#e6db74"> word for each number</span><span style="color:#e6db74">'</span> <span style="color:#f92672">%</span> language)
pyplot<span style="color:#f92672">.</span>tight_layout()
pyplot<span style="color:#f92672">.</span>savefig(<span style="color:#e6db74"></span><span style="color:#e6db74">'</span><span style="color:#e6db74">num-letters-</span><span style="color:#e6db74">%s</span><span style="color:#e6db74">.png</span><span style="color:#e6db74">'</span> <span style="color:#f92672">%</span> lang)
fig <span style="color:#f92672">=</span> pyplot<span style="color:#f92672">.</span>figure(dpi<span style="color:#f92672">=</span><span style="color:#ae81ff">288</span>, figsize<span style="color:#f92672">=</span>(<span style="color:#ae81ff">9</span>, <span style="color:#ae81ff">7</span>))
ax <span style="color:#f92672">=</span> fig<span style="color:#f92672">.</span>add_subplot(<span style="color:#ae81ff">111</span>)
<span style="color:#66d9ef">for</span> language, color, lens <span style="color:#f92672">in</span> data:
avgs <span style="color:#f92672">=</span> numpy<span style="color:#f92672">.</span>cumsum(lens[<span style="color:#ae81ff">1</span>:]) <span style="color:#f92672">/</span> (numpy<span style="color:#f92672">.</span>arange(<span style="color:#ae81ff">1</span>, len(lens)))
ax<span style="color:#f92672">.</span>semilogx(numpy<span style="color:#f92672">.</span>arange(<span style="color:#ae81ff">1</span>, len(lens)),
avgs,
color<span style="color:#f92672">=</span>color,
label<span style="color:#f92672">=</span>language)
pyplot<span style="color:#f92672">.</span>xlim([<span style="color:#ae81ff">1</span>, len(lens)])
pyplot<span style="color:#f92672">.</span>ylim([<span style="color:#ae81ff">0</span>, <span style="color:#ae81ff">100</span>])
pyplot<span style="color:#f92672">.</span>legend()
pyplot<span style="color:#f92672">.</span>title(<span style="color:#e6db74"></span><span style="color:#e6db74">'</span><span style="color:#e6db74">Cumulative average number of letters of the word for each number</span><span style="color:#e6db74">'</span>)
pyplot<span style="color:#f92672">.</span>tight_layout()
pyplot<span style="color:#f92672">.</span>savefig(<span style="color:#e6db74"></span><span style="color:#e6db74">'</span><span style="color:#e6db74">num-letters-avg.png</span><span style="color:#e6db74">'</span>)
</code></pre></div>The software engineering rule of 32017-08-29T00:00:00Zhttps://erikbern.com/2017/08/29/the-software-engineering-rule-of-3.html<p>Here's a <del>dumb</del> extremely accurate rule I'm postulating* for software engineering projects: *you need at least 3 examples before you solve the right problem*.</p>
<p>This is what I've noticed:</p>
<ol>
<li>Don't factor out shared code between two classes. Wait until you have at least three.</li>
<li>The two first attempts to solve a problem will fail because you misunderstood the problem. The third time it will work.</li>
<li>Any attempt at being smart earlier will end up overfitting to coincidental patterns.</li>
</ol>
<p>(Note that #1 and #2 are actually pretty different implications. But let's get back to that later.)</p>
<h2 id="whats-he-talking-about-example-plz">What's he talking about? Example plz</h2>
<p>Let's say you're implementing a class that scrapes data from banks. This is an extremely dumbed down version, but should illustrate the point:</p>
<div class="highlight"><pre style="color:#f8f8f2;background-color:#272822;-moz-tab-size:4;-o-tab-size:4;tab-size:4"><code class="language-python" data-lang="python"><span style="color:#66d9ef">class</span> <span style="color:#a6e22e">ChaseScraper</span>:
<span style="color:#66d9ef">def</span> __init__(self, username, password):
self<span style="color:#f92672">.</span>_username <span style="color:#f92672">=</span> username
self<span style="color:#f92672">.</span>_password <span style="color:#f92672">=</span> password
<span style="color:#66d9ef">def</span> <span style="color:#a6e22e">scrape</span>(self):
session <span style="color:#f92672">=</span> requests<span style="color:#f92672">.</span>Session()
sessions<span style="color:#f92672">.</span>get(<span style="color:#e6db74"></span><span style="color:#e6db74">'</span><span style="color:#e6db74">https://chase.com/rest/login.aspx</span><span style="color:#e6db74">'</span>,
data<span style="color:#f92672">=</span>{<span style="color:#e6db74"></span><span style="color:#e6db74">'</span><span style="color:#e6db74">username</span><span style="color:#e6db74">'</span>: self<span style="color:#f92672">.</span>_username,
<span style="color:#e6db74"></span><span style="color:#e6db74">'</span><span style="color:#e6db74">password</span><span style="color:#e6db74">'</span>: self<span style="color:#f92672">.</span>_password})
sessions<span style="color:#f92672">.</span>get(<span style="color:#e6db74"></span><span style="color:#e6db74">'</span><span style="color:#e6db74">https://chase.com/rest/download_current_statement.aspx</span><span style="color:#e6db74">'</span>)
</code></pre></div><p>Now, you want to add a second class <code>CitibankScraper</code> that implements the same interface, but changes a few implementation detail. In fact let's say the only changes are that Citibank has different URLs and that their form element have slightly different names. So we add a new scraper</p>
<div class="highlight"><pre style="color:#f8f8f2;background-color:#272822;-moz-tab-size:4;-o-tab-size:4;tab-size:4"><code class="language-python" data-lang="python"><span style="color:#66d9ef">class</span> <span style="color:#a6e22e">CitibankScraper</span>:
<span style="color:#66d9ef">def</span> __init__(self, username, password):
self<span style="color:#f92672">.</span>_username <span style="color:#f92672">=</span> username
self<span style="color:#f92672">.</span>_password <span style="color:#f92672">=</span> password
<span style="color:#66d9ef">def</span> <span style="color:#a6e22e">scrape</span>(self):
session <span style="color:#f92672">=</span> requests<span style="color:#f92672">.</span>Session()
sessions<span style="color:#f92672">.</span>get(<span style="color:#e6db74"></span><span style="color:#e6db74">'</span><span style="color:#e6db74">https://citibank.com/cgi-bin/login.pl</span><span style="color:#e6db74">'</span>,
data<span style="color:#f92672">=</span>{<span style="color:#e6db74"></span><span style="color:#e6db74">'</span><span style="color:#e6db74">user</span><span style="color:#e6db74">'</span>: self<span style="color:#f92672">.</span>_username,
<span style="color:#e6db74"></span><span style="color:#e6db74">'</span><span style="color:#e6db74">pass</span><span style="color:#e6db74">'</span>: self<span style="color:#f92672">.</span>_password})
sessions<span style="color:#f92672">.</span>get(<span style="color:#e6db74"></span><span style="color:#e6db74">'</span><span style="color:#e6db74">https://citibank.com/cgi-bin/download-stmt.pl</span><span style="color:#e6db74">'</span>)
</code></pre></div><p>At this point after many years of being taught that we need to keep it “DRY” (don't repeat yourself) we go <em>ermahgerd, cerd derplication!!!</em> and factor out everything into a base class. In this case it means <a href="https://en.wikipedia.org/wiki/Overfitting">inverting the control</a> and let the base class take over the control flow:</p>
<div class="highlight"><pre style="color:#f8f8f2;background-color:#272822;-moz-tab-size:4;-o-tab-size:4;tab-size:4"><code class="language-python" data-lang="python"><span style="color:#66d9ef">class</span> <span style="color:#a6e22e">BaseScraper</span>:
<span style="color:#66d9ef">def</span> __init__(self, username, password):
self<span style="color:#f92672">.</span>_username <span style="color:#f92672">=</span> username
self<span style="color:#f92672">.</span>_password <span style="color:#f92672">=</span> password
<span style="color:#66d9ef">def</span> <span style="color:#a6e22e">scrape</span>(self):
session <span style="color:#f92672">=</span> requests<span style="color:#f92672">.</span>Session()
sessions<span style="color:#f92672">.</span>get(self<span style="color:#f92672">.</span>_LOGIN_URL,
data<span style="color:#f92672">=</span>{self<span style="color:#f92672">.</span>_USERNAME_FORM_KEY: self<span style="color:#f92672">.</span>_username,
self<span style="color:#f92672">.</span>_PASSWORD_FORM_KEY: self<span style="color:#f92672">.</span>_password})
sessions<span style="color:#f92672">.</span>get(self<span style="color:#f92672">.</span>_STATEMENT_URL)
<span style="color:#66d9ef">class</span> <span style="color:#a6e22e">ChaseScraper</span>(BaseScraper):
_LOGIN_URL <span style="color:#f92672">=</span> <span style="color:#e6db74"></span><span style="color:#e6db74">'</span><span style="color:#e6db74">https://chase.com/rest/login.aspx</span><span style="color:#e6db74">'</span>
_STATEMENT_URL <span style="color:#f92672">=</span> <span style="color:#e6db74"></span><span style="color:#e6db74">'</span><span style="color:#e6db74">https://chase.com/rest/download_current_statement.aspx</span><span style="color:#e6db74">'</span>
_USERNAME_FORM_KEY <span style="color:#f92672">=</span> <span style="color:#e6db74"></span><span style="color:#e6db74">'</span><span style="color:#e6db74">username</span><span style="color:#e6db74">'</span>
_PASSWORD_FORM_KEY <span style="color:#f92672">=</span> <span style="color:#e6db74"></span><span style="color:#e6db74">'</span><span style="color:#e6db74">password</span><span style="color:#e6db74">'</span>
<span style="color:#66d9ef">class</span> <span style="color:#a6e22e">CitibankScraper</span>(BaseScraper):
_LOGIN_URL <span style="color:#f92672">=</span> <span style="color:#e6db74"></span><span style="color:#e6db74">'</span><span style="color:#e6db74">https://citibank.com/cgi-bin/login.pl</span><span style="color:#e6db74">'</span>
_STATEMENT_URL <span style="color:#f92672">=</span> <span style="color:#e6db74"></span><span style="color:#e6db74">'</span><span style="color:#e6db74">https://citibank.com/cgi-bin/download-stmt.pl</span><span style="color:#e6db74">'</span>
_USERNAME_FORM_KEY <span style="color:#f92672">=</span> <span style="color:#e6db74"></span><span style="color:#e6db74">'</span><span style="color:#e6db74">user</span><span style="color:#e6db74">'</span>
_PASSWORD_FORM_KEY <span style="color:#f92672">=</span> <span style="color:#e6db74"></span><span style="color:#e6db74">'</span><span style="color:#e6db74">pass</span><span style="color:#e6db74">'</span>
</code></pre></div><p>This would let us remove a lot of lines of code. It's one of the most compact ways we can implement these two bank statement providers here. So what's wrong with this code? (Apart from the general antipattern of implementation inheritance).</p>
<p>The problem is we're <em>overfitting massively</em> to a pattern here! What do I mean with overfitting? We're seeing patterns that really don't generalize well.</p>
<p><img src="https://erikbern.com/assets/facepalm.jpg" alt="facepalm"></p>
<p>To see this, let's say we add a third provider that is slightly different. Maybe it's one or more of the following:</p>
<ul>
<li>It requires 2-factor authentication</li>
<li>Credentials are sent using JSON</li>
<li>Login is a POST rather than a GET</li>
<li>It requires visiting multiple pages in a row</li>
<li>The statement url is generated dynamically based on the current date</li>
</ul>
<p>… or whatever, there is another 1000 ways this could break down. I hope you see the problem here. We thought we had a pattern after the first two scrapers! It turns out there really wasn't that much that generalized to the third provider (and more generally, to the <em>n</em>th). In other words, we <em>overfit</em>.</p>
<h2 id="what-does-erik-mean-by-overfitting">What does Erik mean by overfitting?</h2>
<p>So <a href="https://en.wikipedia.org/wiki/Overfitting">overfitting</a> is a term for when see patterns in data and those patterns don't generalize. When coding we're often hyper-vigilant about optimizing for code deduplication, we detect <em>incidental</em> patterns that may not be representative of the full breadth of pattern that we would see if we knew all the different applications. So after implementing two bank scrapers we see a pattern that we think applies more generally, but really it doesn't.</p>
<p>Note that <em>code duplication isn't always such a bad thing</em>. Engineers often focus way too much on reducing duplicated code. But care has to be taken to distinguish between code duplication that's <em>incidental</em> versus code duplication that's <em>systemic</em>.</p>
<p>Thus, let me introduce the <em>first rule of 3</em>. Don't worry so much about code duplication if you only have two classes or two functions or whatever. When you see a pattern in <em>three</em> different places, it's worth thinking about how to factor it out.</p>
<h2 id="rule-of-3-as-applied-to-architecture">Rule of 3 as applied to architecture</h2>
<p>The same reasoning applies to system design but with a very different conclusion. When you build a new system from scratch, and you have no idea about how it's eventually going to be used, <em>don't get too attached to assumptions</em>. The constraints you think you really need for the 1st and the 2nd implementation seem absolutely crucial, but you're going to realize that you got it all wrong and the 3rd implementation is really the one where most of the things are right. Ok, this is obviously all <em>extreme</em> blanket statements here. Don't use my advice for brain surgery or nuclear fission.</p>
<p>As an example, <a href="https://github.com/spotify/luigi">Luigi</a> was the third attempt at solving the problem. The first two attempts solved the wrong problem or optimized for the wrong thing. For instance the first iteration relied on specifying the dependency graph in XML. But this turned out to be super annoying for the reason that you really want the ability to build the dependency graph programmatically. Conversely a bunch of things in the first two attempts that seemed really useful, like decoupling outputs from tasks, ended up adding far more complexity only to support some obscure edge cases.</p>
<p>What would have seem like obscure niche cases in the first iteration because very central in the final iteration, and <em>vice versa</em>.</p>
<p>I was reminded of this when we built an email ingestion system at <a href="https://better.com">Better</a>. The first attempt failed because we built it in a poor way (basically shoehorning it into a CRUD request). The second one had a solid microservice design but failed for usability reasons (we built a product that no one really asked for). We're halfway through the third attempt and I'm having a good feeling about it.</p>
<p>These stories illustrate the <em>second rule of 3</em> – you're not going to get the system design right until the third time you build it.</p>
<p>More importantly, if you are building the first implementation of some hairy unknown problem, don't assume you're going to nail it. Take shortcuts. Hack around nasty problems. You're probably not going to keep this system anyway – at some point it's going to break. And then the second version breaks most of the time. The <em>third</em> though – that's when you perfect it.</p>
<p><img src="https://erikbern.com/assets/three-cupcakes.jpg" alt="three cupcakes"></p>
<h2 id="notes">Notes</h2>
<ul>
<li><a href="https://news.ycombinator.com/item?id=15129689">Hacker news discussion</a></li>
<li><a href="https://www.reddit.com/r/programming/comments/6wws46/the_software_engineering_rule_of_3_you_need_at/">Reddit discussion</a> on /r/programming/</li>
<li>People on the internet pointed out that this rule already exists <a href="https://blog.codinghorror.com/rule-of-three/">[1]</a> <a href="http://wiki.c2.com/?RuleOfThree">[2]</a> <a href="https://en.wikipedia.org/wiki/Rule_of_three_(computer_programming)">[3]</a>. I wasn't aware of any of those, but it's highly likely I've read it at some point a long time ago. Not trying to misappropriate ideas that have been around for a long time!</li>
</ul>
Machine, Platform, Crowd2017-08-19T00:00:00Zhttps://erikbern.com/2017/08/19/machine-platform-crowd.html<p>I just bought <a href="https://www.amazon.com/dp/0393254291">Machine, Platform, Crowd: Harnessing Our Digital Future</a> and discovered that it mentions my blog – in particular the post <a href="https://erikbern.com/2016/08/05/when-machine-learning-matters.html">When machine learning matters</a>.</p>
<p><img src="https://erikbern.com/assets/machine_platform_crowd.jpeg" alt="machine, platform, crowd p. 146"></p>
<p>Ok, I lied a little bit. I didn't discover it serendipitously. Someone actually emailed me saying I was mentioned, and so I ordered the book for same-day delivery. But I was seriously planning to read the book anyway – having read both <a href="https://www.amazon.com/Second-Machine-Age-Prosperity-Technologies/dp/0393350649">The Second Machine Age</a> and <a href="https://www.amazon.com/Race-Against-Machine-Accelerating-Productivity/dp/0984725113">Rage Against the Machine</a> – they are great books <em>and I'm not being biased</em>.</p>
<p>What's next? Hoping my blog will be mentioned in a Broadway musical in a few years.</p>
<p>As a complete side note, Erik Brynjolfsson has a conspicuously similar name to mine. Just for fun, I computed the <a href="https://en.wikipedia.org/wiki/Levenshtein_distance">Levenshtein distance</a> of my name against every Wikipedia article. <a href="https://en.wikipedia.org/wiki/Erik_Brynjolfsson">Erik Brynjolfsson</a> has distance 6, and as it turns out is the closest one <em>out of all Wikipedia articles.</em> Now you know!</p>
Google diversity memo, global warming, Pascal's wager, and other stuff2017-08-14T00:00:00Zhttps://erikbern.com/2017/08/14/google-diversity-memo-global-warming-pascals-wager.html<p>There's about 765 million blog posts about the diversity “memo” that leaked out of Google a couple of weeks ago. I think the case for any biological difference is pretty weak, and it bothers me when people refer to an “interest gap” as anything else than caused by the environment. Maybe because I have a daughter, maybe because I have too many female friends who told me stories how they were held back or discriminated against.</p>
<p>But disregarding my own opinion here, something else kept me annoyed for days. It seems like the all the arguments and counterarguments are very hung up on <em>science</em> and <em>proof</em> and it struck me as a very binary view of the world. It's great that we have research, but as long as people can cite studies showing almost anything, I'm not sure it really settles the debate. Anyway, I think there's a weird meta-argument that is also somewhat interesting when you think of it in terms of probabilities instead. I think it lays out the case for action almost no matter what causes you think the gender imbalance has.</p>
<p>Let me explain what I mean. Let's say the gender imbalance could be explained x% by biology and y% by the environment (nature vs nurture). So obviously it adds up to 100%. x and y could even be negative (eg women have a higher ability than men, but peer pressure and discrimination and whatever makes y larger than 1). Or maybe you think it's the other way around… I welcome you to my blog either way.</p>
<p>Now, an ultra hardcore conservative might say that it's 100% explained by nature and the whole mass of their probability distribution at x = 1, and a super progressive liberal would do the other way around. But come on… if you really had to bet money on it, would you bet your entire fortune that x is exactly 0? Let's say the odds are that you make one dollar if you're right, and lose <em>all your money</em> if you're wrong. So in general, everyone's belief is a probability distribution, like something like this:</p>
<p><img src="https://erikbern.com/assets/normal_distributions.gif" alt="normal distributions"></p>
<p>Of course, we're never going to figure out the true value of x, but let's assume some alien is able to replicate Earth inside a simulator and keeps tweaking various parameter so they can figure out x with 9 decimals precision. And they come to Earth one day and offer to sell a contract that pays $x. What would you pay for that contract? I would probably buy it at -$0.3 and sell it at $0.3 personally – some old fashioned person might buy at $0.3 and sell at $0.8 or something. I don't know. Most people would assign some probability mass across a wide interval, reflecting some kind of uncertainty.</p>
<p>This hypothetical setup reminds me of my feelings when I read arguments trying to disprove or prove global warming. It's all fine, and I'm a big supporter of research. But at the end of the day we're still going to end up with some probability distribution. Sometimes I wonder if the focus on the “truthiness” prevents action. Instead of getting together across the spectrum and saying that <em>x has some uncertainty, let's act accordingly</em>, we get stuck trying to debate if x is exactly 0.0 (<em>no</em> human contribution to the Earth's temperature) or exactly 1.0 (<em>all</em> of the temperature increase in the last 100 years is caused by humans).</p>
<p>It gets more interesting when you weigh the uncertainty with the cost of action/inaction. So for every course of action, integrate over the probability distribution and multiply with the impact of action minus the cost of action.</p>
<p>In the case of climate change, let's say we can prevent human extinction from happening with 1% probability. That's worth spending a lot of money on! Similarly, regardless of your thoughts biological determinism, diversity efforts seems like a pretty good thing to focus on. Worst case it's an insurance, best case it's an investment.</p>
<h2 id="notes">Notes</h2>
<ul>
<li>I updated this blog post to incorporate my own values since I realized I feel too strongly to write a neutral one. I also updated the choice of probability distribution (Beta is not a good choice).</li>
<li>A funny thing when you do these cost analyses is that it's basically some weird form of <a href="https://en.wikipedia.org/wiki/Pascal%27s_Wager">Pascal's wager</a> in disguise. Pascal's “bet” was that not believing in God had pretty limited downside but potentially infinite downside (at least my layman recollection).</li>
<li>We actually <em>do</em> discuss this uncertainty sometimes – for instance spending money preventing some uncertain number of terrorist victims. It's not that we talk about the actual probabilities, but no one is hung up about trying to <em>prove</em> or <em>disprove</em> that there will be a terrorist attack. There's a debate about exactly <em>how much money</em> we should spend, but I don't think anyone is suggesting it should be $0.</li>
<li>Of course it gets a lot more complicated if you actually try to do the math, since you can't really assign probabilities. It's some kind of <a href="https://en.wikipedia.org/wiki/Knightian_uncertainty">Knightian uncertainty</a>, which is sort of what Donald Rumsfeld referred to as <a href="https://en.wikipedia.org/wiki/There_are_known_knowns">“Unknown unknowns”</a>.</li>
<li>The argument about global warming isn't exactly a novel idea, but surprisingly I haven't heard it many times. Maybe I have lame friends.</li>
</ul>
Fun with trigonometry: the world's most twisted coastline2017-07-12T00:00:00Zhttps://erikbern.com/2017/07/12/the-most-twisted-coastline.html<p>I just spent a few days in Italy, on the Ligurian coast. Even though we were on the west side of Italy, the Mediterranean sea was to the east, because the house was situated on a long bay. But zooming in even more, there were parts of the coast that were even more twisted – to the point where it had turned a full 360 degress so you ended up having the sea to the west again.</p>
<p><img src="https://erikbern.com/assets/italy-1-thumbnail.png" alt="italy 1">
<img src="https://erikbern.com/assets/italy-2-thumbnail.png" alt="italy 2"></p>
<p>Anyway, that made me curious – what's the world's most twisted coastline? If you trace the coastline along the Eurasian landmass, and keeps track of its direction, does it ever turn more 360 degrees? 720 degrees? 1040 degrees? Or, in radians, $$ 2\pi, 4\pi, 8\pi \ldots $$?</p>
<h2 id="the-data">The data</h2>
<p>You can download <a href="http://openstreetmapdata.com/data/coastlines">coastline data</a> from OpenStreetMap. It turns out it's not perfectly joined, so I ended up using the <a href="http://openstreetmapdata.com/data/land-polygons">land polygon data</a> instead. The slight drawback is that larger islands/continents are broken down into many polygons. Should not make an enormous difference. All in all there's 587,205 distinct land polygons, each with a few hundred to thousands of vertices.</p>
<h2 id="the-math">The math</h2>
<p>I have something weird to admit. I actually kind of enjoy trigonometry. Let's review some basic facts. Each land polygon is closed, and the sum of all the exterior angles adds up to <em>roughly</em> $$ 2\pi $$ radians. This is basic geometry:</p>
<p><img src="https://erikbern.com/assets/polygon.gif" alt="polygon"></p>
<p>Why not exactly $$ 2\pi $$? We're on a sphere, i.e. a <em>non-Euclidean</em> geometry. In those places, classic theorems are no longer true. Luckily, the curvature of the Earth is not substantial at a smaller scale, so we don't have to worry about it.</p>
<p>I'm using <a href="https://github.com/GeospatialPython/pyshp">pyshp</a> to read the data. First step is to convert lon/lat to unit vectors in 3D, which I find far easier to work with:</p>
<div class="highlight"><pre style="color:#f8f8f2;background-color:#272822;-moz-tab-size:4;-o-tab-size:4;tab-size:4"><code class="language-python" data-lang="python"><span style="color:#66d9ef">def</span> <span style="color:#a6e22e">ll_to_3d</span>(lat, lon):
lat <span style="color:#f92672">*</span><span style="color:#f92672">=</span> math<span style="color:#f92672">.</span>pi <span style="color:#f92672">/</span> <span style="color:#ae81ff">180</span>
lon <span style="color:#f92672">*</span><span style="color:#f92672">=</span> math<span style="color:#f92672">.</span>pi <span style="color:#f92672">/</span> <span style="color:#ae81ff">180</span>
x <span style="color:#f92672">=</span> math<span style="color:#f92672">.</span>cos(lat) <span style="color:#f92672">*</span> math<span style="color:#f92672">.</span>cos(lon)
z <span style="color:#f92672">=</span> math<span style="color:#f92672">.</span>cos(lat) <span style="color:#f92672">*</span> math<span style="color:#f92672">.</span>sin(lon)
y <span style="color:#f92672">=</span> math<span style="color:#f92672">.</span>sin(lat)
<span style="color:#66d9ef">return</span> numpy<span style="color:#f92672">.</span>array([x, y, z])
</code></pre></div><p>I did something similar when I computed a <a href="/2015/04/26/ping-the-world.html">world map of ping latencies</a>.</p>
<p>The only other magic sauce is that we need to compute the exterior angle or how much we “turn” when we go from vector $$ \mathbf{a} $$ to vector $$ \mathbf{b} $$ and then turn towards vector $$ \mathbf{c} $$. When $$ \mathbf{a, b, c} $$ are close to each other on the surface, you can ignore the curvature of the earth and think of them as just sitting on a plane. We want to know the exterior angle between $$ \mathbf{b-a} $$ and $$ \mathbf{c-b} $$. Turns out we can exploit the property of the cross product.</p>
<p>$$ \left| \mathbf{u} \times \mathbf{v} \right| = \left| \mathbf{u} \right| \left| \mathbf{v} \right| \mathbf{n} \sin \theta $$</p>
<p>where $$ \theta $$ is the angle. The vector $$ \mathbf{n} $$ is a unit vector pointing <em>out of</em> the earth if the turn is clockwise, and <em>into</em> the earth if it's counter clockwise. We can figure that out by taking the dot product with $$ \mathbf{b} $$ (which is a unit vector and should be essentially parallel to the cross product). Not quite done yet. $$\sin^{-1}$$ only returns a value within $$ \left[ -\pi/2, \pi/2 \right] $$. We need to handle turns that are bigger than this as well. So we need a separate case for when the turn is so sharp that it's going “backwards”. See code:</p>
<div class="highlight"><pre style="color:#f8f8f2;background-color:#272822;-moz-tab-size:4;-o-tab-size:4;tab-size:4"><code class="language-python" data-lang="python"><span style="color:#66d9ef">def</span> <span style="color:#a6e22e">mag</span>(v):
<span style="color:#66d9ef">return</span> numpy<span style="color:#f92672">.</span>dot(v, v)<span style="color:#f92672">*</span><span style="color:#f92672">*</span><span style="color:#ae81ff">0.5</span>
<span style="color:#66d9ef">def</span> <span style="color:#a6e22e">spherical_angle</span>(a, b, c):
n_sin_theta <span style="color:#f92672">=</span> numpy<span style="color:#f92672">.</span>cross(b<span style="color:#f92672">-</span>a, c<span style="color:#f92672">-</span>b) <span style="color:#f92672">/</span> (mag(b<span style="color:#f92672">-</span>a) <span style="color:#f92672">*</span> mag(c<span style="color:#f92672">-</span>b))
alpha <span style="color:#f92672">=</span> math<span style="color:#f92672">.</span>asin(numpy<span style="color:#f92672">.</span>dot(n_sin_theta, b))
<span style="color:#66d9ef">if</span> numpy<span style="color:#f92672">.</span>dot(b<span style="color:#f92672">-</span>a, c<span style="color:#f92672">-</span>b) <span style="color:#f92672">></span><span style="color:#f92672">=</span> <span style="color:#ae81ff">0</span>:
<span style="color:#66d9ef">return</span> alpha
<span style="color:#66d9ef">else</span>:
<span style="color:#66d9ef">return</span> numpy<span style="color:#f92672">.</span>fmod(<span style="color:#ae81ff">2</span><span style="color:#f92672">*</span>math<span style="color:#f92672">.</span>pi <span style="color:#f92672">-</span> alpha, <span style="color:#ae81ff">2</span><span style="color:#f92672">*</span>math<span style="color:#f92672">.</span>pi) <span style="color:#f92672">-</span> math<span style="color:#f92672">.</span>pi
</code></pre></div><p>It was easy to verify that it works – for polygons with thousands of edges it still returns an exterior angle sum very close to $$ 2\pi $$.</p>
<p>There's a bit more work to take the series of cumulative angles and normalize it so that we can compute deviations. The <a href="https://github.com/erikbern/coastlines/blob/master/read.py">whole script</a> ended up being less than 100 lines so another example of a blog post being longer than the underlying script. (Eg. see the <a href="https://erikbern.com/2017/02/01/language-pitch.html">Language pitch</a> post).</p>
<h2 id="the-results">The results</h2>
<p>I applied a bit of discretion when reviewing the results. The top 2 most winded coastlines are some <a href="https://www.openstreetmap.org/search?query=51.8363%2C%200.9888#map=16/51.8363/0.9888">swamp in UK</a>. Google maps doesn't line up with the Openstreetmaps data and so I disqualified these entries and a few more.</p>
<p>The most twisted coastline is <a href="https://www.google.com/maps/place/37%C2%B041'38.4%22S+176%C2%B012'31.3%22E/@-37.6939957,176.2065113,17z/data=!3m1!4b1!4m5!3m4!1s0x0:0x0!8m2!3d-37.694!4d176.2087">just outside Tauranga, New Zealand</a>:</p>
<p><img src="https://erikbern.com/assets/tauranga-nz-thumbnail.png" alt="tauranga nz"></p>
<p>The second most is in South Australia, seemingly <a href="https://www.google.com/maps/place/34%C2%B038'26.5%22S+135%C2%B022'21.7%22E/@-34.6406955,135.3713353,466m/data=!3m1!1e3!4m5!3m4!1s0x0:0x0!8m2!3d-34.6407!4d135.3727">in the middle of nowhere</a>.</p>
<p>The third most is <a href="https://www.google.com/maps/place/42%C2%B001'28.6%22N+70%C2%B011'03.8%22W/@42.024604,-70.1865887,17z/data=!3m1!4b1!4m5!3m4!1s0x0:0x0!8m2!3d42.0246!4d-70.1844">on Cape Cod, MA</a>, which is amazing because I sort of expected Cape Cod to rank pretty high. Although Openstreetmap and Google have pretty different coastlines so honestly the exact location seems a bit unclear:</p>
<p><img src="https://erikbern.com/assets/cape-cod-thumbnail.png" alt="cape-cod"></p>
<p>#4 is some <a href="https://www.google.com/maps/place/45%C2%B056'57.5%22N+60%C2%B034'36.1%22W/@45.947025,-60.5942939,4998m/data=!3m1!1e3!4m5!3m4!1s0x0:0x0!8m2!3d45.9493!4d-60.5767">random place in Nova Scotia, Canada</a></p>
<h2 id="top-20">Top 20</h2>
<p>I removed a whole bunch of these entries due to ambiguous coastlines – basically whenever Openstreetmaps didn't align with Google:</p>
<table>
<thead>
<tr>
<th>GM</th>
<th>OSM</th>
<th>Lat/Long</th>
<th>Where</th>
</tr>
</thead>
<tbody>
<tr>
<td><a href="https://www.google.com/maps/search/'-37.6940,176.2087'/@-37.6940,176.2087,14z">GM</a></td>
<td><a href="https://www.openstreetmap.org/search?query=-37.6940,176.2087">OSM</a></td>
<td>-37.6940, 176.2087</td>
<td>Tauranga, New Zealand</td>
</tr>
<tr>
<td><a href="https://www.google.com/maps/search/'-34.6407,135.3727'/@-34.6407,135.3727,14z">GM</a></td>
<td><a href="https://www.openstreetmap.org/search?query=-34.6407,135.3727">OSM</a></td>
<td>-34.6407, 135.3727</td>
<td>Australia</td>
</tr>
<tr>
<td><a href="https://www.google.com/maps/search/'42.0246,-70.1844'/@42.0246,-70.1844,14z">GM</a></td>
<td><a href="https://www.openstreetmap.org/search?query=42.0246,-70.1844">OSM</a></td>
<td>42.0246, -70.1844</td>
<td>Cape Cod, USA</td>
</tr>
<tr>
<td><a href="https://www.google.com/maps/search/'45.9493,-60.5767'/@45.9493,-60.5767,14z">GM</a></td>
<td><a href="https://www.openstreetmap.org/search?query=45.9493,-60.5767">OSM</a></td>
<td>45.9493, -60.5767</td>
<td>Nova Scotia, Canada</td>
</tr>
<tr>
<td><a href="https://www.google.com/maps/search/'1.9901,-157.4740'/@1.9901,-157.4740,14z">GM</a></td>
<td><a href="https://www.openstreetmap.org/search?query=1.9901,-157.4740">OSM</a></td>
<td>1.9901, -157.4740</td>
<td>Kiribati</td>
</tr>
<tr>
<td><a href="https://www.google.com/maps/search/'32.9330,129.7944'/@32.9330,129.7944,14z">GM</a></td>
<td><a href="https://www.openstreetmap.org/search?query=32.9330,129.7944">OSM</a></td>
<td>32.9330, 129.7944</td>
<td>Nagasaki, Japan</td>
</tr>
<tr>
<td><a href="https://www.google.com/maps/search/'43.5846,145.3271'/@43.5846,145.3271,14z">GM</a></td>
<td><a href="https://www.openstreetmap.org/search?query=43.5846,145.3271">OSM</a></td>
<td>43.5846, 145.3271</td>
<td>Hokkaido, Japan</td>
</tr>
<tr>
<td><a href="https://www.google.com/maps/search/'54.2867,13.6907'/@54.2867,13.6907,14z">GM</a></td>
<td><a href="https://www.openstreetmap.org/search?query=54.2867,13.6907">OSM</a></td>
<td>54.2867, 13.6907</td>
<td>Rügen, Germany</td>
</tr>
<tr>
<td><a href="https://www.google.com/maps/search/'34.5192,10.5364'/@34.5192,10.5364,14z">GM</a></td>
<td><a href="https://www.openstreetmap.org/search?query=34.5192,10.5364">OSM</a></td>
<td>34.5192, 10.5364</td>
<td>Tunisia</td>
</tr>
<tr>
<td><a href="https://www.google.com/maps/search/'26.4628,-82.0632'/@26.4628,-82.0632,14z">GM</a></td>
<td><a href="https://www.openstreetmap.org/search?query=26.4628,-82.0632">OSM</a></td>
<td>26.4628, -82.0632</td>
<td>Cape Coral, USA</td>
</tr>
<tr>
<td><a href="https://www.google.com/maps/search/'34.6861,137.2857'/@34.6861,137.2857,14z">GM</a></td>
<td><a href="https://www.openstreetmap.org/search?query=34.6861,137.2857">OSM</a></td>
<td>34.6861, 137.2857</td>
<td>Tokyo, Japan</td>
</tr>
<tr>
<td><a href="https://www.google.com/maps/search/'47.2325,-53.9598'/@47.2325,-53.9598,14z">GM</a></td>
<td><a href="https://www.openstreetmap.org/search?query=47.2325,-53.9598">OSM</a></td>
<td>47.2325, -53.9598</td>
<td>Newfoundland, Canada</td>
</tr>
<tr>
<td><a href="https://www.google.com/maps/search/'55.1082,10.0945'/@55.1082,10.0945,14z">GM</a></td>
<td><a href="https://www.openstreetmap.org/search?query=55.1082,10.0945">OSM</a></td>
<td>55.1082, 10.0945</td>
<td>Funen, Denmark</td>
</tr>
<tr>
<td><a href="https://www.google.com/maps/search/'35.2210,-75.6807'/@35.2210,-75.6807,14z">GM</a></td>
<td><a href="https://www.openstreetmap.org/search?query=35.2210,-75.6807">OSM</a></td>
<td>35.2210, -75.6807</td>
<td>North Carolina, USA</td>
</tr>
<tr>
<td><a href="https://www.google.com/maps/search/'46.8320,-64.0313'/@46.8320,-64.0313,14z">GM</a></td>
<td><a href="https://www.openstreetmap.org/search?query=46.8320,-64.0313">OSM</a></td>
<td>46.8320, -64.0313</td>
<td>Prince Edward Island, Canada</td>
</tr>
<tr>
<td><a href="https://www.google.com/maps/search/'64.9621,-51.5111'/@64.9621,-51.5111,14z">GM</a></td>
<td><a href="https://www.openstreetmap.org/search?query=64.9621,-51.5111">OSM</a></td>
<td>64.9621, -51.5111</td>
<td>Nuuk, Greenland</td>
</tr>
<tr>
<td><a href="https://www.google.com/maps/search/'55.2200,-7.7219'/@55.2200,-7.7219,14z">GM</a></td>
<td><a href="https://www.openstreetmap.org/search?query=55.2200,-7.7219">OSM</a></td>
<td>55.2200, -7.7219</td>
<td>County Donegal, Ireland</td>
</tr>
<tr>
<td><a href="https://www.google.com/maps/search/'66.0704,-23.1252'/@66.0704,-23.1252,14z">GM</a></td>
<td><a href="https://www.openstreetmap.org/search?query=66.0704,-23.1252">OSM</a></td>
<td>66.0704, -23.1252</td>
<td>Ísafjörður, Iceland</td>
</tr>
<tr>
<td><a href="https://www.google.com/maps/search/'-43.8452,-176.4251'/@-43.8452,-176.4251,14z">GM</a></td>
<td><a href="https://www.openstreetmap.org/search?query=-43.8452,-176.4251">OSM</a></td>
<td>-43.8452, -176.4251</td>
<td>Chatham Islands, New Zealand</td>
</tr>
<tr>
<td><a href="https://www.google.com/maps/search/'52.2898,-174.3173'/@52.2898,-174.3173,14z">GM</a></td>
<td><a href="https://www.openstreetmap.org/search?query=52.2898,-174.3173">OSM</a></td>
<td>52.2898, -174.3173</td>
<td>Atka, Alaska, USA</td>
</tr>
</tbody>
</table>
<h2 id="notes">Notes</h2>
<ul>
<li>Obviously the polygon resolution matters – coastlines are fractal and the higher resolution, the more twists you get.</li>
<li>I was surprised that the twistedness was so small, even for the most extreme points. The top one was about $$ 4\pi $$, i.e. two full turns.</li>
<li>I actually suspect the largest twistedness is still bounded. Even if we could measure with infinite precision, it might be an infinite series with a sum that converges.</li>
<li><a href="https://github.com/erikbern/coastlines">All code is on Github</a>, as usual.</li>
</ul>
Optimizing for iteration speed2017-07-06T00:00:00Zhttps://erikbern.com/2017/07/06/optimizing-for-iteration-speed.html<p><img src="https://erikbern.com/assets/burger_buns.jpg" alt="burgers"></p>
<p>I've written before about <a href="/2016/03/02/iterate-or-die.html">the importance of iterating quickly</a> but I didn't necessarily talk about some concrete things you can do. When I've built up the tech team at <a href="https://better.com">Better</a>, I've intentionally optimized for fast iteration speed above almost everything else. What are some ways we did that?</p>
<h2 id="continuous-deployment">Continuous deployment</h2>
<p>My dubious claim is that we might be the only financial institution in the world to deploy continuously. I actually ended up getting <a href="https://www.economist.com/news/special-report/21721505-relationship-between-banks-and-technology-companies-becoming-increasingly">quoted in the Economist</a> about this specifically. We deploy to production probably 50-100 times every day. Once a pull requests is merged into master, we run a fairly extensive test suite of a few thousand unit tests and a few hundred <a href="http://www.seleniumhq.org/">Selenium</a> tests. We have spent a lot of time optimizing the time it takes to run these tests so it's really just about 15 minutes. If all tests pass, we deploy to production.</p>
<p>We use <a href="https://buildkite.com">Buildkite</a> for CI and run all our services on top of <a href="https://kubernetes.io/">Kubernetes</a>, which (among a million other things) supports blue/green deployments so that there is no downtime during deployments.</p>
<h2 id="testing">Testing</h2>
<p>Continuous deployment is freedom under responsibility and it isn't possible without rigorous testing. We have about 85% unit test coverage (I think the sweet spot is about 90%. 100% is unrealistic). Manual testing is only done by the product manager, generally when a feature has already been live in production for a while, to make sure that it's according to the spec.</p>
<p>Do we ever release bugs to production? Of course. But mean time to recovery is usually more important than mean time between failures. If we deploy something that's broken, we can often roll back within minutes. And since we ship very incremental changes, the average bug is often limited in impact. Bugs in production are often related to code that was written in the last few days, so it's fresh in mind and can be fixed quickly.</p>
<h2 id="no-sprints">No “sprints”</h2>
<p>Two-week or three-week sprints are mini waterfall and sacrifices a lot of flexibility for the purpose of providing external stakeholders a bit more predictability. But if you work on a customer facing product, users have no expectation that you're going to update the product at any point in time. (Even with external stakeholders, I think predictability is overrated. It's just a way to avoid sales people overselling.)</p>
<p>A continuous flow of tasks means we can launch a v1, v2, and v3, all on the same day, where v2 included features that we learned from users in v1 and v3 were based on user feedback on v2.</p>
<h2 id="small-tasks">Small tasks</h2>
<p>Excuse me for geeking out, but an interesting result from <a href="https://en.wikipedia.org/wiki/Random_matrix">random matrix theory</a> is that in high dimensional spaces, local minima are rare (the reason is that most points where the derivative is zero are really <a href="https://en.wikipedia.org/wiki/Saddle_point">saddle points</a>). I think software engineering mostly takes place in a very high dimensional world where hill climbing by splitting up tasks into <em>small, incremental pieces</em> and shipping each of them separately is the fastest way to deliver value.</p>
<p>In contrast, one of the most scary thing in software engineering is “inventory” of code that builds up without going into production. It represents deployment risk, but also risk of building something users don't want. Not to mention lost user value from not shipping parts of the feature earlier (user value should be thought of as feature value <em>integrated over time</em>, not as the feature value at the end state).</p>
<p>Feature flagging is a last option, and we use it sparingly. Even worse, is having feature branches. They are devil's work and should be abolished. <a href="http://nvie.com/posts/a-successful-git-branching-model/">Git-flow</a> is a terrible invention and when we tried it at Spotify, people spent something like 50% of their time just rebasing code.</p>
<p>Long-lived pull requests are frowned upon for this reason. A pull request should be merged within a few hours, ideally, and should be at most a few hundred lines. We have built <a href="https://github.com/imsky/hubot-pull-review">our own system</a> to assign reviewers to pull requests and notifying the Slack channel. The results are clear from the stats below – this represents the time from the point where a PR is created to the point where it's merged, taken from our monorepo:</p>
<p><img src="https://erikbern.com/assets/prs_minutes.png" alt="prs">
<img src="https://erikbern.com/assets/prs_days.png" alt="prs"></p>
<h2 id="cross-functional-people-and-teams">Cross-functional people and teams</h2>
<p>Some companies have separate backend and frontend teams. Or, even worse, I once talked to a company that had a “machine learning theory team” in a different city than the “machine learning production team”. Don't do this. It slows down iteration speed and adds coordination overhead.</p>
<p>If you want to optimize for a tight feedback loop, <em>cross-functional teams</em> make a lot more sense than <em>teams split up by skills</em>.</p>
<p>This applies to individual engineers as well. Every engineer at Better is a full-stack engineer that can take any feature in the backlog and ship it. Most of the time, the complexity is really in the backend, and so the vast majority of our team skews towards backend developers. But no one has any issue writing CSS and pushing pixels when needed. A typical task is 80-90% backend and 10-20% frontend. By having a single engineer working on a feature, we can ship a lot quicker. Most engineers in the team are not the Simone Biles of CSS, but they can do it and get the job done, and it's usually not a big part of the work of shipping a task.</p>
<p>At a fast moving consumer facing startup, you can't afford specialization. Not just do full stack engineers iterate faster, but there's also more flexibility built in. You don't know where in the stack the team is going to spend the next week.</p>
<p>Before I paint a dogmatic picture, I want to point out that we <em>have</em> hired a few specialized roles. We do have a test automation engineer, an operations person, and a few dedicated frontend engineers. We needed a bit more “expertise” for a few particular areas. It did take a while to get there, and even these engineers still spend some time across the whole stack.</p>
<h2 id="what-else">What else?</h2>
<p>There's a long tail of smaller things that definitely make a huge difference:</p>
<ul>
<li>How can we keep the scope small and design the product process around the learning process? Much ink has been spilled on the topic of MVP, a “Minimum Viable Product”.</li>
<li>Data is obviously super important How do we actually <em>learn</em> from the incremental features we ship? I'm talking both hard metrics here, and soft qualitative stuff.</li>
<li>What about the trade-off between product quality and shipping time?</li>
</ul>
<p>I could write about this all day long. Instead, wanted to wrap up with some notes on why cycle time matters so much.</p>
<h2 id="iterate-or-die">Iterate or die</h2>
<p>First, let me point out that optimizing for <em>fast iteration speed</em> is not the same thing as <em>throughput</em>. In <a href="https://en.wikipedia.org/wiki/Little%27s_law">Little's law</a>, throughput is $$ \lambda $$, and iteration speed is the inverse of $$ W $$. The relationship between $$ \lambda $$ and $$ W $$ is complex and sadly I haven't found any good resources on it. On a Google journey you can find some decent <a href="http://www.fabtime.com/ctcapac.shtml">resources from chip manufacturing</a> among other things: <img src="https://erikbern.com/assets/cycle_time.gif" alt="cycle time"></p>
<p>Looking at the chart it's clear that you can lower throughput just a slight bit below the theoretical capacity and get orders of magnitude lower cycle time (i.e. higher iteration speed). But chip manufacturing is large scale manufacturing processes where there's not even any learning process to talk about. Once you want to learn fast on top of having high throughput, it's a no brainer to operate slightly below theoretical throughput capacity.</p>
<p>Sorry for getting a bit theoretical so let's rephrase it. Imagine you're a fast food chain that needs to make one thousand hamburgers an hour. You need to start baking the bread at some point, grill the patties, cut the lettuce etc. Everything can be done in huge batches and planned in advance. Certain software project may resemble this. For instance rewriting a big application from C++ to Java.</p>
<p>But far more often, a software project is like trying to find a completely new hamburger recipe. In that case, keeping the batches small, and learning from feedback continuously is key. You can make 500 or even 800 burgers an hour and make the batch size and the cycle time 10x smaller. Forcing you to keep the <em>inventory</em> low is a whole obsession of <a href="https://en.wikipedia.org/wiki/Lean_manufacturing">lean manufacturing</a>, and it's mostly because you can respond to customer demand much faster (the other reason was that inventory was a substantial cost in Japan in the 1950s. But I digress).</p>
<p>Anyway. In terms of organization – you can keep inventory much lower if people are responsible to make whole burgers rather than one person chopping the lettuce, one person making the buns, etc. And by keeping the feedback loop tight, you keep changing the combination of spices and learn from the feedback you get. Your <em>recipe</em> can evolve 10x or 100x faster. This is ultimately how you outcompete everyone else.</p>
<p>🍔</p>
Blogroll2017-06-09T00:00:00Zhttps://erikbern.com/2017/06/09/blogroll.html<p>Remember when everyone had a really ugly blog with a <em>blogroll</em>? Anyway, just think the word is funny.</p>
<p>I follow a few hundred blogs using <a href="https://feedly.com">Feedly</a> and <a href="http://reederapp.com/">Reeder</a> and have been reading a few hundred thousand blog posts over the last 10 years. Here's some stuff I think everyone should follow. Not going to share a million blogs, just a few top ones. That way you don't have to think about it, just subscribe to all of it:</p>
<h2 id="software-engineering">Software engineering</h2>
<p>Lots of company blogs are good:</p>
<ul>
<li><a href="https://medium.com/airbnb-engineering">Airbnb</a></li>
<li><a href="http://research.baidu.com/">Baidu Research</a></li>
<li><a href="https://tech.instacart.com/">Instacart</a></li>
<li><a href="https://research.fb.com/">Facebook research</a></li>
<li><a href="https://engineering.pinterest.com/">Pinterest</a></li>
<li><a href="http://multithreaded.stitchfix.com/">Stitch Fix</a></li>
<li><a href="https://codeascraft.com/">Etsy</a></li>
<li><a href="https://blog.twitter.com/engineering/en_us.html">Twitter</a></li>
<li><a href="https://blogs.dropbox.com/tech/">Dropbox</a></li>
<li><a href="http://blog.kaggle.com/">Kaggle</a></li>
</ul>
<p>Some personal blogs worth mentioning:</p>
<ul>
<li><a href="https://jvns.ca/">Julia Evans</a> – networking and operating system stuff</li>
<li><a href="https://danluu.com/">Dan Luu</a> – company culture mostly</li>
<li><a href="https://peadarcoyle.wordpress.com/">Peadar Coyle</a> – interviews data scientists</li>
<li><a href="https://blog.acolyer.org/">Adrian Colyer</a> – reviews a technical paper <em>every day</em></li>
<li><a href="http://www.elidedbranches.com/">Camille Fournier</a> – technical management</li>
<li><a href="https://www.chrisstucchio.com/">Chris Stucchio</a> – statistics and business</li>
<li><a href="http://www.inference.vc/">Ferenc Huszár</a> – theoretical machine learning</li>
<li><a href="http://larahogan.me/blog">Lara Callendar Hogan</a> – technical management</li>
<li><a href="https://martinfowler.com/">Martin Fowler</a> – architecture</li>
</ul>
<h2 id="math">Math</h2>
<ul>
<li><a href="https://www.johndcook.com/blog/">John Cook</a></li>
<li><a href="http://andrewgelman.com/">Andrew Gelman</a> – Bayesian statistics</li>
</ul>
<h2 id="startups--business">Startups / business</h2>
<ul>
<li><a href="http://firstround.com/review/">First Round Review</a></li>
<li><a href="https://stratechery.com/">Ben Thompson</a> – business strategy</li>
<li><a href="https://25iq.com/">Tren Griffin</a> – moats, supply chains, etc</li>
<li><a href="http://blog.elizabethyin.com/">Elizabeth Yin</a></li>
<li><a href="http://tomtunguz.com/">Tomasz Tunguz</a> – B2B straregy</li>
<li><a href="https://mattermark.com/blog/">Mattermark</a></li>
<li><a href="http://avc.com/">Fred Wilson</a></li>
<li><a href="http://blog.interviewing.io/">interviewing.io</a> – great data on tech recruiting</li>
</ul>
<h2 id="economics--politics">Economics / politics</h2>
<ul>
<li><a href="https://ashokarao.com/">Ashok Rao</a></li>
<li><a href="http://noahpinionblog.blogspot.com/">Noah Smith</a></li>
<li><a href="http://marginalrevolution.com/">Tyler Cowen</a> – biggest question: how does the guy read so much?</li>
<li><a href="http://aswathdamodaran.blogspot.com/">Aswath Damodaran</a></li>
</ul>
<h2 id="other-stuff">Other stuff</h2>
<ul>
<li><a href="http://slatestarcodex.com/">Star Slate Codex</a></li>
</ul>
<h2 id="thats-it">That's it!</h2>
<p>I probably forgot a ton of <em>fantastic</em> blogs here!</p>
<p>And remember – <em>on the internet, no one knows you're a dog</em></p>
<p><img src="https://erikbern.com/assets/dog_typing.gif" alt="dog"></p>
Conversion rates – you are (most likely) computing them wrong2017-05-23T00:00:00Zhttps://erikbern.com/2017/05/23/conversion-rates-you-are-most-likely-computing-them-wrong.html<p>How hard can it be to compute conversion rate? Take the total number of users that converted and divide them with the total number of users. <em>Done.</em> Except… it's a lot more complicated when you have any sort of significant time lag.</p>
<h2 id="prelude-ndash-a-story">Prelude – a story</h2>
<p>Fresh out of school I joined Spotify as the first data analyst. One of my first projects was to understand conversion rates. Conversion rate from the free service to Premium is tricky because there's a huge time lag. At that time, labels were highly skeptical that we would be able to convert many users, and this was a contentious source of disagreement. We had converted a really small fraction of our users, and we kept growing our free users like crazy. The conversion rates was standing still, if not going down.</p>
<p>The “insight” I had was when I started breaking it up into cohorts. For instance, look at all users that joined on May 1 and track their conversion rate over time. The beautiful thing that happened was that <em>the conversion rate keeps growing and growing over time</em>. People converted at an almost uniform rate over the first few years. It was amazing to see. Some of the old cohorts that had used the service for 2+ years had some crazy high conversion rates, like 40-50%. This insight it implied that conversion rates wasn't a big problem, and it was only becuase <em>we were growing exponentially</em> that the <em>current conversion rate</em> looked “artificially” low.</p>
<p><img src="https://erikbern.com/assets/spotify_conversion_rate.png" alt="spotify conversion rate"></p>
<p>My lesson here is that conversion rates are sometimes pointless to try to quantify as a single number. Sometimes it's a useful metric, but in many cases it's not. Spotify's conversion rate is not that useful to know in itself, since the user base is not in equilibrium. As long as the user base keeps growing, and as long as there's a substantial lag until conversion, you really can't say anything by trying to quantify it into a single number.</p>
<h2 id="an-example-ndash-exit-rate-for-startups-2008-2015">An example – exit rate for startups 2008-2015</h2>
<p>Let's go through an example of all the bad ways to look at conversion and then arrive at what I think of as the “best way” (in my <del>humble</del> correct opinion). Just for fun, I scraped a bunch of startup data from a well-known database of startups. Not going to get into all the gory details of the scraping, except that scraping is fun and if you do it too much your scraper gets banned… I probably could have used some lame boring data set, but data analysis is 38.1% more fun if you can relate to the data.</p>
<p>I have about 1,836 companies in the data set that were invested at some point, and 243 (13%) that exited at some point (either IPO or acquisition). So let's for instance ask ourselves, how is the conversion rate going? Are newer companies exiting at a higher rate than older companies? Or is it getting harder over time to exit? The naïve way is to break it up by year founded and compute the conversion rates:</p>
<p><img src="https://erikbern.com/assets/conversion_by_year.png" alt="conversion by year"></p>
<p>Except for 2008, it looks like the conversion rate is <em>going down</em>. Why? Is it harder and harder for companies to exit? Let's look at the <em>time to exit as well</em>.</p>
<p><img src="https://erikbern.com/assets/time_to_conversion_by_year.png" alt="time to conversion by year"></p>
<p>Here we see the opposite trend of what we saw in the previous chart – it seems like it's getting easier and easier for companies to exit!</p>
<p>So what's going on? If you think about it for a bit it's pretty clear – we are mixing data from 2008 (where the companies have had 9 years to convert) with data from 2016 (where companies have had a year or less). We don't know what companies from the 2016 group that will convert <em>in the future</em>.</p>
<p>Both of these charts underlines that there's often no such thing as a single “conversion rate” and no such thing as a “time to conversion”. In the case where conversion has some clear upper time limit, you might get away talking about those metrics. For instance, it's probably fine to measure landing page conversion rate by looking at how many people clicked a link within an hour. But in many cases, including the case of startup exits, as well as Spotify free to Premium, “conversion rate” and “time to conversion” is nonsensical and cannot be defined.</p>
<h2 id="the-right-way-to-look-at-conversion-rates-ndash-cohort-plots">The right way to look at conversion rates – cohort plots</h2>
<p>To compare conversion rates, it makes a lot more sense to compare the <em>at time T</em>, where T is some time lag such as 7 days or 30 days or 1 year or whatever. For instance in order to compare the conversion rates for the companies in the 2012 and 2014 cohort, compare what percentage of them has converted within 24 months.</p>
<p>We extend this to <em>all</em> times <em>T</em>, and plot it as a function of T. Does it take longer to exit for startups that started in 2014 compared to 2008? Let's take a look:</p>
<p><img src="https://erikbern.com/assets/cohort_plot_all_years.png" alt="cohort plot"></p>
<p>I'm not sure what's the “official name” of a plot like this, but generally people refer to it as a <em>cohort plot</em>. For every cohort, we look at the conversion rate <em>at time T</em>. Note that since we don't know anything about the future, we can't say much about the 2016 cohort beyond ~5 months – it includes some companies started in Dec 2016 so we simply don't have full data after 5 months. This is all great and checks a lot of boxes:</p>
<ul>
<li>We can compare conversion rates for different cohorts and understand if it's getting better or worse ✅</li>
<li>We can see if certain cohorts convert faster ✅</li>
</ul>
<p>I generally think of this approach as “as good as it gets” in most situations. Except my only issue with it is that the idea of measuring “conversion at time T” means we can't use too much recent data. For instance, it would be much better if we could look at 2017 data and see how well it's converting? I like metrics to have fast feedback loops so surely we can do better? Turns out we can.</p>
<h2 id="the--way-to-look-at-conversion-rates-ndash-kaplan-meier">The 😎 way to look at conversion rates – Kaplan-Meier</h2>
<p><a href="https://en.wikipedia.org/wiki/Kaplan%E2%80%93Meier_estimator">Kaplan-Meier</a> is a <em>non-parametric</em> estimator originally used to estimate the survival function. Turns out the survival function is 1 minus the conversion rate, so it's the exact same thing essentially. Non-parameteric is good if you have no idea what the underlying distribution you are modeling is.</p>
<p>The best part of the Kaplan-Meier is that it lets us include data for which we simply haven't observed anything past a certain point. This is best illustrated if we broaden each cohort a bit so that they contain a larger span. Let's say we're trying to understand the conversion rate of the 2008-2011 cohort vs the conversion rate of the 2012-2015 cohort. The hypothesis would be that we want to understand how the exit rate has changed over time:</p>
<p><img src="https://erikbern.com/assets/cohort_plot_grouped.png" alt="cohort plot"></p>
<p>This is a super simple plot to draw except for the confidence interval. Just literally divide the number of exited companies by the total number of companies to get a rate.</p>
<p>The problem here is that we can't say anything about the second cohort beyond ~1.5 years because <em>that would require saying something about future data</em>. This cohort contains companies up to and including Dec 31, 2015, which have had slightly less than 18 months of history to convert. On the other hand, the oldest companies in this cohort are from Jan 2012, so they have had a lot of time to convert. Surely we should be able to plot something more for this cohort. The Kaplan-Meier estimator lets us work with this issue by being smart with how it treats “future” data for different observations (“censored” observations, as it's called in survival analysis lingo):</p>
<p><img src="https://erikbern.com/assets/kaplan_meier_grouped.png" alt="kaplan meier grouped"></p>
<p>The implementation is absolutely trivial, although I used the <a href="https://github.com/CamDavidsonPilon/lifelines">lifelines</a> packages in Python to get this and we also get a snazzy confidence interval for free (this is a bit harder to do). So the conclusion here is that yes – it seems like newer companies don't convert at the same rate as older.</p>
<p>If you want to implement Kaplan-Meier yourself, the idea is basically to compute a conversion “survival rate”. If we start out with 100 items and one of them convert at time 1, the survival rate is 99%. We keep computing those rates and multiply them together. When data is “censored”, we just remove from the denominator:</p>
<div class="highlight"><pre style="color:#f8f8f2;background-color:#272822;-moz-tab-size:4;-o-tab-size:4;tab-size:4"><code class="language-python" data-lang="python">n, k <span style="color:#f92672">=</span> len(te), <span style="color:#ae81ff">0</span>
ts, ys <span style="color:#f92672">=</span> [], []
p <span style="color:#f92672">=</span> <span style="color:#ae81ff">1.0</span>
<span style="color:#66d9ef">for</span> t, e <span style="color:#f92672">in</span> te:
<span style="color:#66d9ef">if</span> e:
<span style="color:#75715e"># whether the event was "observed" (converted)</span>
<span style="color:#75715e"># not observed means they may still convert in the future</span>
p <span style="color:#f92672">*</span><span style="color:#f92672">=</span> (n<span style="color:#f92672">-</span><span style="color:#ae81ff">1</span>) <span style="color:#f92672">/</span> n
n <span style="color:#f92672">-</span><span style="color:#f92672">=</span> <span style="color:#ae81ff">1</span>
ts<span style="color:#f92672">.</span>append(t)
ys<span style="color:#f92672">.</span>append(<span style="color:#ae81ff">100.</span> <span style="color:#f92672">*</span> (<span style="color:#ae81ff">1</span><span style="color:#f92672">-</span>p))
pyplot<span style="color:#f92672">.</span>plot(ts, ys, <span style="color:#e6db74"></span><span style="color:#e6db74">'</span><span style="color:#e6db74">b</span><span style="color:#e6db74">'</span>)
</code></pre></div><p>Kaplan-Meier lets us get a bit more out of each cohort. Look at what happens if we plot one cohort for each year:</p>
<p><img src="https://erikbern.com/assets/cohort_vs_kaplan_meier.gif" alt="kaplan meier all years"></p>
<h2 id="epilogue">Epilogue</h2>
<p>In <a href="/2016/12/05/the-half-life-of-code.html">a previous post</a>, I built a tool to analyze the survival of code. Given that it's obviously survival analysis, I went back and <a href="https://github.com/erikbern/git-of-theseus/pull/32">updated the tool</a> tool to plot survival rates (of code) using Kaplan-Meier since it was such a tiny diff. Here's the survival curve of individual lines of code of <a href="https://github.com/git/git">Git</a> itself:</p>
<p><img src="https://erikbern.com/assets/kaplan_meier_git.png" alt="git survival"></p>
<p>Cool to see that a few lines of code are still present after 12 years!</p>
<h2 id="conclusion">Conclusion</h2>
<p>When people talk about conversion, and if there's time lag involved, remember: <em>it's complicated!</em></p>
<p>EDIT(2019-09-26): check out a kind-of v2 to this blog post: how to use <a href="https://better.engineering/2019/07/29/modeling-conversion-rates-and-saving-millions-of-dollars-using-kaplan-meier-and-gamma-distributions/">Weibull and gamma distributions to model conversion rates</a>.</p>
<h2 id="notes">Notes</h2>
<ul>
<li>A <a href="https://ragulpr.github.io/2016/12/22/WTTE-RNN-Hackless-churn-modeling/">fantastic blog post</a> talks about churn prediction from a machine learning perspective. Much more math focused than this posts. From the post: <em>The hacky way that i bet 99.9% of all churn-models use is to do a binary workaround using fixed windows</em> (referring to “conversion at time T” as the target variable).</li>
<li>In the plots that are not using Kaplan-Meier, we can compute the confidence intervals using <code>scipy.stats.beta.ppf([0.05, 0.95], k+1, n-k+1)</code>). Generally good to visualize the uncertainty.</li>
<li>I mentioned that non-parametric methods are generally good. To be clear, they can be bad because they don't let you impose priors and other things that can sometimes let you regularize the model.</li>
<li>On that topic, I actually found an interesting <a href="https://pymc-devs.github.io/pymc3/notebooks/survival_analysis.html">Bayesian survival analysis using PyMC3</a> that looks cool. Haven't had the energy/time to fully comprehend it.</li>
<li>I also wanted to point out there are situations where Kaplan-Meier doesn't work. As soon as we're dealing with anything more complicated than a conversion rate (from state X to state Y) then it breaks down.</li>
<li>For instance, let's analyze the <a href="http://www.freddiemac.com/news/finance/sf_loanlevel_dataset.html">Freddie loan level dataset</a> to understand the state of mortgages. At some point in time, a borrower can prepay or default. And for a lot of the more recent observations we don't have enough history to determine the final outcome. Since we have <em>two</em> different end states (defaulting or prepayment) we have to resort to something else. The simplest way is to just compute the normalized share over all the observations that are still active at time T: <img src="https://erikbern.com/assets/freddie.png" alt="freddie"></li>
<li>As usual, the code is <a href="https://github.com/erikbern/conversion">on Github</a></li>
</ul>
The mathematical principles of management2017-04-09T00:00:00Zhttps://erikbern.com/2017/04/09/the-mathematical-principles-of-management.html<p>I've read about 100 management books by now but if there's something that always bothered me it's the lack of first principles thinking. Basically it's a ton of heuristics. And heuristics are great, but when you present heuristics as true objectives, it kind of clouds the underlying objectives (and you end up with weird proxy cults like the Agile movement 👹 – not that I disagree with it, I just wish they could derive it from a more systematic understanding of project management).</p>
<p>The other thing you need is a model of reality. I have an almost dogmatic belief that there is a mathematical model describing everything. Doesn't mean that <em>your</em> model is correct of course. And I'm not super interested in the actual <em>math</em> here – more the dynamics. But there's a set of models, each more and more complex, that describe reality more and more accurately. And I don't mean it in a naïve, everything-is-math kind of way. I totally believe that humans are irrational, and all that stuff. But there's some stuff that can be predicted, and the uncertainty can usually be predicted too, as well as human irrationality/psychology, market behavior, and many other things.</p>
<p>Anyway, my book would be structured roughly in order of these models, adding more and more detail to how reality functions and how to make optimal business decisions. I think of it as layers of an onion – every layer is an extension of the previous model where we add more and more complexity.</p>
<p><img src="https://erikbern.com/assets/management.jpg" alt="cover"></p>
<p><em>I even designed a cover! This is going to sell like god knows what.</em></p>
<p>I'm planning to publish it about 2040, once I've mastered all the pieces. No, but seriously, I would love to read a book like this. I'm still fairly new to the game so here are just some very rough sketch of what I want the topics to be like. If a book could write about management in this way, I'd pre-order 100 copies in a heartbeat.</p>
<ol>
<li>Decision making with perfect information
<ul>
<li>This is the most basic case of decision making and easiest to model</li>
<li>An example here: what's the breakeven time if we upgrade our widget making machine for $100,000 so that it can make 1,000 more widgets per day?</li>
<li>Some of the key concepts in this chapter are:
<ul>
<li>ROI (return on investment) and how to prioritize across different projects</li>
<li>Diminishing return as a function of investment (concavity)</li>
<li>Marginal ROI vs average</li>
<li>Price sensitivity</li>
<li>How to allocate time across several different projects, thinking about it as a constrained optimization problem (Lagrange multipliers and the principle of optimizing striving for equal marginal ROI)</li>
<li>Opportunity cost (example: why almost all ideas are bad once you factor in the opportunity cost)</li>
<li>Pipeline/constraint thinking (all the <a href="https://en.wikipedia.org/wiki/Lean_manufacturing">Toyota stuff</a> & <a href="https://praxis.fortelabs.co/theory-of-constraints-101-table-of-contents-8bbb6627915b">Theory of Constraints</a> goes here, as well as the “Lean” and “Agile” movements).</li>
</ul>
</li>
</ul>
</li>
<li>Decision making given uncertainty
<ul>
<li>This is our first extension of the most basic model and it's already getting a bit trickier</li>
<li>Topics:
<ul>
<li>Prior beliefs and Bayes’ rule (example: why common sense and experience is a great prior)</li>
<li>Explore vs exploit (side topic: Thompson sampling)</li>
<li>Rapid iteration vs long term planning (case study: hardware vs software development)</li>
<li>Proxy metrics (optimizing for shareholder value is hard, so let's pick some metric that's easier to measure/move but still has a high correlation)</li>
<li>A/B testing</li>
<li>“Known unknowns vs unknown unknowns”</li>
</ul>
</li>
</ul>
</li>
<li>People management – agency problems
<ul>
<li>This is the first part of managing people – how do you deal with the fact that their needs are not always aligned with the company? I have a feeling a look through history could be quite useful</li>
<li>Topics (by no means exhaustive!):
<ul>
<li>Marxism and the theory that history is a struggle between employers and employees</li>
<li>Taylorism and the first wave of <a href="https://en.wikipedia.org/wiki/Scientific_management">“Scientific Management”</a>.</li>
<li>Why do startups have free lunches and ping pong tables and hedge funds don't? (This is a theory I have – has to do with the fact that performance is a lot harder to measure at startups.)</li>
<li>Why do mediocre managers prefer long term projects?</li>
<li>Why a culture of instilling risk aversity hurts company performance? (Punishing managers disproportionally for making mistakes means risks are not taken, even when the expected value is positive.)</li>
<li>How performance bonus incentivizes risk taking? (This is sort of the opposite of the above point)</li>
<li>Why it's so hard for companies to change? (Because managers have a vested interest in status quo (and are only looking for Pareto improvements))</li>
</ul>
</li>
</ul>
</li>
<li>People management – information asymmetry
<ul>
<li>The second part of managing people analyzes another reason why people make poor decisions – it's because they didn't have full information. This happens more at big companies</li>
<li>There's probably some really interesting stories from military tactics here. Leading troops under battle pushes decision making to its extremes and forces incredible dentralization of power. I suspect this is one of the better analogies for how to think about information asymmetry from <em>the bottom to the top</em> – i.e. you need to trust the grass roots to run autonomously.</li>
<li>A much more boring (but still important) topic is how to run an efficient meeting culture. Meetings (and emails etc) are the way humans tranfer information between each other and it has terrible bandwidth. Think about it as a 1,000 person company where each person is a modem that can do like 30 baud. How do you organize to propagate information the fastest from top to bottom (and then back up?)</li>
<li>Topics: TBA (because this is an area where my skills lack. I told you this book would be published in 2040!)</li>
</ul>
</li>
<li>People management – bounded rationality
<ul>
<li>Here we're starting to get into behavioral economics. This is fun. This as the remaining piece that explains why managers make suboptimal decisions – they are not acting like rational economical agents.</li>
<li>It's also psychology, of course. How to <del>trick</del> inspire people into doing things. Why people disagree. How to get people to change. And all that stuff.</li>
<li>Topics: TBA. I also haven't structured my thoughts on this – will get back to you in 10-20 years with some more ideas. But basically it's all the Kahneman/Tversky/Thaler stuff – Wikipedia's <a href="https://en.wikipedia.org/wiki/List_of_cognitive_biases">List of cognitive biases</a> but more fun.</li>
</ul>
</li>
<li>Operating in a market
<ul>
<li>The competitive advantage angle is basically Michael Porter stuff but I find his books excruciatingly boring and so let's talk about it in other terms. I think there are really good stories to illustrate how this works (side note but this book is pretty good: <a href="https://www.amazon.com/gp/product/0385479506/ref=oh_aui_detailpage_o05_s00?ie=UTF8&psc=1">Co-opetition</a>).</li>
<li>I also think an understated market is the <em>market of people</em> aka recruiting. So some of the more nuanced points of hiring top performance would end up here.</li>
<li>Topics:
<ul>
<li>Moats: network effects (Metcalfe's law), scale advantages, proprietary technology, regulatory capture, etc.</li>
<li>Collusion and defection</li>
<li>Other competitive advantages: brand</li>
<li>Suppliers and wholesale transfer pricing</li>
<li>Induced demand</li>
<li>First mover advantage</li>
<li>Case studies: TBA (but I want LOTS of them here! fun war stories! YAY!)</li>
</ul>
</li>
</ul>
</li>
</ol>
<p>Please pre-order my book! It will be delivered straight into your brain around the year 2040 by Amazon's brain implant chip.</p>
<p><img src="https://erikbern.com/assets/book.gif" alt="book"></p>
<p>PENCIL NOT INCLUDED!</p>
The eigenvector of "Why we moved from language X to language Y"2017-03-15T00:00:00Zhttps://erikbern.com/2017/03/15/the-eigenvector-of-why-we-moved-from-language-x-to-language-y.html<p>I was reading yet another blog post titled “Why our team moved from <language X> to <language Y>” (I forgot which one) and I started wondering if you can generalize it a bit. Is it possible to generate a N * N contingency table of moving from language X to language Y?</p>
<blockquote class="twitter-tweet"><p lang="en" dir="ltr">Someone should make a N*N contingency table of all engineering blog posts titled "Why we moved from <language X> to <language Y>".</p>— Erik Bernhardsson (@bernhardsson) <a href="https://twitter.com/bernhardsson/status/824278026603073537?ref_src=twsrc%5Etfw">January 25, 2017</a></blockquote>
<script async src="https://platform.twitter.com/widgets.js" charset="utf-8"></script>
<p>So I wrote a script for it. You can query Google from a script and get the number of search results using a tiny snippet. I tried a few different query strings, like <em>move from <language 1> to <language 2></em>, <em>switch to <language 2> from <language 1></em> and a few more ones. In the end you get a nice N * N contingency table of all languages:</p>
<p><img src="https://erikbern.com/assets/prog_lang_matrix.png" alt="contingency table"></p>
<p>Here's where the cool part begins. We can actually treat this as probabilities from switching between languages and say something about what the <em>future</em> language popularities will be. One the key is that the <em>stationary distribution</em> of this process does not depend on the initial distribution – turns out this is basically just the first eigenvector of the matrix. So you really don't have to make any assumptions about what's popular right now – the hypothetical future stationary state is <em>independent</em> of this.</p>
<p>We need to make this into a <a href="https://en.wikipedia.org/wiki/Stochastic_matrix">stochastic matrix</a> that describes the probabilities of going from state $$ i $$ to state $$ j $$. This is easy – we can interpret the contingency matrix as transition probabilities by just normalizing across each row – this should give a rough approximation of the probability of switching from language $$ i $$ to language $$ j $$.</p>
<p>Finding the first eigenvector is trivial, we just multiply a vector many times with the matrix and it will converge towards the first eigenvector. By the way, see notes below for a bunch of more discussion on how I did this.</p>
<h2 id="go-is-the-future-of-programming-">Go is the future of programming (?)</h2>
<p>Without further ado, here is the top few languages of the stationary distribution:</p>
<ul>
<li>16.41%: Go</li>
<li>14.26%: C</li>
<li>13.21%: Java</li>
<li>11.51%: C++</li>
<li>9.45%: Python</li>
</ul>
<p>I took the stochastic matrix sorted by the <em>future popularity</em> of the language (as predicted by the first eigenvector).</p>
<p><img src="https://erikbern.com/assets/prog_lang_matrix_eig.png" alt="contingency table sorted by eigenvector"></p>
<p>Surprisingly, (to me, at least) <em>Go</em> is the big winner here. There's a ton of search results for people moving from X to Go. I'm not even sure how I feel about it (I have mixed feelings about Go) but I guess my infallible analysis points to the inevitable conclusion that Go is something worth watching.</p>
<p>The C language, which turned 45 years old this year, is doing really well here. I did a bunch of manual searches and in many cases a lot of the results are really people writing about how they optimize certain tight loops by moving code from X to C etc. But is that incorrect? I don't think so. C is the lingua franca of how computer works and if people are still actively moving pieces of code to C then it's here to stay. I seriously think C will be going strong by its 100th birthday in 2072. With my endorsements for C on LinkedIn, I expect recruiters to reach out to me about C opportunities well into the 2050's (actually taking that back – hopefully C will outlive LinkedIn).</p>
<p>Other than that, the analysis pretty much predicts what I would expect. Java is here to stay, Perl is dead, Rust is doing pretty well.</p>
<p>Btw, this analysis reminds me of this old tweet</p>
<blockquote class="twitter-tweet"><p lang="en" dir="ltr">Very interesting graphing showing rate of switch between R and Python for data analysis <a href="http://t.co/moYFgrHCBJ">pic.twitter.com/moYFgrHCBJ</a></p>— Big Data Borat (@BigDataBorat) <a href="https://twitter.com/BigDataBorat/status/459137528990167040?ref_src=twsrc%5Etfw">April 24, 2014</a></blockquote>
<script async src="https://platform.twitter.com/widgets.js" charset="utf-8"></script>
<h2 id="javascript-frameworks">Javascript frameworks</h2>
<p>I did the same analysis for frontend frameworks:</p>
<p><img src="https://erikbern.com/assets/js_framework_matrix_eig.png" alt="contingency table sorted by eigenvector"></p>
<p>I expected React to come out on top here, but interestingly Vue is doing really well. I'm also surprised how well Angular stacks up – anecdotally it seems like a mass exodus away from it.</p>
<h2 id="databases">Databases</h2>
<p><img src="https://erikbern.com/assets/database_matrix_eig.png" alt="contingency table sorted by eigenvector"></p>
<p>I started looking at ride sharing apps, deep learning frameworks, and other things, but the data is far more sparse and less reliable. Will keep you posted!</p>
<h2 id="notescaveats">Notes/caveats</h2>
<ul>
<li>See <a href="https://news.ycombinator.com/item?id=13882601">discussion on Hacker News</a> and <a href="https://www.reddit.com/r/programming/comments/5zonf2/the_eigenvector_of_why_we_moved_from_language_x/">/r/programming</a></li>
<li>This blog post was another inspiration: <a href="https://dev.to/tra/why-i-switch-from-language1-to-language2">Why I switched from language 1 to language 2</a>.</li>
<li><a href="https://gist.github.com/erikbern/7e10efd98e93af94445e250c6d8d2bd0">Here's how to scrape Google and get the number of search results</a></li>
<li>Unfortunately Google rate limits queries by IP, but I ended up using <a href="https://proxymesh.com">Proxymesh</a> to scrape it for all the N * N combinations 🤓</li>
<li>Note that I searched for <em>exact</em> queries by putting it in quotation marks: eg <em>“switch from go to c++”</em></li>
<li>The attentive reader might ask why Javascript wasn't included in the analysis. The reason is (a) if you are doing it on the frontend, you are kind of stuck with it anyway, so there's no <em>moving</em> involved (except if you do crazy stuff like transpiling, but that's really not super common) (b) everyone refers to Javascript on the backend as “Node”</li>
<li>What about the diagonal elements? There is of course a really big probability that people just <em>stay</em> with a certain programming language. But I'm ignoring this because (a) turns out search results for things like <em>stay with Swift</em> is 99% related to Taylor Swift (b) the stationary distribution is actually independent of adding a constant diagonal (identity) matrix (c) it's my blog post and I can do whatever I want 🙉</li>
<li>On (b), it is true that $$ e(\alpha S + (1-\alpha)I) = e(S) $$ where $$ e(\ldots) $$ denotes the first eigenvalue and $$ I $$ is the identity matrix. This doesn't exactly map to reality – the probability that you stay with a certain language may be different across languages.</li>
<li>The method of repeated multiplications to get the first eigenvalue is called <a href="https://en.wikipedia.org/wiki/Power_iteration">Power iteration</a>.</li>
<li>Is this model with eigenvectors a super-accurate description of reality? Probably not. The old quote by George Box comes to mind: <em>All models are wrong, some are useful.</em></li>
<li>I also know the chain has to be ergodic and a bunch of other things, but in reality that's basically always the case.</li>
<li>Code is available <a href="https://github.com/erikbern/eigenstuff">on Github</a>.</li>
</ul>
Why I went into the mortgage industry2017-02-17T00:00:00Zhttps://erikbern.com/2017/02/17/why-i-went-into-the-mortgage-industry.html<p>I just realized last Thursday that I have spent two full years at <a href="https://better.com">Better</a>, incidentally on the same day as we announced a <a href="https://www.wsj.com/articles/lender-better-mortgage-gets-new-kleiner-perkins-funding-valuing-firm-at-220-million-1486643386">$15M round</a> led by Kleiner Perkins. So it was a good point to reflect a bit and think back – what the F led me to abandon my role managing the machine learning team at Spotify? To join some random startup in the world's most boring industry? So here's my justification why I love being where I am:</p>
<h2 id="follow-the-smart-people-with-the-good-ideas">Follow the smart people with the good ideas</h2>
<p>Back in 2008, I joined a then unknown company called <em>Spotify</em>. At the time I had an offer from Google and a couple of other places. Obviously all my friends and family thought I was really dumb. <em>Google is the coolest place in the world to work at! Ball pits!!</em> But what made me join Spotify was (a) I loved their beta product (b) all the smart people from school (<a href="https://kth.se">KTH</a>) that I looked up to had joined. So I thought, whatever, I'll try it. I want to work with these guys.</p>
<p>I ended up staying there for about six years during which this obscure company that started in Stockholm transformed the music industry. Anyway, the lesson I learned was: <em>go work for the smartest people you can find, and with a business idea you believe in</em>. Everything else is secondary. Even the business idea is probably secondary, since smart people often end up making the business work (Spotify is arguably an example of this).</p>
<h2 id="the-mortgage-industry-is-pretty-terrible">The mortgage industry is pretty terrible</h2>
<p>… and that's why I love it. It takes about 60 days to get a mortgage in the US. The average loan file is 800 pages. Basically mortgage lending is pdf manufacturing, and almost everything is manual.</p>
<p>Travel agents and stock brokers were obviated by the internet when people realized it's both more convenient and cheaper to disintermediate the human, and connect the users directly to the system. But mortgage lending is still done by a human loan officer pushing around your loan in a CRM and making roughly a percentage point of the loan amount in commission. This is a tax on the information asymmetry between borrowers and the “system” – an extremely complex industry with more regulatory bodies than anyone could keep track of.</p>
<p><img src="https://erikbern.com/assets/big-short.jpeg" alt="brokers"></p>
<p><em>Mortgage brokers from the movie The Big Short</em></p>
<p>I think it's funny when people talk about AI automating a bunch of human processes. I don't disagree, but huge parts of the mortgage industry can be automated by a bunch of web scraping scripts. This is a process that's supposed to be an <em>objective</em> decision based on factual data points about a user. Let humans do what humans are good at, use computers for everything else.</p>
<p>Why hasn't it been automated? It wasn't always hard to get a mortgage, and you might have heard that there was a <a href="https://en.wikipedia.org/wiki/Subprime_mortgage_crisis">minor problem with that</a>. After lots of added regulation (most of it pretty sane), it's very hard to get a mortgage. But the word “hard” is overloaded in English – can refer to both “high standards” and “tedious”. We focus only on very prime customers, and there's no reason why they should have to jump through a million hoops.</p>
<h2 id="sometimes-its-good-to-be-a-bit-contrarian">Sometimes it's good to be a bit contrarian</h2>
<p>One theory I have is that you should take advantage of “talent arbitrage”. Smart people over the last 20 years have all moved into startups and hedge funds, but indirectly that also means that all other industries will be disproportionally underserved by talent. There is a separate bigger altruistic/utilitarian argument to be made that smart people increasingly went into industries with small or no externalities – no bigger benefit to other people. I don't think high frequency trading or hyper-optimizing ad CTR is necessarily terrible in itself, but what's bad is it's the <em>opportunity cost</em> of sucking smart people away from jobs with larger externalities.</p>
<p>But the silver lining is I think this will change as the opportunities pop up for smart people to go into these “underdeveloped” fields like education, healthcare, and banking. Being the smartest team in a mediocre industry means you have a huge competitive advantage. Interestingly I see a lot of action in New York targeting these industries, but I don't know if it's a larger trend (yet).</p>
<h2 id="mortgages-are-nearly-untouched-by-technology">Mortgages are nearly untouched by technology</h2>
<p>Tech and tech startups have changed our lives in a lot of amazing ways. Industries like media, communication, and entertainment have gone through enormous changes as a result of distribution costs going to zero and formerly fragmented markets are now dominated by winner-takes-all effects. But looking around in the world, there are <em>huge</em> industries waiting for the same transformation. The industries I just mentioned, education, health care, and financial services, are enormous and have barely changed in the last 50 years.</p>
<p>We're finally starting to see some really interesting tranformations of financial services – active fund managers are being replaced by index funds, financial advisors are being replaced by robo-advisors, and hedge funds across the board are cutting their management fees. Maybe we're past peak financial intermediation? I think it's highly likely. It's an extremely fragmented market in the US and still extremely based on the physical branch network. Is the industry's “Amazon moment” just around the corner? Hopefully.</p>
<p><em>Case 1: One of Chase Mortgage's <a href="https://secure-dx.com">tech providers</a> are bragging about only 3 days of downtime per year</em></p>
<p><img src="https://erikbern.com/assets/secure-dx.png" alt="secure-dx"></p>
<p><em>Case 2: Some closing agent provider <a href="https://www.closingagent.esignmortgage.com//CATutorial/index.html#0">bragging</a> that they can IMPRESS CUSTOMERS by delivering PHYSICALLY SIGNED documents on a CD</em></p>
<p><img src="https://erikbern.com/assets/paperless.png" alt="paperless"></p>
<h2 id="we-have-a-head-start">We have a head start</h2>
<p>I really think there's a new way of thinking about building consumer products. It's a code that tech startups cracked in the last ten years. Launch early, launch often, iterate, and learn from your consumers. <em>Big banks are absolutely terrible at this</em>. A typical release schedule is six months, with <em>binders</em> describing the steps. During that time, my team has deployed new incremental changes to production 5,000 times. No wonder why banks are completely incapable of building consumer products.</p>
<p>On the other side of the spectrum, mortgage lending is not something you can start doing in a garage. We basically ended up going out and taking over an existing lender, in order to get all the licenses and other thing we needed. Sadly, regulation massively favors incumbents, but I guess the flip side is regulatory capture can be good if you're on the right side of it.</p>
<h2 id="consumers-hate-the-current-system">Consumers hate the current system</h2>
<p>The weighted average NPS of the top banks is <em>negative eight</em>. Getting a mortgage is roughly as fun as getting a root canal. Because we've automated almost the entire process, we can manufacture a mortgages far faster, with a lot less hassle than other lenders. No more physical documents, and no more uploads. We try to fetch everything from API's and plug into a fully automated rules engine. The most beautiful part is that we actually <em>save</em> money by doing all these things, since we're cutting out huge chunks of manual labor, as well as the risk for issues.</p>
<p>The mortgage process is the biggest financial transaction that most people go through in their life times. The current system basically leverages the information asymmetry in order to justify the exorbitant commissions. Bait and switching is rampant, as well as under the table kickback for referrals (outlawed by <a href="https://en.wikipedia.org/wiki/Real_Estate_Settlement_Procedures_Act">RESPA</a>). We want to get rid of the sketchiness, but also reduce this information asymmetry through <a href="https://labs.better.com/refinance-calculator">tools</a> and product simplifications to make sure consumer make better-informed choices (robo-advisors are very much a source of inspiration here).</p>
<h2 id="were-actually-making-money">We're actually making money</h2>
<p>We aren't building a mobile game or a social network for dogs. We make several thousand dollars in revenue per mortgage, with great unit economics. So we've made substantial money from day 1.</p>
<h2 id="this-is-a-big-industry">This is a big industry</h2>
<p>There's about 7M mortgages every year in the US. The mortgage industry is several orders of magnitude larger than the previous industry I used to work in, the music industry.</p>
<p>American residential mortgage backed securities (roughly $16T total value) are a larger asset class than US equities. Yet the pricing mechanism is extremely crude – package a bunch of mortgages into a bundle, and price them by a couple of variables like zip, credit score, loan-to-value, and debt-to-income. What if we could take this $16T asset class and make it into a liquid market where prices are determined by models and updated in real time? What if we could auction off mortgages (or slices of mortgages) on a market as they are originated, like the adtech space works? The capital markets side has a lot of opportunities.</p>
<h2 id="were-just-getting-started">We're just getting started</h2>
<p>The cost of terrible mortgage lending isn't just the outrageous commissions. There's also a huge “tax” on mortgage financed real estate transactions because of the risks. Basically cash offers command a premium of somewhere between 5% and 15% of the amount <a href="https://www.researchgate.net/profile/Paul_Asabere/publication/259642061_The_Discounts_Associated_with_Cash_Deals_in_the_Foreclosed_Home_Submarket/links/5758530308aec913749f0283.pdf">(1)</a> <a href="https://www.researchgate.net/profile/Diane_Hite/publication/282963928_Sample_Selection_Approaches_to_Estimating_House_Price_Cash_Differentials/links/5643747a08ae54697fb2e915.pdf">(2)</a>. This is the cost consumers have to take on because the seller (and the seller's realtor) doesn't want to deal with the risk of a transaction falling through. This “tax” is roughly $50-100B per year that American consumers have to pay (on top of already outrageous realtor commissions). So going beyond just the speed and ease of the transaction, our next goal is to reduce the risk to essentially zero.</p>
<h2 id="whats-next">What's next?</h2>
<p>First of all, you should <a href="mailto:erik@nospam.better.com">let me know</a> if you're interested in joining! It's been a great trip over the last two years, and I can't wait to share some of the stuff we're working on.</p>
Language pitch2017-02-01T00:00:00Zhttps://erikbern.com/2017/02/01/language-pitch.html<p>Here's a fun analysis that I did of the <em>pitch</em> (aka. frequency) of various languages. Certain languages are simply pronounced with lower or higher pitch. Whether this is a feature of the language or more a cultural thing is a good question, but there are some substantial differences between languages.</p>
<p><a href="https://en.wikipedia.org/wiki/Hertz">Hertz</a> (or Hz, or $$ s^{-1} $$), is the standard way to measure audio frequency. Typical human speech ranges between 50 Hz and 300 Hz. Most men typically range between 85-180Hz, and most women between 165-255Hz. If we look at a spectrum of audio for English speakers, we get a pretty substantial difference between the genders. This is of course not super surprising to anyone with a pair of ears.</p>
<p><img src="https://erikbern.com/assets/lang_en_male_vs_female.png" alt="male vs female"></p>
<h3 id="comparing-languages">Comparing languages</h3>
<p>Let's look at the top three languages in the data set:</p>
<p><img src="https://erikbern.com/assets/lang_en_es_ru.png" alt="en es ru"></p>
<p>Estimating the peak frequency by language lets us compare all languages:</p>
<p><img src="https://erikbern.com/assets/lang_languages_comparison.png" alt="language comparison"></p>
<p>Cool! Basically Hungarian has a very low pitch and Chinese has a very high one. The difference isn't actually <em>super</em> big, it's about half an octave on a piano. Still, it's something that's very noticeable to a human. Just to give you an idea of how much half an octave is, I altered the pitch of Ronald Reagan's famous “tear down this wall” speech by $$ 2^{\pm 1 / 4} $$ so that the difference between the two variants is half an octave. (One octave is always the double frequency, so half an octave is $$ 2^{1 / 2} $$ frequency.</p>
<p><audio controls preload="none" style="width: 100%;"><source src="/assets/reagan_lo.wav" type="audio/wav"></audio>
<audio controls preload="none" style="width: 100%;"><source src="/assets/reagan_hi.wav" type="audio/wav"></audio></p>
<p>Just to clarify the graph you are seeing above: each circle represents the peak frequency from a <a href="https://en.wikipedia.org/wiki/Bootstrapping_(statistics)">bootstrapped</a> aggregate. The dark circles represent the median of those – arguably the most representative frequency. The purpose is to get an idea of the <em>uncertainty</em> in this esimates, and I stole this idea from <a href="https://fivethirtyeight.com/features/how-unconscious-sexism-could-help-explain-trumps-win/">538</a>. Note that the individual colored circles <em>do not</em> represent individual speakers – it's really just various bootstrap estimates of the peak frequency.</p>
<h3 id="within-languages">Within languages</h3>
<p>We can also look at the <em>origin</em> of the speaker and see how it differs. For English speakers, it turns out that the difference is quite small:</p>
<p><img src="https://erikbern.com/assets/lang_en_origins_comparison.png" alt="en comparison"></p>
<p>However <em>Spanish</em> speakers exhibit pretty substantial differences depending on the location, with Spain having a very low pitch (this seems right to me) and Peruvian women the highest (I have no idea whether this confirms any stereotype). Interestingly, the difference is tiny for males and huge for females.</p>
<p><img src="https://erikbern.com/assets/lang_sp_origins_comparison.png" alt="sp comparison"></p>
<p>There wasn't a ton of audio featuring the Francophones unfortunately:</p>
<p><img src="https://erikbern.com/assets/lang_fr_origins_comparison.png" alt="fr comparison"></p>
<p>There are some other global languages that would have been interesting to look at – Arabic comes to mind. Unfortunately the data I had was a bit limited, and there just wasn't enough data to compare those languages across countries.</p>
<h3 id="the-scandie-situation">The scandie situation</h3>
<p>As a “scandie”, I'm not surprised by some of these. Finnish is know for a very low pitch (making fun of F1 driver <a href="https://www.youtube.com/watch?v=QkxPZXgvlCQ">Mika Häkkinen's English accent</a> was a staple of Swedish comedy for a couple of years), and Norwegian is known for its high-pitched voice (going up and down, like the mountains). Danish is in the middle (but more notably, has basically degenerated into a series of <a href="https://www.youtube.com/watch?v=s-mOy8VUEBk">guttural sounds</a>). Scandinavian languages (I included Finnish in there even though it's not a Scandinavian language):</p>
<p><img src="https://erikbern.com/assets/lang_sv_dk_no_fi.png" alt="scandies"></p>
<h3 id="asian-pronunciation">Asian pronunciation</h3>
<p>Let's check out Chinese vs Japanese vs Korean:</p>
<p><img src="https://erikbern.com/assets/lang_zh_ja_ko.png" alt="cjk"></p>
<p>Chinese and Japanese stand out, both being very high-pitched languages.</p>
<p>There's a really weird thing going on here, that I can't explain. Chinese has a really different distribution for <em>males</em>. I suspect this has to do with the fact that it's a tonal language, but I'm not sure why it applies to males only. Let's plot all the Chinese variants to investigate this further.</p>
<p><img src="https://erikbern.com/assets/lang_zh_yue_wuu_nan.png" alt="language comparison"></p>
<p>(By the way, these are languages that ignorant people like me have barely heard of, yet even the smallest of them (Min) <a href="https://upload.wikimedia.org/wikipedia/commons/a/a9/Map_of_sinitic_languages_full-en.svg">has 60M speakers</a>.)</p>
<p>It's quite interesting to see how the Chinese variants seem to have far greater difference in their spectra than between English/Spanish/Russian (see above). I suspect it has something to do with how different variants of Chinese features different number of tones – Mandarin has 4, Wu has 7 etc. The stark difference between male and female speakers (not just different pitch, also a different <em>shape</em>) is still a mystery.</p>
<h3 id="one-weird-thing">One weird thing</h3>
<p>If you're really paying attention to the graphs, you'll notice some weird peaks in the lower end of the spectrum (around 50-60Hz). I didn't really think of it but Andreas Öman <a href="https://twitter.com/andoma/status/824718817628749824">pointed out</a> that these are actually a really interesting artifact. Can you think of it? 🤔</p>
<p>Ok – I'll give you one more hint. Look at this chart of female English speakers and the difference betweek UK and US. Pay attention to the weird spikes on the far left of the curve</p>
<p><img src="https://erikbern.com/assets/lang_us_vs_uk.png" alt="uk vs en"></p>
<p>These are actually AC frequencies ⚡ which occur at <a href="https://en.wikipedia.org/wiki/Mains_electricity_by_country#Table_of_mains_voltages_and_frequencies">50Hz in Europe vs 60Hz in the US</a>! Turns out you can detect it in the audio spectrum of sound clips pretty well.</p>
<h2 id="ok-but-whats-the-point">Ok, but what's the point?</h2>
<p><speculation></p>
<p>Here's a hypothesis: there might be a “natural” pitch of each language that is optimized for pronunciating words with the least amount of effort. Maybe the most convenient way to speak Chinese is to do it with a high pitch? Maybe Hungarian phonology really favors a low pitch? I don't know.</p>
<p>Another hypothesis: English is my second language, but it's the language I use <em>by far</em> the most (since I live in New York). There was a very definite point when I realized that I had to change my voice to get to the next level with my accent. Oddly enough it was actually while studying German (my third language). It felt awkward at first to alter my voice to the point where I didn't feel like it was <em>myself</em> talking. But on the other hand I could hear myself sounding so much more <em>German</em> (if you know what I mean). Having been through this transformation I decided to change my “English voice” as well.</p>
<p><img src="https://erikbern.com/assets/lang_en_de_sv.png" alt="en vs de vs sv"></p>
<p>This is quite speculative, and a linguist may disagree, but I suspect that one reason it's hard to acquire a native language accent is that it's hard to fully change the pitch of the voice. For instance, Mandarin speakers who picked up English as a second language seem to speak English with a slightly higher pitch. Finnish speakers seem to speak English with an unusually low pitch. Etc.</p>
<p>The pitch is of course not the only thing that constitutes a flawless accent – mastering all the nuances of a new languages takes years, if ever. But I suspect carrying over the pitch from another languages makes it harder to get all the finer points of the phonology.</p>
<p></speculation></p>
<h2 id="how-did-i-perform-this-analysis">How did I perform this analysis?</h2>
<p>I built a very tiny scraper to download audio clips from a web site that shall not be named (I probably violated their ToS severely). Letting it loose for a few hours got me ~100k audio clips in different languages/genders/origins. I restricted it to 10 clips per speaker in order to get more variety.</p>
<p>After that, I converted all the clips to .wav and started playing around with pitch detection. I hadn't expected to this to be such a sinkhole of effort but it turns out pitch detection is a <em>hard</em> problem.</p>
<p>As a preprocessing step, I found the 2.0s in the clip with the most intensity, and I added a Butterworth bandpass filter with a [50, 300] Hz frequency. A somewhat frustrating bug is that scipy.signal.butter <a href="https://github.com/scipy/scipy/issues/2980">is not numerically robust</a> so I basically just perform a low pass filter then followed by a high pass filter instead. From the little I remember from signal processing in school, this should be equivalent. The bandpass filter seems a bit arbitrary, but the way I rationalize it is that I guess it's form of Bayesian prior distribution of where you expect the fundamental frequency to pop up.</p>
<p>With the help of some <a href="https://gist.github.com/endolith/255291/fb8794f0bc5d4ae98890fcbaa0af58e75f781993">online resources</a>. I decided to go for a pure <a href="https://en.wikipedia.org/wiki/Fast_Fourier_transform">FFT</a> approach. Basically just look at the spectrum and find the peak frequency. The problem with FFT is that various harmonic frequencies pop up in the resulting spectrum, so if the clip has a frequency of 100 Hz then you will see peaks on 200 Hz, 300 Hz, etc. For this reason, an autocorrelation approach seemed marginally better on <em>individual clips</em>, but I realized quite quickly that individual clips are too noisy to be meaningful. Here's a sample of audio clips featuring 10 female English speakers and their FFT spectra:</p>
<p><img src="https://erikbern.com/assets/lang_ffts.png" alt="10 individual ffts"></p>
<p>Instead, I decided to aggregate the frequency spectra from all clips and perform stats on the aggregated data. Again from what I remember from school, FFT is a linear operation, $$ f(x+y) = f(x) + f(y) $$, so it seems fine to compute the FFT spectrum individually for each clip, then add them together and try to look for the peak frequency. This disregards the fact that FFT returns <em>complex numbers</em>, but I <em>think</em> you can ignore the phase shift in the spectrum (the angle of the complex outputs) and just add up the $$ \mbox{abs}(f(x)) $$ components. I could be wrong (I'm swimming in deep DSP water here).</p>
<p>This seemed to do the trick, and then on top of it I wasted a bunch of hours trying to learn <a href="http://pandas.pydata.org/">Pandas</a>. I also decided to use bootstrapping to compute some uncertainty estimate of the frequency estimation, so that instead of summing up all the spectra, I sum up a bootstrapped aggregate and look at the peak frequency. This helps me understand the uncertainty of the peak frequency estimate, which turns out to be pretty substantial. (There's probably a bunch of statisticians that would spin in their graves reading this blog posts.)</p>
<p>Anyway, <a href="https://github.com/erikbern/lang-pitch">the code is on Github</a> in case you are interested! The whole thing is ~250 lines so somewhat ironically this blog post actually ended up being far longer!</p>
Functional programming is the libertarianism of software engineering2017-01-10T00:00:00Zhttps://erikbern.com/2017/01/10/functional-programming-is-the-libertarianism-of-sw-eng.html<p>This is a pretty dumb post, in which I argue that functional programming has a lot of the bad parts of libertarianism and a lot of the good parts:</p>
<ul>
<li>Both ideologies strive to eliminate [the] state. <em>(ok, dumb dad joke)</em></li>
<li>Both ideologies are driven by a set of dogmatic axioms rather than a practical goal:</li>
<li>Libertarianism wants to reduce the government because any involvement distorts free markets. I always struggled to see what the underlying objective function is (it doesn't seem to be maximization of people's utility). 🤔</li>
<li>Functional programming wants to reduce side effects and make everything pure, often by enforcing onerous type systems. But why? Again I don't see an ultimate objective here. IMO it should start from the principle that the goal of a programming language should be to <em>make the programmers as productive as possible.</em> For instance, the little research that exists has shown that most bugs have little to <a href="https://vimeo.com/74354480">with typing</a> and I'd expect something similar to apply to mutable state. In fact the largest class seems to be <a href="https://blog.acolyer.org/2016/10/06/simple-testing-can-prevent-most-critical-failures/">poor error handling</a> <em>(ok, typing isn't necessarily related to FP, but in practice I find that strong typing and FP have highly overlapping fan clubs).</em></li>
<li>Both camps invoke obscure cases in history as a proof of success: libertarianists (more so anarchists I guess) often talks about Spain during the civil war, <a href="https://mises.org/library/stateless-somalia-and-loving-it">Somalia</a>, or sometimes Singapore. Haskell acolytes are very eager to bring up <a href="https://code.facebook.com/posts/745068642270222/fighting-spam-with-haskell/">Facebook's spam filtering</a>.</li>
<li>YET – and this is the surprising part imho – both ideologies are ~90% correct (source: my opinion). Which really surprises me given that they start from a (imo) arbitrary set of axioms.</li>
<li>Even if you are a die hard bolshevik, you benefit from an understanding of how interventions distort markets, how incentives matter, and how entrepreneurship is the driver of progress.</li>
<li>Even if you are coding in Visual Basic, you can level up your skills by learning FP: making functions pure when needed, avoid state, avoid reassign variables, avoid mutable data structures, write pipelines of data transformations, and all that jazz that FP has taught us to cherish.</li>
</ul>
<p><img src="https://erikbern.com/assets/mind_blown.gif" alt="mind blown"></p>
<p>End of stupid post.</p>
The half-life of code & the ship of Theseus2016-12-05T00:00:00Zhttps://erikbern.com/2016/12/05/the-half-life-of-code.html<p><img src="https://erikbern.com/assets/trireme.jpg" alt="trireme"></p>
<p>As a project evolves, does the new code just add on top of the old code? Or does it replace the old code slowly over time? In order to understand this, I built a <a href="https://github.com/erikbern/git-of-theseus">little thing</a> to analyze Git projects, with help from the formidable <a href="https://gitpython.readthedocs.io/en/stable/">GitPython</a> project. The idea is to go back in history historical and run a <code>git blame</code> (making this somewhat fast was a bit nontrivial, as it turns out, but I'll spare you the details, which involve some opportunistic caching of files, pick historical points spread out in time, use <code>git diff</code> to invalidate changed files, etc).</p>
<p>In moment of clarity, I named “Git of Theseus” as a terrible pun on <em>ship of Theseus.</em> I'm a dad now, so I can make terrible puns. It refers to a philosophical paradox, where the pieces of a ship are replaced for hundreds of years. If all pieces are replaced, is it still the same ship?</p>
<p><em>The ship wherein Theseus and the youth of Athens returned from Crete had thirty oars, and was preserved by the Athenians down even to the time of Demetrius Phalereus, for they took away the old planks as they decayed, putting in new and stronger timber in their places, in so much that this ship became a standing example among the philosophers, for the logical question of things that grow; one side holding that the ship remained the same, and the other contending that it was not the same.</em></p>
<p>It turns out that code doesn't exactly evolve the way I expected. There <em>is</em> a “ship of Theseus” effect, but there's also a compounding effect where codebases keep growing over time (maybe I should call it “Second Avenue Subway” effect, after the construction project in NYC that's been going on <a href="https://en.wikipedia.org/wiki/Second_Avenue_Subway#Initial_attempts">since 1919</a>).</p>
<p>Let's start by analyzing Git itself. Git became <a href="https://en.wikipedia.org/wiki/Self-hosting">self-hosting</a> early on, and it's one of the most popular and oldest Git projects:</p>
<p><img src="https://erikbern.com/assets/git-git.png" alt="git"></p>
<p>This plots the aggregate number of lines of code over time, broken down into cohorts by the year added. I would have expected more of a decay here, and I'm surprised to see that so much code written back in 2006 is still alive in the code base – interesting!</p>
<p>We can compute the decay for individual commits too. If we align all commits at x=0, we can look at the aggregate decay for code in a certain repo. This analysis is somewhat harder to implement than it sounds like because of various stuff (mostly because newer commits have had less time, so the right end of the curve represents an aggregate of fewer commits).</p>
<p>For Git, this plot looks like this:</p>
<p><img src="https://erikbern.com/assets/git-git-survival.png" alt="git git survival"></p>
<p>Even after 10 years, 40% of lines of code is still present! Let's look at a broader range of (somewhat randomly selected) open source projects:</p>
<p><img src="https://erikbern.com/assets/git-projects-survival.png" alt="git projects survival"></p>
<p>It looks like Git is somewhat of an outlier here. Fitting an exponential decay to Git and solving for the half-life gives approx ~6 years.</p>
<p><img src="https://erikbern.com/assets/git-git-survival-exp-fit.png" alt="git git survival exp fit"></p>
<p>Hmm… not convinced this is necessarily a perfect fit, but as the famous quote goes: <em>All models are wrong, some models are useful.</em> I like the explanatory power of an exponential decay – code has an expected life time and a constant risk of being replaced.</p>
<p>I suspect a slightly better model would be to fit a <em>sum of exponentials</em>. This would work for a repo with some code that changes fast and some code that changes slowly. But before going down a rabbit hole of curve fitting, I reminded myself of von Neumann's quote: <em>With four parameters I can fit an elephant, and with five I can make him wiggle his trunk.</em> There's probably some way to make it work, but I'll revisit some other time.</p>
<p>Let's look at a lot of projects in aggregate (also sampled somewhat arbitrarily):</p>
<p><img src="https://erikbern.com/assets/git-projects-survival-exp-fit.png" alt="git projects survival exp fit"></p>
<p>In aggregate, the half-life is roughly ~3.33 years. I like that, it's an easy number to remember. But the spread is <em>big</em> between different projects. The aggregate model doesn't necessarily have super strong predictive power – it's hard to point to a arbitrary open source project and expect half of it to be gone 3.33 years later.</p>
<h2 id="moar-repos">Moar repos</h2>
<p>Apache (aka <a href="https://github.com/apache/httpd">HTTPD</a>) is another repo that goes way back:</p>
<p><img src="https://erikbern.com/assets/git-httpd.png" alt="apache">
<img src="https://erikbern.com/assets/git-httpd-survival.png" alt="apache"></p>
<p><a href="https://github.com/rails/rails">Rails</a>:</p>
<p><img src="https://erikbern.com/assets/git-rails.png" alt="rails">
<img src="https://erikbern.com/assets/git-rails-survival.png" alt="rails"></p>
<p><em>Beautiful</em> exponential fit!</p>
<p><a href="https://github.com/nodejs/node">Node</a></p>
<p><img src="https://erikbern.com/assets/git-node.png" alt="node">
<img src="https://erikbern.com/assets/git-node-survival.png" alt="node"></p>
<p>Wanna run it for your own repo? Again, code is <a href="https://github.com/erikbern/git-of-theseus">available here</a>.</p>
<h2 id="the-monster-repo-of-them-all">The monster repo of them all</h2>
<p>Note that most of these repos took at most a few minutes to analyze, using my script. As a final test I decided to run it over the <a href="https://github.com/torvalds/linux">Linux kernel</a> which is <em>HUGE</em> – 635,229 commits as of today. This is 16 times larger than the second biggest repo I looked at (<a href="https://github.com/rails/rails">rails</a>) and took multiple days to analyze on my shitty computer. To make it faster I ended up computing the full <code>git blame</code> only for commits spread out at least 3 weeks and also limited it to <code>.c</code> files:</p>
<p><img src="https://erikbern.com/assets/git-linux.png" alt="linux"></p>
<p>The squiggly lines are probably from the sampling mechanism. But look at this beauty – a whopping 16M lines! The code contribution from each year's cohort is extremely smooth at this scale. Individual commits have absolutely no meaning at this scale – they cumulative sum of them is very predictible. It's like <a href="https://en.wikipedia.org/wiki/Kinetic_theory_of_gases">going from Newton's laws to thermodynamics</a>.</p>
<p><img src="https://erikbern.com/assets/git-linux-survival.png" alt="linux"></p>
<p>Linux also clearly exhibits more of a linear growth pattern. I'm speculating that this has to do with its high modularity. The <code>drivers</code> directory has by far the most number of files (22,091) followed by <code>arch</code> (17,967) which contains support for various architectures. This is exactly the kind of things you would expect to scale very well with complexity, since they have a well defined interface.</p>
<p>Somewhat off topic, but I like the notion of how well a projects scales with complexity. A linear scalability is the ultimate goal, where each one marginal feature takes roughly the same amount of code. Bad projects scale superlinearly, and every marginal feature takes more and more code.</p>
<p>It's interesting to go back and contrast Linux to something like Angular, which basically exhibits the opposite behavior:</p>
<p><img src="https://erikbern.com/assets/git-angular.png" alt="linux">
<img src="https://erikbern.com/assets/git-angular-survival.png" alt="linux"></p>
<p>The half-life of a randomly selected line in Angular is about 0.32 years. Does this reflect on Angular? Is the architecture basically not as “linear” and consistent? You might say the comparison is unfair, because Angular is new. That's a fair point. But I wouldn't be surprised if it does reflect on some questionable design. Don't mean to be shitting on Angular here, but it's an interesting contrast.</p>
<h2 id="half-life-by-repository">Half-life by repository</h2>
<p>A somewhat arbitrary sample of projects and their half-lifes:</p>
<table>
<thead>
<tr>
<th>project</th>
<th>half-life (years)</th>
<th>first commit</th>
</tr>
</thead>
<tbody>
<tr>
<td>angular</td>
<td>0.32</td>
<td>2014</td>
</tr>
<tr>
<td>bluebird</td>
<td>0.56</td>
<td>2013</td>
</tr>
<tr>
<td>kubernetes</td>
<td>0.59</td>
<td>2014</td>
</tr>
<tr>
<td>keras</td>
<td>0.69</td>
<td>2015</td>
</tr>
<tr>
<td>tensorflow</td>
<td>1.08</td>
<td>2015</td>
</tr>
<tr>
<td>express</td>
<td>1.23</td>
<td>2009</td>
</tr>
<tr>
<td>scikit-learn</td>
<td>1.29</td>
<td>2011</td>
</tr>
<tr>
<td>luigi</td>
<td>1.30</td>
<td>2012</td>
</tr>
<tr>
<td>backbone</td>
<td>1.48</td>
<td>2010</td>
</tr>
<tr>
<td>ansible</td>
<td>1.52</td>
<td>2012</td>
</tr>
<tr>
<td>react</td>
<td>1.66</td>
<td>2013</td>
</tr>
<tr>
<td>node</td>
<td>1.76</td>
<td>2009</td>
</tr>
<tr>
<td>underscore</td>
<td>1.97</td>
<td>2009</td>
</tr>
<tr>
<td>requests</td>
<td>2.10</td>
<td>2011</td>
</tr>
<tr>
<td>rails</td>
<td>2.43</td>
<td>2004</td>
</tr>
<tr>
<td>django</td>
<td>3.38</td>
<td>2005</td>
</tr>
<tr>
<td>theano</td>
<td>3.71</td>
<td>2008</td>
</tr>
<tr>
<td>numpy</td>
<td>4.15</td>
<td>2006</td>
</tr>
<tr>
<td>moment</td>
<td>4.54</td>
<td>2015</td>
</tr>
<tr>
<td>scipy</td>
<td>4.62</td>
<td>2007</td>
</tr>
<tr>
<td>tornado</td>
<td>4.80</td>
<td>2009</td>
</tr>
<tr>
<td>redis</td>
<td>5.20</td>
<td>2010</td>
</tr>
<tr>
<td>flask</td>
<td>5.22</td>
<td>2010</td>
</tr>
<tr>
<td>httpd</td>
<td>5.38</td>
<td>1999</td>
</tr>
<tr>
<td>git</td>
<td>6.04</td>
<td>2005</td>
</tr>
<tr>
<td>chef</td>
<td>6.18</td>
<td>2008</td>
</tr>
<tr>
<td>linux</td>
<td>6.60</td>
<td>2005</td>
</tr>
</tbody>
</table>
<p>It's interesting that <a href="https://github.com/moment/moment">moment</a> has such high half-life, but the reason is that so much of the code is locale-specific. This creates a more linear scalability with a stable core of code and linear additions over time. <a href="https://github.com/expressjs/express">express</a> is an outlier in the other direction. It's 7 years old but code changes extremely quickly. I'm guessing this is partly because (a) lack of linear scalability in code (b) it's probably one of the first major Javascript open source projects to hit mainstream/popularity, surfing on the Node.js wave. Possibly the code base also sucks, but I have no idea 😊</p>
<h2 id="has-coding-changed">Has coding changed?</h2>
<p>I can think of three reasons why there's such a strong relationship between the year the project was initiated, and the half-life</p>
<ol>
<li>Code churns more early on in projects, and becomes more stable a while in</li>
<li>Coding has changed from 2006 to 2016, and modern projects evolve faster</li>
<li>There's some kind of selection bias where the only projects that survive are the scalable stables ones</li>
</ol>
<p>Interestingly, I don't find any clear evidence of #1 in the data. The half-life for code written earlier in old projects are as high as late code. I'm skeptical about #3 as well because I don't see why there would be a relation between survival and code structure (but maybe there is). My conclusion is that <strong>writing code has fundamentally changed in the last 10 years.</strong> Code really seems to change at a much faster rate in modern projects.</p>
<p>By the way, see discussion <a href="https://news.ycombinator.com/item?id=13112449">on Hacker News</a> and <a href="https://www.reddit.com/r/programming/comments/5gqurc/the_halflife_of_code_the_ship_of_theseus/">on Reddit</a>!</p>
Are data sets the new server rooms?2016-11-01T00:00:00Zhttps://erikbern.com/2016/11/01/are-data-sets-the-new-server-rooms.html<p>This blog post <a href="https://medium.com/@josh_nussbaum/data-sets-are-the-new-server-rooms-40fdb5aed6b0">Data sets are the new server rooms</a> makes the point that a bunch of companies raise a ton of money to go get really proprietary awesome data as a competitive moat. Because once you have the data, you can build a better product, and no one can copy it (at least not very cheaply). Ideally you hit a virtuous cycle as well, where usage of your system once it takes of gives even more data, which makes the system even better, which attracts more users…</p>
<p>The behavior of machine learning models with increasing amounts of data is interesting. If you're building a machine learning based company, first of all you want to make sure that <em>more data gives you better algorithms.</em></p>
<p>But that's a necessary, not sufficient condition. You also need to find a sweet spot where</p>
<ul>
<li>It's not <em>too easy</em> to collect enough data, because then the value of your data is small</li>
<li>It's not <em>too hard</em> to collect enough data, because then you're going to spend way too much money to solve the problem (if ever)</li>
<li>The value of the data keeps growing the more data you get</li>
</ul>
<p>In the recommender system world (where I spent 5 years) it's not uncommon for algorithms to basically converge after say 100M or 1B data points. It depends on how many items you have, of course. Some class of models converge before they are even useful, in which case obviously there's no value in more data. Xavier Amatriain has an <a href="https://www.quora.com/In-machine-learning-is-more-data-always-better-than-better-algorithms">excellent Quora answer</a> that I urge you to check out if you want to learn more.</p>
<p>Anyway let's simplify the problem. Let's consider the behavior of some algos:</p>
<p><img src="https://erikbern.com/assets/ml-algo-data-size.png" alt="algo perf"></p>
<ul>
<li>The blue model represents problems where it's really easy to get good data pretty cheaply. For instance, a cat vs dog classifier is not a useful piece of tech because the value of getting that training data is roughly $0. I would worry about this for any company building a general purpose image classifier, for instance. Or if you're building a recommender system with 10k items it might be good enough with 10M ratings already. Having 100B ratings isn't necessarily more valuable.</li>
<li>The red model can happen in cases where your data comes from a different distribution or your loss function isn't close to what the product requires. In those cases more data is useless at some point. If you're building a movie recommender system by scraping web text it might just converge to a decent but not good enough model. (Here's another hypothesis: maybe collecting <em>passive</em> data from driving a car isn't enough to learn how to <em>actively</em> drive a car?)</li>
<li>The green model is when your problem may require such a ridiculous amount of data that it's not practical. For instance building a general purpose question and answer service that can solve <em>all the questions in the world</em> isn't that hard from a ML perspective if you have an infinite amount of data of questions and answers. But it's probably going to be useless with less than terabytes or petabytes of input data. If I tried to build a virtual assistant, this would be my biggest concern.</li>
</ul>
<p>Here are some sweet spots where I think you <em>can</em> build up a data set, but it's hard. Hard is good because it means once you did it, you have a moat:</p>
<ul>
<li>Detect fraud in transaction data</li>
<li>Predict which loans are going to default</li>
<li>Detect crimes from security footage</li>
</ul>
<p>Hard to remember? Here's a handy table I made</p>
<p><img src="https://erikbern.com/assets/data-size-sweet-spot.png" alt="sweet spot"></p>
<p>I think the general idea is pretty valid. But is it 100% correct? Probably not. Is it oversimplified? Oh yeah, to the extreme.</p>
Pareto efficency2016-10-25T00:00:00Zhttps://erikbern.com/2016/10/25/pareto-efficiency.html<p><a href="https://en.wikipedia.org/wiki/Pareto_efficiency">Pareto efficiency</a> is a useful concept I like to think about. It often comes up when you compare items on multiple dimensions. Say you want to buy a new TV. To simplify it let's assume you only care about two factors: price and quality. We don't know what you are willing to pay for quality – but we know that <em>everything else equals</em>:</p>
<ol>
<li>The cheaper the better.</li>
<li>The higher quality the better.</li>
</ol>
<p>This means we can rule out some TV's immediately. If TV number 1 is both cheaper and better quality than TV number 2, then there's no point buying number 2. Other TV's we can't compare because they excel at different things (price and quality). We obtain a <a href="https://en.wikipedia.org/wiki/Partially_ordered_set">partial ordering</a>. If you keep removing TV's that are dominated this way you end up with a set of TV's on the <em>Pareto frontier</em>. The really nice thing is we don't have to worry about what scales we're using. We also don't need to know how the consumer's tradeoff function looks like. All we need to care about is there is a way to rank quality and there's a way to rank price.</p>
<p>Wikipedia features the typical of definitional math that's extremely hard to get any intuition from:</p>
<p><em>The Pareto frontier, $$ P(Y) $$, may be more formally described as follows. Consider a system with function $$ f: \mathbb{R}^n \rightarrow \mathbb{R}^m $$, where $$ X $$ is a compact set of feasible decisions in the metric space $$ \mathbb{R}^n $$ and $$ Y $$ is the feasible set of criterion vectors in $$ \mathbb{R}^m $$, such that $$ Y = { y \in \mathbb{R}^m:; y = f(x), x \in X;} $$. We assume that the preferred directions of criteria values are known. A point $$ y^{\prime\prime} \in \mathbb{R}^m; $$ is preferred to (strictly dominates) another point $$ y^{\prime} \in \mathbb{R}^m; $$, written as $$ y^{\prime\prime} \succ y^{\prime} $$. The Pareto frontier is thus written as</em></p>
<p>$$ P(Y) = { y^\prime \in Y: ; {y^{\prime\prime} \in Y:; y^{\prime\prime} \succ y^\prime, y^{\prime\prime} \neq y^\prime ; } = \emptyset }. $$</p>
<p>This is pretty useless to me. I think it's much more important to develop a visual intuition for how it works. You can define it in high dimensional spaces but let's look at a two dimensional space first. So think of it as a list of TV's and the axes are “quality” and “price”. The only important thing is that one TV <em>dominates</em> another TV if it's better quality <em>and</em> better price. That's pretty intuitive to me. If you remove all the TV's that are dominated by another TV, you end up with the <em>Pareto frontier</em>. These are the TV's that are the only meaningful choices.</p>
<p>One note about the TV example: lower prices are of course better than higher prices. So you can think of the two factors as (-price, quality) just so that <em>right</em> and <em>up</em> is always better.</p>
<p>Sometimes Pareto frontiers are drawn like this:</p>
<p><img src="https://erikbern.com/assets/pareto-frontier-dumb.png" alt="pareto frontier"></p>
<p>The red dots are the TV's that are on the <em>Pareto frontier</em>. You don't want to buy a TV that's not on the Pareto frontier since there's always another one that's both higher quality and better price. The lines between the dots are just for illustrative purposes, they are not really a part of the frontier. I actually think this makes a lot more sense to draw it this way:</p>
<p><img src="https://erikbern.com/assets/pareto-frontier.png" alt="pareto frontier"></p>
<p>In this case let's say Samsung has a TV that's on the Pareto frontier (one of the red dots) and they are launching a new generation. They can move it up and right (all consumers would prefer that!). This improvement would be <em>Pareto efficient</em> or a <em>Pareto improvement</em>. They can move it down and left (this would be worse for all customers!). Or they can move it up+left or down+right and depending on the consumer they may or may not like it.</p>
<p>Benchmarks are a good use case for computing the Pareto frontier. Often it's hard to break it down to a single number. I maintain <a href="https://github.com/erikbern/ann-benchmarks">benchmarks</a> for approximate nearest neighbor libraries, where there's a tradeoff between accuracy and speed. It's useful to plot all points on a 2D graph:</p>
<p><img src="https://erikbern.com/assets/ann-benchmarks-glove.png" alt="pic"></p>
<p>Another thing I used it for relatively recently was to present the best mortgages to a consumer. Basically there's only two attributes: <em>interest rate</em> and <em>points/credits</em>. We actually compute the Pareto frontier for our <a href="https://better.com/#/quick-rate">rate table</a>. In this case smaller numbers are better along both dimensions. This is really just the same thing, just flipping the comparisons.</p>
<p><img src="https://erikbern.com/assets/quick-rate.png" alt="quick rate"></p>
<p>I don't really know a whole lot about Pareto efficiency, but here are some notes on the technical aspect of it:</p>
<ul>
<li>If you're comparing items along two dimensions, you can do it in $$ \mathcal{O}(n\log n) $$. How? You sort the items along the x axis, traverse through. Any time the y value of the current point is larger than the y value of the previous point, you remove the previous point (it kind of resembles <a href="https://en.wikipedia.org/wiki/Graham_scan">Graham scan</a> for convex hull, which I guess isn't so surprising – finding the Pareto frontier is basically Convex hull in som weird degenerate geometry). <img src="https://erikbern.com/assets/pareto-scan.gif" alt="pareto scan"></li>
<li>If it's more than two dimensions, you can do it in $$ \mathcal{O}(n^2) $$. Just compare each pair of items and remove any strongly dominated one. I doubt there's a faster algorithm but maybe? I'm sure there's some obscure Ph. D. dissertation improving the bound to $$ \mathcal{O} (n^{2 - 2/d} \log n \log \log n \log^{*} n) $$ with an algorithm that is useless for practical purposes unless $$ n > 10^{24} $$.</li>
<li>The Wikipedia article about <a href="https://en.wikipedia.org/wiki/Multi-objective_optimization">Multi-objective optimization</a> talks a lot about Pareto efficiency. Something worth reading up on later.</li>
<li>The probability that a point is on the frontier goes towards 1 as the number of dimensions grows. I don't know the exact relation but simulated this numerically (this assumes each dimension is independent): <img src="https://erikbern.com/assets/pareto-dims.png" alt="pareto dims"></li>
</ul>
<p>Here are some various mental models I have that involve Pareto efficiency:</p>
<ul>
<li>I often think of Pareto efficiency in terms of decision making. The closer you get to the Pareto frontier (of the space of <em>possible</em> solutions), the harder it is to make any decision Pareto efficient. Meaning for almost all decisions, you're going to have to sacrifice <em>something</em>. For instance when you do a big refactoring of a system it's easy to get hung up on trying to preserve all features while adding a few new ones. In reality this is going to be extremely hard or impossible. If you can do it possibly it's because you forgot to include some <em>other axis</em> in your analysis, like code complexity. It's like pushing a balloon into a box.</li>
<li>I think <a href="https://en.wikipedia.org/wiki/Loss_aversion">loss aversion</a> may sometimes be explained by people trying to make Pareto efficient decisions.</li>
<li>You could model why big companies are so slow to change course. Say <em>Conglomerated Fruits, Inc</em> is close or on the Pareto frontier in terms of how they allocate resources to fruit production. Now, turns out consumers are suddenly demanding Goji berries a lot more than bananas. Rationally the company should fire the Chief Banana Officer, shut down the banana division and reinvest all their money in goji berries. But because the Chief Banana Officer sits on the management team, this becomes and extremely hard thing to do. My conclusion from this silly example is that you should really think twice before assigning the responsibility of a functional area to a single person.</li>
<li>Here's another example: <em>Amalgamated Travel Agency, Inc.</em> runs a very profitable business selling flight tickets over phone. Some internet startups start selling flight tickets online. Of course, they think, <em>a flight ticket is a huge transaction, and people want to talk to another human</em>. Turns out buying flight tickets online is better along almost every other dimension except one. <em>Amalgamated Travel Agency, Inc.</em> dies because they don't realize customers don't need a Pareto efficient product improvement.</li>
<li>A simple model for <em>why buying decisions are so hard</em> is that it involves Pareto effiency – market economy will drive out all TV's that are dominated, leaving only the TV's on the Pareto frontier. That makes it a lot harder as a consumer because now every choice will become a trade-off.</li>
<li>I loved this blog post from 538 about <a href="http://fivethirtyeight.com/features/marco-rubio-and-the-pareto-frontier/">Marco Rubio and the Pareto Frontier</a>.</li>
<li>When a deal is Pareto efficient and improves the outcome for everyone, it's called a <a href="https://en.wikipedia.org/wiki/Coase_theorem">Coasean bargain</a>.</li>
<li>I think it's helpful to think of competitive advantage in terms of Pareto efficiency. In a commodity industry like oil drilling, the number of dimensions to compete on is very small (eg. 1). So you will end up with a few very big companies. Whereas in something like clothing there's a lot of dimensions, so you should expect a more fragmented market.</li>
<li>For some moderate amount of dimensions, such as $$ d = 20 $$, if you have about $$ 7 \cdot 10^9 $$ items, then <em>most</em> of them will be Pareto efficient (assuming independence between factors). So let's think about it for a while. It means that if we pick 7 billion people (the world's population) and 20 somewhat independent factors (IQ, length, vision, income etc), then <em>most of the world's population</em> is Pareto efficient. So it's hard/impossible to find another person who is better than you at <em>everything</em> :sunglasses:</li>
</ul>
State drift2016-09-08T00:00:00Zhttps://erikbern.com/2016/09/08/state-drift.html<p>I generally haven't written much about software architecture. People make heuristics into religion. But here is something I thought about: <em>how to build in self-correction into systems</em>. This has been something just vaguely sitting in my head lacking a clear conceptual definition until a whole slew of things popped up today that all had the exact same issue at its core. I'm going to refer to it as <em>state drift</em> lacking a better term for it.</p>
<h2 id="what-is-state-drift">What is state drift?</h2>
<p><img src="https://erikbern.com/assets/factory.gif" alt="factory"></p>
<p>State drift is when there's two components that synchronize state. Actually, doesn't even have to be two, and the “state” may be somewhat virtual, not in an explicit sense. But to make it easy let's say we have a producer who maintains a state, and the producer sends deltas to an observer, that updates its own state. If care isn't taken, the state in the observer will start to drift away from what it's supposed to be. Without a self-correction mechanism, you are forever screwed.</p>
<p>These three real world cases came up independently of each other today:</p>
<ul>
<li><strong>Service updates over email</strong> – sadly some of our vendors have suboptimal API's (this is the mortgage industry) and we have to resort to email parsing to get certain updates. But emails get lost and formats change and suddenly you realize your view of the outstanding service order doesn't match the vendor's view.</li>
<li><strong>Webhooks</strong> – have a lot of other annoying issues (more on that later) but in particular there is rarely any redelivery guarantees. A lot of API's look call back using webhooks when some data is ready (for operations that take longer than a second) but what if that callback gets lost in the ether?</li>
<li><strong>Websockets</strong> to push state to clients – we use a <a href="https://en.wikipedia.org/wiki/Single-page_application">single page app</a> and some of the state is pushed from the backend to the frontend, meaning the frontend has its own view of what the backend state looks like.</li>
</ul>
<h2 id="why-cant-you-just-write-code-with-100-uptime-trollface">Why can't you just write code with 100% uptime? :trollface:</h2>
<p>Ok great thanks! I should have thought about it.</p>
<p>But yeah the problem is that if you lose a single delta, if there's no way to self-correct, it's <em>game over</em>. Sadly it doesn't matter if you have 99.99% uptime. Conversely, a system with a level of self-correction built in can afford quite a lot of errors and it will recover very nicely. In a lot of scenarios, you don't even have a choice. TCP connections randomly drop, and messages will get lost. Ideally you want both solid redelivery guarantees <em>and</em> some way to recover from corrupted state.</p>
<h2 id="how-to-solve-it">How to solve it?</h2>
<p>Just briefly wanted to mention that I'm not a super big fan of webhooks, and I will elaborate a bit later.</p>
<p>I think the best solution when you have webhooks (or any delta pushing mechanism) is to treat the updates <em>opportunistically</em>, and use a separate mechanism to reconcile state every once in a while. This can often be done in the most simple way – every once in a while, copy the entire state from the producer to the observer.</p>
<p>Of course, you can make this more advanced – afaik Git uses <a href="https://en.wikipedia.org/wiki/Merkle_tree">Merkle trees</a> to synchronize state. Another example is <a href="https://en.wikipedia.org/wiki/Rsync#Algorithm">rsync</a> which has an algorithm that compares two directory listings before it copies any files. These are state synchronization mechanism that are designed to detect and fix any discrepancies.</p>
<p><a href="https://github.com/spotify/luigi">Luigi</a> (mentioning it mostly because I'm the author) has a particularly simple reconciliation mechanism – the file system. Every time a workflow starts, it checks what's been done and what's not been done by seeing what exists (although this can be any user-provided checkpoint, in practice it's local files, HDFS, S3 or something similar). It pushes everything to the server during scheduling. During the work phase, it pushes deltas to the server, and the server tells the worker what to work on next. Occasionally either of those things fail, but we can ignore without much concern. The fact that a full state synchronization happens every scheduling means the state drift is limited.</p>
<p>Now that I think about it, the same principle applies to <a href="https://en.wikipedia.org/wiki/Video_compression_picture_types">video compression</a>. If there were no key frames, the state drift would increase slowly over time. Key frames bring the state drift back to 0.</p>
<p>Full state reconciliation might be way too expensive, so another complementary strategy is to make sure there are very strong delivery guarantees of the deltas. Systems <a href="http://kafka.apache.org/">Kafka</a> which uses at distributed durable commit log to store a message queue. If a consumer dies, they can re-consume all messages from a certain point in time. It would be awesome if websockets could work the same way so that if the TCP connection is lost, we know where to resume from.</p>
<h2 id="speaking-of-webhooks">Speaking of webhooks…</h2>
<p>Not a super big fan. Here are some reasons</p>
<ul>
<li>I have a simple script to call some remote server but suddenly I need to run a HTTP server inside it</li>
<li>… and I also need to poke holes through a bunch of firewalls</li>
<li>A huge problem is the lack of redelivery guarantees. If you don't have 100% uptime, which is basically impossible, then you will lose data. If that data is not possible to recover, you have a problem.</li>
<li>In practice often the URL of the webhooks is hardcoded somewhere, meaning you can't decouple the caller/callee. Ideally you want multiple clients to be able to call and receive updates from the same API. The easiest solution to this is to make the webhook URL part of the request payload.</li>
<li>Debugging issues is much harder because you don't know where something got lost. If something is always pulling in one end, you know immediately when it's break. With push, that doesn't happen.</li>
</ul>
<p>… but webhooks are here to stay, so let's accept it. Here's a free open source project idea (I'm actually somewhat tempted to build this): Provide a simple service that lets you expose a webhook to the world, but store all incoming requests in a durable queue. Support long polling (think <code>tail -f</code>) for updates as well. I think it would be almost trivial to build something like this, using a Lambda worker in AWS together with SQS, but I have little experience so I'll defer it for now. But feel free to steal :)</p>
When machine learning matters2016-08-05T00:00:00Zhttps://erikbern.com/2016/08/05/when-machine-learning-matters.html<p>I joined Spotify in 2008 to focus on machine learning and music recommendations. It's easy to forget, but Spotify's key differentiator back then was the low-latency playback. People would say that it felt like they had the music on their own hard drive. (The other key differentiator was licensing – until early 2009 Spotify basically just had all kinds of weird stuff that employees had uploaded. In 2009 after a crazy amount of negotiation the music labels agreed to try it out as an experiment. But I'm getting off topic now.)</p>
<p>Music distribution is a trivial problem now. Put everything on a CDN and you're done. The cost of bandwidth and storage has gone down by an order of magnitude, not to mention the labor cost needed to build and maintain it.</p>
<p>Anyway, at some point in 2009 we realized that we had far bigger challenges at Spotify than building a music recommendation system. So instead, I switched gears and ran the “Analytics team” for 2 years. We did the first A/B tests, ad delivery optimizations, provided data points crucial to bizdev deals, etc.</p>
<p>Not until 2013 did we feel like it was time to focus on music recs. So I switched back and built up a team around that. The feeling was that we already solved the “tablestakes” problems around music distribution and music management. Those problems had become easy to solve for anyone. The next differentiator would be more advanced features that deliver user value and are harder for competitors to copy. So we focused a lot on ML again.</p>
<p>Which brings me to <a href="https://twitter.com/bernhardsson/status/754784884082745344">this conclusion</a></p>
<p><img src="https://erikbern.com/assets/scarface.png" alt="scarface"></p>
<p>In the majority of all products, machine learning will not be a key differentiator in the first five years.</p>
<h2 id="most-machine-learning-is-sprinkles-on-the-top">Most machine learning is sprinkles on the top</h2>
<p>The first few years of product iteration is about getting the “tablestakes” out of the way. The ROI of those are just vastly bigger. I lead the tech team at a startup and we are nowhere near using any kind of sophisticated machine learning, two years into the process. There are a few promising opportunities where we want to use it. I absolutely think it's going to be a huge competitive advantage for us. But right now far more simpler things matter. Spending a few days working on the conversion funnel is guaranteed do deliver far more business value.</p>
<p>Rarely is machine learning the fundamental <em>enabler</em> of a product. It's often an <em>enhancer</em>. This unfortunately means that the machine learning team isn't a team that creates the core business value and has a crucial strategic role. It will be the team that comes in after 5-10 years once the “basic” features have been built and then squeezes out another 10% MAU by A/B testing the crap out of the product. Despite the current AI hype, most of the big shops focus on relatively mundane things. Google is trying to get you to click on more ads, Facebook to use the newsfeed more. It's all incremental improvements on top of a product that already existed for 10 years.</p>
<p><img src="https://erikbern.com/assets/enhance.gif" alt="enhance">{:width="1024px”}</p>
<p><em>Obviousy the image above has nothing to do with this post. I just thought it was funny. Sorry.</em></p>
<h2 id="pick-your-competitive-advantage">Pick your competitive advantage</h2>
<p>How can we get around this? How can we build a company that's founded based on machine learning first? I suspect ML in itself is very rarely a competitive advantage. <em>Any machine learning company needs to find a sustainable non-ML advantage.</em> Do you have a fantastic set of image filters? Great, use that tiny head start, launch an app and build a social network. Do you have a really good fraud detection system? Go out and sign up enterprise customers that feed you data back.</p>
<p>Machine learning can be a first mover advantage. But there's a high likelihood whatever insight you have will be independently discovered and published at the next NIPS/KDD/ICML. You need to turn it into something sustainable – having data, or lots of users, or very sticky enterprise contracts, or something else.</p>
<p>Besides the core machine learning, <em>other technology</em> can definitely be a competitive advantage. Building super nasty integrations with vendors, or figuring out the control engineering of the suspension system of a self driving car. Those are proprietary assets where there's little open research. For the pure machine learning I think we'll see a separate force of commoditization of machine learning in those areas, where the technological differental between companies coverges towards zero. Knowing how to build a convolutional neural network will not be a valuable asset. Hooking it up to a surveillance system and building video distribution system could be a really key piece of technology.</p>
<p>Don't underestimate the power of data. Scraping the web doesn't create valuable asset. But if you can obtain highly valuable unique data then that's a huge competitive advantage. Another type of data I think people underestimate is in people's heads – <em>learnings</em> from real production usage. Eg. Netflix has iterated movie recommendations for 10 years. They know their shit. It's hard building a better recommender system even if you magically had ten times the data that Netflix has.</p>
<p>What seems to happen in reality is that the human capital becomes real asset. <a href="https://www.cbinsights.com/blog/top-acquirers-ai-startups-ma-timeline/">Here's a list of some acquisitions</a>. It's clear to me these acquisitions were 90% acqui-hire – about human capital being redeployed to something else. Google and other big players has shown that they are willing to pay a huge premium for smart teams (throwing out a fun conspiracy theory just for the sake of it: Google is going to acqui-hire any team with smart people just to create a talent monopoly.) These companies all had built some cool tech, but the price paid really represented the scarcity of skills. I expect that scarcity to vanish gradually.</p>
Subway waiting math2016-07-09T00:00:00Zhttps://erikbern.com/2016/07/09/waiting-time-math.html<p>Why does it suck to wait for things? In a <a href="/2016/04/04/nyc-subway-math.html">previous post I analyzed a NYC subway dataset</a> and found that at some point, quite early, it's worth just giving up.</p>
<p>This isn't a proof that the subway doesn't run on time – in fact it might actually <em>proves that the subway runs really well</em>. The numbers indicate that it's not worth waiting after 10 minutes, but it's a rare event and usually involves something extraordinary like a multi-hour delay. You should roughly give up after some point related to the normal train frequency, and 10 minutes is not a lot at all. Conversely if the trains ran hourly, it probably would had been worth waiting an hour or more. My analysis gave me a lot of respect for the job MTA is doing.</p>
<p>But there's another effects that greatly impacts waiting time. The <em>variance</em>. It turns out that the the statistics of waiting makes it very sensitive to variance.</p>
<h2 id="how-variance-destroys-your-waiting-time">How variance destroys your waiting time</h2>
<p>Let's consider this toy model. Let's say the time between subways is drawn from the set of elements $$ T_1, \ldots, T_n $$. So the average time between subways is just $$ \frac{1}{n} \left( T_1 + T_2 + \ldots + T_n \right) $$.</p>
<p>Now let's say we arrive at a random point in time. With probability $$ T_j / \left( T_1 + T_2 + \ldots + T_n \right) $$, the next time to the subway is $$ T_j $$ from the previous one. I think of it as the following schematic:</p>
<p><img src="https://erikbern.com/assets/T_1_T_2.png" alt="waiting time"></p>
<p>Let's think about how long you have to wait given that you arrive at some random point in time. If the next train is train $$ j $$ then you end up having to wait some random amount of time distributed uniformly between $$ 0 \ldots T_j $$, the average of which is $$ T_j / 2 $$.</p>
<p>Multiplying the probabilities with the averages, you can see that the average time will be</p>
<p>$$ \frac{1}{2} \frac{T_1^2 + T_2^2 + \ldots + T_n^2}{T_1 + T_2 + \ldots + T_n} $$</p>
<p>It's basically the average value of the following graph:</p>
<p><img src="https://erikbern.com/assets/T_1_T_2_waiting_time.png" alt="waiting time"></p>
<p>Digging into the statistics we can actually rewrite the quantity as:</p>
<p>$$ \frac{1}{2} \frac{E[T^2]}{E[T]} = \frac{1}{2} \frac{E[T]^2 + Var(T)}{E[T]} = \frac{1}{2}E[T] \left(1 + c_v^2\right)$$</p>
<p>Here $$ c_v $$ denotes the <a href="https://en.wikipedia.org/wiki/Coefficient_of_variation">relative standard deviation</a> – the standard deviation divided by the average. This makes it a bit more clear what happens. The average waiting time is scales with the <em>variance</em> of time between subway trains. If there is absolutely no dispersion, then all subways arrive by the exact same rate, and the the average waiting time would be exactly half the time between subway trains.</p>
<p>The key thing here is to note that we have <em>squares</em> in the numerator. A single large value of $$ T_j $$ can have an outsized impact on the average time you have waited. For instance if $$ n = 2 $$ then the average waiting time behaves almost as $$ 1 / 2 \max(T_1, T_2) $$:</p>
<p><a href="https://gist.github.com/erikbern/a7c502aabb2892c3e86f9c58261d3da3"><img src="https://erikbern.com/assets/waiting_times_n_2.png" alt="waiting times"></a></p>
<p>If $$ n = 10 $$ and all $$ T_i = 1 $$
minute then the average waiting time is 30 seconds. But let's say we have a single $$ T_{10} = 10 $$ minutes – then the average waiting time is 2 minutes 52 seconds. So by adding a single 10x train delay with 10% probability, the *average* waiting time goes up by a factor of 5.7x! This illustrates how a single bad egg can destroy the average performance of the system and create a kind of “bottleneck” effect.</p>
<p><img src="https://erikbern.com/assets/T_1_T_10.png" alt="waiting times"></p>
<p>Even a 1% risk of a 10x delay pushes up the average waiting time by a whopping 1.83x – this is still while running 99% of the trains on time.</p>
<p><a href="https://gist.github.com/erikbern/a9dfef6ff1834ccfac8dc58a9d80d019"><img src="https://erikbern.com/assets/train_problems.png" alt="waiting times"></a></p>
<p>These charts above were artificial toy datasets with only two different outcomes, but we can generalize it to any probability distribution.</p>
<h2 id="how-much-does-the-variance-matter-in-reality">How much does the variance matter in reality?</h2>
<p>I crunched the MTA dataset and ended up with the following numbers:</p>
<p><img src="https://erikbern.com/assets/avg_time_waiting.png" alt="avg waiting time"></p>
<p>In most cases it makes the average waiting time longer by about 2x – poor Staten Islanders however are experiencing some really bad waiting time caused by the SI's variance. This data is only during the day. The interesting conclusion here is that average time waiting could be <em>cut in half</em> by just making the subway trains run more evenly. You wouldn't have to add a single train to the system or drive them faster. Just make sure they are more evenly spaced out.</p>
<p>I was hoping L maybe would exhibit terrible stats here, finally proving the popular belief that <a href="http://www.istheltrainfucked.com/">L sucks</a>. Unfortunately I'm still not able to see any quantitative evidence supporting this. Does L really deserve its terrible reputation? I'm starting to think it's really one of the best run subway lines in NYC.</p>
<ul>
<li><em>Note 1: I published an version of this blog post earlier this week but it contained a few errors that have been fixed.</em></li>
<li><em>Note 2: This post contains a bunch of math that isn't rendered properly in RSS. Sorry about that!</em></li>
</ul>
Approximate nearest news2016-06-02T00:00:00Zhttps://erikbern.com/2016/06/02/approximate-nearest-news.html<p><img src="https://erikbern.com/assets/tree-full-K.png" alt="pic"></p>
<p>As you may know, one of my (very geeky) interests is <a href="https://en.wikipedia.org/wiki/Nearest_neighbor_search">Approximate nearest neigbor</a> methods, and I'm the author of a Python package called <a href="https://github.com/spotify/annoy">Annoy</a>.</p>
<p>I've also built a benchmark suite called <a href="https://github.com/erikbern/ann-benchmarks">ann-benchmarks</a> to compare different packages. Annoy was the world's fastest package for a few months, but two things happened.</p>
<ul>
<li><a href="https://falconn-lib.org/">FALCONN</a> (FAst Lookups of Cosine and Other Nearest Neighbors) is a new library based on Locality Sensitive Hashing</li>
<li><a href="https://github.com/searchivarius/nmslib">NMSLIB</a> authors came up with an impressive set of improvements to their algorithms.</li>
</ul>
<p>The quest for the fastest nearest neighbor algorithm intensifies. (Except, I expect Google has already found a method that's 10x faster and works at a 1,000,000x larger scale).</p>
<p>What makes me excited is that ann-benchmarks has become the standard benchmark for approximate nearest neighbor algorithms. I'm glad, because open objective benchmarks drives progress. Both FALCONN and NMSLIB have been using ann-benchmarks for their tests and the authors contributed code back to ann-benchmarks to support their libraries.</p>
<p>The situation looks like this right now:</p>
<p><img src="https://erikbern.com/assets/ann-benchmarks-glove.png" alt="glove"></p>
<p>If you look at the higher precision results (0.8 and up), Annoy is now the fourth fastest library. FALCONN and NMSLIB (both SW-graph and hnsw) are better. In fact, hnsw is faster by almost an order of magnitude, which is very impressive. This is a new algorithm that was recently published in a paper: <a href="http://arxiv.org/abs/1603.09320">Efficient and robust approximate nearest neighbor search using Hierarchical Navigable Small World graphs</a> (the paper also features a benchmark against Annoy).</p>
<h2 id="using-annoy-to-visualize-large-datasets">Using Annoy to visualize large datasets</h2>
<p>A cool thing to do when you have a high dimensional data set is to embed it in 2D or 3D for visualization. There are algorithms that preserve similarity during the embedding, the most widely used one being <a href="https://lvdmaaten.github.io/tsne/">t-SNE</a>.</p>
<p>A great paper came out that improves on t-SNE for 2D and 3D embedding of large high dimensional data sets: <a href="https://arxiv.org/abs/1602.00370">Visualizing Large-scale and High-dimensional Data</a>. The authors of the paper propose a new method that they implement using Annoy – it also mentions ann-benchmarks. Unfortunately I haven't seen any code yet (I've been tempted to build something) but there's an <a href="https://github.com/elbamos/largeVis">R implementation</a> that doesn't use Annoy.</p>
<p>For any readers of this blog who is (a) interested in approximate nearest neighbors (b) based in Philadelphia (I expect the intersection of those sets to be $$ \approx \emptyset $$): I'm going to talk about Annoy at the <a href="http://www.meetup.com/DataPhilly/events/231326003/">DataPhilly meetup</a> on June 15. It's going to be quite similar to <a href="http://www.slideshare.net/erikbern/approximate-nearest-neighbor-methods-and-vector-models-nyc-ml-meetup">my talk at the NYC Machine Learning</a> meetup.</p>
What is your motivation?2016-05-24T00:00:00Zhttps://erikbern.com/2016/05/24/what-is-your-motivation.html<p>I've been trying to learn Clojure. I keep telling people I meet that I really want to learn Clojure, but still every night I can't get myself to spend time with it. It's unclear if I really want to learn Clojure or just want to <em>have learned</em> Clojure?</p>
<p>Which makes me thing about my teenage years. I really wanted to make music on my computer. I would spend a couple of hours per week messing around with various tools. This was in the heydays of DSL and I downloaded gigabytes of music on Napster. I just really like the thought of making something that was as good as I heard. Fast forward fifteen years and this guy roughly sums up why I never succeeded:</p>
<div style="position: relative; padding-bottom: 56.25%; height: 0; overflow: hidden;">
<iframe src="https://www.youtube.com/embed/Gm_PzInGTCA" style="position: absolute; top: 0; left: 0; width: 100%; height: 100%; border:0;" allowfullscreen title="YouTube Video"></iframe>
</div>
<p><a href="https://en.wikipedia.org/wiki/Moodymann">Moodymann</a> isn't just a character, he's also a producer from Detroit who explains his motivation:</p>
<p><em>I'm not into this to press up a mass amount of records. I'm not into this to travel the motherfucking world. I'm not into this to impress anybody. I'm into this for my own heart and soul. A lot of people, after work, you got to go home, you take a bath. A lot of people go home, you fuck your wife. A lot of people go home, you cut your grass. I go home, and I fuck that motherfucking <a href="https://en.wikipedia.org/wiki/Music_Production_Center">MPC</a> all fucking night.</em></p>
<p>The key points here is that (a) Moodymann derives instrinsic joy from making music (b) it's a prime example of a kind of <a href="https://en.wikipedia.org/wiki/Protestant_work_ethic">Lutheran work ethic</a> that lets you excel at what you're doing. Of course, regardless of my intent to learn Clojure, someone else will actually enjoy doing it all fucking night (paraphrasing Moodymann) and eventually they will be 100x better than me.</p>
<p>I've met roughly 100 people who say they want to learn machine learning. But do they? Or do they just want to <em>have learned machine learning</em>? I don't know. But I know that I've never learned anything nontrivial without having fun learning it. So it seems like the trick to learn anything is really to find a way to <em>enjoy learning it</em>. Not try to find any shortcuts. If you want to learn Spanish, try to look for a way to enjoy it. Then do it all night long.</p>
<p><strong>The other extreme</strong></p>
<p>Turns out there's another extreme of this. When the joy from doing something is so strong that it overshadows the whole utility of it. I've met about 1000 developers who just <em>love</em> to work with cool things. Building algorithms, messing around with machine learning, whatever. People roughly fall on a spectrum in terms of motivation: are they motivated by <em>delivering value</em> or are they motivated by the <em>tool</em>?</p>
<p>I've learned to avoid hiring people in the latter category. I love ridiculously smart people, and I don't mind at all if they like to geek out and study Haskell in their spare time. But they turn their whole career into a quest to advance their knowledge of functional programming then there's some fundamental misalignment between the company's interests and their interests.</p>
<p>Another example of this phenomenon is a trap I fell into myself. I was coding for many many years and built up this innate sense of satisfaction every time I implemented something. Being a new manager I really struggled with the lack of satisfaction from actually <em>doing management</em>. As a result I would fall back into the zone writing code and ignore everything that really mattered. It took me <em>years</em> to build up the sense of satisfaction of doing something that mattered at a higher level.</p>
<p><strong>What is your motivation?</strong></p>
<p>My mental model is something like this: there are all these long term goals like become successful. But planning for that would take an incredible amount of mental effort so we end up establishing some proxies for that. In a day to day setting these proxies manifests themselves as a sense of accomplishment. You get 2 units of satisfaction when you write code for an hour and you get 1 unit of satisfaction being in a meeting for 1 hour. Or whatever. <em>But those numbers can be completely out of whack with reality.</em> Sometimes they grossly understated and sometimes grossly overstated.</p>
Dollar cost averaging2016-04-26T00:00:00Zhttps://erikbern.com/2016/04/26/dollar-cost-averaging.html<p>(I accidentally published an unfinished draft of this post a few days ago – sorry about that).</p>
<p>There's a lot of sources preaching the benefits of <em>dollar cost averaging</em>, or the practice of investing a fixed amount of money regularly. The alleged benefit is that when the price goes up, well, then your stake is worth more, but if the price goes down, then you get more shares for the same amount of money. <a href="https://en.wikipedia.org/wiki/Dollar_cost_averaging">According to</a> Wikipedia, it “minimises downside risk”, about.com <a href="http://beginnersinvest.about.com/cs/newinvestors/a/041901a.htm">says</a> it “drastically reduces market risk”, and an article on Nasdaq.com <a href="http://www.nasdaq.com/article/why-dollar-cost-averaging-is-a-smart-investment-strategy-cm354240">claims that</a> it's a “smart investment strategy”.</p>
<p>This is nonsense if you think about it. You never benefit from a price going down. The stock market is mostly efficient and if it goes down by 1% then it's as likely to go down further as it is to come back up.</p>
<p>Separately, it's generally a false dichotomy to talk about dollar cost averaging as an investment strategy, since it makes it seem like there are other equally viable strategies available. For the average person who wants to save money by investing it in to the stock market, there's really no choice between strategies. Given that the stock market is expected to go up, the earlier you invest, the better. So the best strategy is always to invest your money as soon as you can.</p>
<p>So if you invest say $100 every week, is that inherently a lot less risky than going all-in with a $1M investment and holding it? Are we more protected from market downturns? I downloaded S&P 500 data going back to 1870 and wanted to take a look.</p>
<p><img src="https://erikbern.com/assets/sp500_return.png" alt="s&p 500 return"></p>
<p>The key thing here is to use the <em>total return</em>, i.e. with dividends reinvested, or you will understate the yield. You can get the data <a href="http://data.okfn.org/data/core/s-and-p-500">here</a>.</p>
<p>Comparing lump sum vs dollar cost averaging is a bit weird since the cash flows are so different. One way you can do it is to compute the <a href="https://en.wikipedia.org/wiki/Internal_rate_of_return">internal rate of return</a>. Let's look at five year investment horizons and what the value of a dollar cost averaging strategy would give us, versus a lump sum investment</p>
<p><img src="https://erikbern.com/assets/lump_vs_dcav.png" alt="lump vs DCAV"></p>
<p>We see that there's a improvement in using DCA although it's quite small – an additional return of about 25 basis points every year. However the simulation shows that dollar cost averaging actually is <em>more</em> likely to be in the red five years later, <em>12.9%</em> compared to <em>11.0%</em> for a lump sum investment.</p>
<p>If you look at it a bit closer, it turns out none of these differences are statistically significant. The conclusion here is that the difference, if it exists, must be very small</p>
<h2 id="how-to-compute-irr">How to compute IRR</h2>
<p>Computing internal rate of return (also called annual percentage rate) is a fun little numerical problem. You want to find the rate $$ r $$ such that the cost of payment stream is equal to zero:</p>
<p>$$ \sum_i c_i (1 - r)^{-i} = 0 $$</p>
<p>where $$ c_i $$ is the payment/income at time $$ i $$. Or if you use <a href="https://en.wikipedia.org/wiki/Compound_interest#Continuous_compounding">continuously compounding rates</a> you have the equivalent relation $$ \sum_i c_i e^{-i} = 0 $$. Either way, it's the same problem as finding the roots of a polynomial. <a href="http://docs.scipy.org/doc/numpy-1.10.0/reference/generated/numpy.irr.html"><code>numpy.irr</code></a> has a pretty terrible implementation of this that's extremely slow. I ended up open sourcing a <a href="https://github.com/better/irr">very simple implementation</a> that uses binary search.</p>
<h2 id="notes">Notes</h2>
<ul>
<li>Vanguard put together <a href="https://pressroom.vanguard.com/content/nonindexed/7.23.2012_Dollar-cost_Averaging.pdf">a presentation</a> getting to the same conclusion. <a href="https://www.betterment.com/resources/investment-strategy/should-i-dollar-cost-average-into-the-market/">Another article</a> from Betterment is also quite good.</li>
<li>All code is available <a href="https://gist.github.com/erikbern/a31f9bf7ea896b5d5c286ad13155e8c1">as a gist</a>.</li>
</ul>
Why organizations fail2016-04-18T00:00:00Zhttps://erikbern.com/2016/04/18/why-organizations-fail.html<p><img src="https://erikbern.com/assets/simpsons_enron_1.gif" alt=""></p>
<p>One of my favorite business hobbies is to reduce some nasty decision down to its absolute core objective, decide the most basic strategy, and then add more and more modifications as you have to confront the complexity of reality (yes I have very lame hobbies thanks I know).</p>
<p>Software engineers want to deliver features quickly without adding too much tech debt. But what's the point of delivering features? Business value. And what's the point of not adding too much tech debt? It's so that we don't add a bunch of crap that slows down future iteration speed, i.e. we don't want to slow down the future rate of delivering business value (modulo some kind of discounting factor). There is no intrinsic value of beautiful code and no intrinsic value of tech debt. I probably sound like a nihilist, but everything really just boils down to: what's the most efficient way to deliver business value?</p>
<p>So let's start with the assumption that it's everyone's job to deliver business value. Why can't we just make everyone's job to do this? Strip all titles and all management structure – just tell everyone to act in the company's best interest. My dream is that one day I made myself useless. Everyone in the team just comes in every morning and asks themselves: <em>what is the highest ROI thing I can do today?</em> And they just do it. Nothing else is needed. Why can't that just work?</p>
<p>It's of course an incredibly naïve idea – but where does it fail, exactly? It turns out there's in two places. Nothing more, nothing less:</p>
<ol>
<li>Incentive problems (agents do not want to act in the organization's interests)</li>
<li>Bounded rationality problems (agents do not have the necessary information to do so)</li>
</ol>
<p>I can't stress enough that <em>there is no other reason</em>. I had this exact theory for many years but wasn't able to express it in the same eloquent way as above, which is something I copied verbatim from a fantastic paper I just encountered: <a href="https://dl.dropboxusercontent.com/u/2021568/GRPublishedJELFinal.pdf">Why Organizations Fail: Models and Cases</a>.</p>
<p>With the two bullets above our model is basically complete. The beauty of thinking about it this way is that it breaks down management recursively. As a manager the best way to get value out of other people is to:</p>
<ol>
<li>Make sure people's interests are aligned with the company's</li>
<li>Make sure everyone in the team has the necessary information they need</li>
</ol>
<p>Everything else follows. Anything else that 1. and 2. is useless to spend time on as a manager. For instance it explains why micromanaging is useless: all you need to do is give people the information they need to make the right decisions, and reward good behavior. Similarly the model also highlights why it's important to delegate projects with their full context: without enough information people will make the wrong decisions. And it points out that you should reward people for delivering business value: rewarding people for anything else and you misalign people's interests with something else than the company's.</p>
<p>The paper above is pure game theory and I love its mathematical clarity. Of course it's just a model of reality and like any game theoretical model it assumes (incorrectly) that humans are 100% rational. But I think it's a good first order approximation of what to do and it's a good reality check.</p>
<p><img src="https://erikbern.com/assets/simpsons_enron_2.gif" alt=""></p>
NYC subway math2016-04-04T00:00:00Zhttps://erikbern.com/2016/04/04/nyc-subway-math.html<p>Apparently <a href="http://www.mta.info/">MTA</a> (the company running the NYC subway) has a <a href="http://datamine.mta.info/">real-time API</a>. My fascination for the subway takes autistic proportions and so obviously I had to analyze some of the data. The documentation is somewhat terrible, but here's some relevant code for how to use the API:</p>
<div class="highlight"><pre style="color:#f8f8f2;background-color:#272822;-moz-tab-size:4;-o-tab-size:4;tab-size:4"><code class="language-python" data-lang="python"><span style="color:#f92672">from</span> google.transit <span style="color:#f92672">import</span> gtfs_realtime_pb2
<span style="color:#f92672">import</span> urllib
<span style="color:#66d9ef">for</span> feed_id <span style="color:#f92672">in</span> [<span style="color:#ae81ff">1</span>, <span style="color:#ae81ff">2</span>, <span style="color:#ae81ff">11</span>]:
feed <span style="color:#f92672">=</span> gtfs_realtime_pb2<span style="color:#f92672">.</span>FeedMessage()
response <span style="color:#f92672">=</span> urllib<span style="color:#f92672">.</span>urlopen(<span style="color:#e6db74"></span><span style="color:#e6db74">'</span><span style="color:#e6db74">http://datamine.mta.info/mta_esi.php?key=</span><span style="color:#e6db74">%s</span><span style="color:#e6db74">&feed_id=</span><span style="color:#e6db74">%d</span><span style="color:#e6db74">'</span> <span style="color:#f92672">%</span> (os<span style="color:#f92672">.</span>environ[<span style="color:#e6db74"></span><span style="color:#e6db74">'</span><span style="color:#e6db74">MTA_KEY</span><span style="color:#e6db74">'</span>], feed_id))
feed<span style="color:#f92672">.</span>ParseFromString(response<span style="color:#f92672">.</span>read())
<span style="color:#66d9ef">print</span> feed
</code></pre></div><p>I started tracking all subway trains one day and completely forgot about it. Several weeks later I had a 3GB large data dump full of all the arrivals for 1, 2, 3, 4, 5, 6, L, SI and GC (the latter two being Staten Island railway and Grand Central Shuttle).</p>
<h2 id="lets-do-some-cool-stuff-with-this-data">Let's do some cool stuff with this data!</h2>
<p>For instance, here are a bunch of subway trains for a while on the 1 line:</p>
<p><a href="/assets/1_trips.png"><img src="https://erikbern.com/assets/1_trips.png" alt="1 trips"></a></p>
<p>The reason I started looking at this data was to understand if to what extent waiting for a subway is “sunk cost” vs. an investment. In particular, what is the optimal strategy if you're waiting for the subway? My intuition told me that there's a T such that the expected <em>additional time you have to wait</em> goes down as you approach T, but then goes up afterwards. Until T, every second you wait gets you closer to the next subway. After T, there's most likely some random issue with the subway and you should just give up.</p>
<p>Turns out there is such a thing. But let's start by just looking at a plot of subway delays. The distribution of time between two trains $$ P(t) $$ looks like this:</p>
<p><img src="https://erikbern.com/assets/time_between_arrivals.png" alt="delays"></p>
<p>This a probability distribution made from the <a href="https://stanford.edu/~mwaskom/software/seaborn/generated/seaborn.distplot.html#seaborn.distplot">distplot</a> function in <a href="https://stanford.edu/~mwaskom/software/seaborn/index.html">Seaborn</a>. It's a histogram (with 1 minute bins) combined with a <a href="https://en.wikipedia.org/wiki/Kernel_density_estimation">kernel density estimation</a> of the probability distribution.</p>
<p>An interesting thing is that the distribution is <em>multimodal</em> with the biggest peak around 5 minutes and another around 20 minutes. I suspect this reflect rush hour vs night traffic. There's also a peak just after 0 which I suspect is just what happens during rush our traffic when subways end up clustering.</p>
<p>Note that this is <em>not</em> the distributions of waiting times, which is a bit different. If you assume that you are equally likely to arrive at any subway stop at any time of day, then the <em>waiting time until the next subway</em> looks like the distribution below. This represents a probability distribution where at any time of day, you pick a subway line, go to a random subway station, and wait for the next train.</p>
<p><img src="https://erikbern.com/assets/time_to_next_arrival.png" alt="delays"></p>
<p>This distribution is a bit more regular. The most likely time you have to wait (the <a href="https://en.wikipedia.org/wiki/Mode_(statistics)">mode</a>) is actually about 1 minute, although the mean and the median are much larger.</p>
<h2 id="erik-please-digress-and-talk-about-the-relationship-between-the-two-curves">Erik please digress and talk about the relationship between the two curves</h2>
<p>Complete side note, but I realized in general you can take the distribution of <em>time between events</em> $$ P(t) $$ and can convert to the distribution of <em>time to the next event</em> using the relation</p>
<p>$$ Q(t) = \frac{ \int_t^\infty P(s) ds }{ \int_0^\infty sP(s) ds } $$</p>
<p>My math is a bit rusty so please don't use this for heart surgery. But it seems to work – if you plug in a <a href="https://en.wikipedia.org/wiki/Dirac_delta_function">Dirac delta</a> $$ P(t) = \delta(t-d) $$ then you get the uniform distribution back: $$ Q(t) = 1/d, 0 \le t \le d$$. In the data above I just implemented it in a dumb way by sampling.</p>
<h2 id="waiting-time-by-line">Waiting time by line</h2>
<p>Let's plot the average time to arrival by line. This is limited to the lines in the API. Let's switch to a <a href="https://stanford.edu/~mwaskom/software/seaborn/generated/seaborn.violinplot.html">violin plot</a> using Seaborn.</p>
<p><img src="https://erikbern.com/assets/time_to_arrival_by_line.png" alt="delays"></p>
<p>Interestingly, L stacks up pretty well against the other subway lines, despite its notorious delays (and websites such as <a href="http://www.istheltrainfucked.com/">is the L train fucked</a>). The median waiting time is the smallest out of all the lines, and even the extreme case compares favorably.</p>
<p>(Btw the key data set of chart is <a href="http://web.mta.info/developers/resources/line_colors.htm">MTA's offical color schema</a>. Did you know that the color of L is not a perfect gray but actually #A7A9AC – marginally more blue? Amazing)</p>
<h2 id="waiting-time-by-time-of-day">Waiting time by time of day</h2>
<p>Obviously time of day is an extremely important factor here so let's look at the waiting time by time of day. Each point in time gives us a probility distribution over waiting time so let's plot some of the quartiles and how it changes over the day!</p>
<p><img src="https://erikbern.com/assets/time_to_arrival_by_time_of_day.png" alt="delays"></p>
<p>The 50 percentile line (blue) describes the median time you have to wait based on the time of day. The 90 percentile line (yellow) describes how long you have to wait if you are unlucky and a 90% event happens. It depends on your <a href="https://en.wikipedia.org/wiki/Risk_aversion">risk averseness</a> what line you pick – if you <em>have to</em> make it to a flight you should probably pick the 90th percentile, but if it doesn't matter if you are late, pick the 50th.</p>
<p>Not shockingly, the waiting times peak in the wee hours – in particular the 90th percentile shoots up around 4AM. The 7AM-7PM window is very stable, and then it shoots up again.</p>
<h2 id="waiting-for-subway-and-sunk-cost">Waiting for subway and sunk cost</h2>
<p>Let's say you wait for the subway for 10 minutes and it hasn't arrived yet. Should you give up? Probably not. But if you have waited for the subway for an hour, there's probably no point. <em>Up to a certain point</em> waiting for the subway is an investment in getting home sooner.</p>
<p>It also depends on your risk averseness again – if you need to make it to a flight, you might just give up and get a cab at some point. So given that you spent $$ t $$ minutes so far waiting for the subway, what's the <em>additional</em> time you're going to have to wait?</p>
<p><img src="https://erikbern.com/assets/time_to_arrival_percentiles.png" alt="delays"></p>
<p>There's a tricky bias here, because the times where you waited longer tends to skew towards nights. This would be a <a href="https://en.wikipedia.org/wiki/Confounding">confounding factor</a>. So I limited the data set to 7AM-7PM above.</p>
<p>The interesting conclusion is that <strong>after about five minutes, the longer you wait, the longer you will have to wait.</strong> If you waited for 15 min, the median <em>additional waiting time</em> is another 8 minutes. But 8 minutes later if the train still hasn't come, the median <em>additional waiting time is now another 12 minutes.</em></p>
<p>So when should you give up waiting? One way to think about it is how much time you think it's worth waiting. The time you already waited is “sunk cost” so it doesn't really matter. What matters is how much <em>additional time</em> you are willing to wait. Let's assume you want to optimize for a wait time that's less than 30 min in 90% of the cases. Then the max time you should wait is about <strong>11 minutes</strong> until giving up (this is at the point where the yellow line cuts the 30 min mark).</p>
<p>This reminds me a bit of project management. The longer a project has been going on, the longer the expected value of <em>additional time</em> is. Whatever resources you spent is sunk cost but what matters is the most likely estimation of project completion going forward. But of course the more overdue a project is, the longer that estimate is.</p>
<p>Of course, there's nothing “magic” about these kinds of distributions. There are certain probability distributions where waiting is an “investment” – the expected time until the next event goes down for every second you wait. There is exactly one type of probability distributions where waiting doesn't affect the time until the next event at all. This is the <a href="https://en.wikipedia.org/wiki/Exponential_distribution">exponential distribution</a> and the particular property is referred to as <a href="https://en.wikipedia.org/wiki/Memorylessness#Continuous_memorylessness">memorylessness</a>. Then, there's “fat-tailed” distributions where the expected time to next event goes <em>up</em> for every second you wait. The NYC subway distribution exhibits all those behaviors in different parts of the curve.</p>
<p>All code is <a href="https://github.com/erikbern/mta">available here</a> if you are curious!</p>
<p>(addendum: this post got some traction – see <a href="https://www.reddit.com/r/nyc/comments/4ds036/nyc_subway_math/">Reddit thread</a> and <a href="https://news.ycombinator.com/item?id=11447535">Hacker News discussion</a>)</p>
Exploding offers are bullshit2016-03-16T00:00:00Zhttps://erikbern.com/2016/03/16/exploding-offers-are-bullshit.html<p><img src="https://erikbern.com/assets/time_bomb.gif" alt="Time bomb"></p>
<p>I do a lot of recruiting and have given maybe 50 offers in my career. Although many companies do, I <em>never</em> put a deadline on any of them. Unfortunately, I've often ended up competing with other companies who do, and I feel really bad that this usually tricks younger developers into signing offers. On numerous occasions, I've gotten an email halfway through the interview process</p>
<pre><code>Erik,
I'm very sorry, but I'm not going to move forward with the interview process.
Another company gave me an offer and they need a decision by Thursday.
Best regards,
XYZ
</code></pre><p>Every time, I have to explain to candidates that <em>exploding offers are bullshit</em>. I don't even know where to start:</p>
<ol>
<li>It's clearly just a bluff. Companies have <em>no</em> leverage in the situation. They would never lose a candidate that wants a few more days to think. At this point, they already spent thousands of dollars in interviews and sourcing, and there is no way they have any sort of leverage whatsoever. In a setting where you have one job and many applicants, exploding offer might make sense, but this is not the Great Depression and the power balance works the other way around.</li>
<li>It's taking advantage of people who are the least confident about the recruiting process and are the least comfortable asking for more time. You could argue it's a form of price discrimination where companies end up paying <em>less</em> than they would otherwise do for people who are less confident about themselves. Imagine that exploding offers would be illegal – some companies would now have to pay more to get the people that they would otherwise get.</li>
<li>It creates a race to the bottom that no one benefits from. Other companies have to start using exploding offers too. If a candidates feels pressured into accepting an offer that they would not have accepted otherwise, that's real value that gets destroyed. The candidate loses because they end up accepting an inferior offer. For the companies it nets out zero or negative – company A gains a role that company B lost, for a slightly less cost, but with a candidate that's slightly less motivated.</li>
<li>(More speculative) Shady behavior is rewarded. Companies who try to trick candidates are more likely to be shady in other ways – this is another reason how candidates lose out.</li>
</ol>
<p>This is corroborated by some experiments (although who knows, I have my doubts about any behavioral studies):</p>
<ul>
<li><em>“Across multiple studies, we find that a large portion of proposers issue exploding offers even though this results in substantially lower payoffs to themselves."</em> – from <a href="http://papers.ssrn.com/sol3/papers.cfm?abstract_id=1934128">Exploding offers can blow up in more than one way</a></li>
<li><em>“At the market level of analysis, the results suggest that exploding offers lower the quality of matching outcomes."</em> – from <a href="http://www.sciencedirect.com/science/article/pii/074959789190031N">Power balance and the rationality of outcomes in matching markets</a></li>
</ul>
<p>That's why I never give exploding offers.</p>
<p>Every time I get an email like the one above, I tell the candidate that they should just hold off and ask for a few more days. There's only upside in having one more option on the table. Often it works out fine, sometimes it doesn't. Of course, in a lot of cases my company wasn't the top choice anyway, and the candidate ends up joining whatever company they wants. My conversion funnel is as leaky as most companies. But every time you remove one more choice, you remove the possibility that that choice was actually the best one.</p>
<p>I remember once more than ten years ago when I had never had a “real” job and a company had scheduled an interview. The only problem was that I realized it was on my last day of a trip. I ended up spending about $100 extra to get back one day earlier (and of course the interviewer was sick that day and cancelled on me last minute). I clearly misunderstood who really had the leverage here.</p>
<p><a href="http://www.nationallawjournal.com/id=1202751423003/Firms-Bucking-the-System-to-Recruit-Top-Students?mcode=0&curindex=0&curpage=ALL">Law firms recruiting</a> at law schools had the same problem that reated a race to the bottom. In the end they ended up self-regulating, realizing that an uncoordinated competition would benefit no one – certainly not the students, who would be pressured into accepting roles without considering all options, and for the companies, that would hire a long time before graduation where data was less reliable.</p>
<p><em>“There's also concern that students will focus too early — the summer after their first year — on where they might want to work once they graduate instead of exploring their options before getting locked in. NALP's voluntary recruiting guidelines allow firms to interview and extend summer-associate job offers early; however, firms must leave those offers open until 28 days after on-campus interviews begin at the student's law school. The rule is intended to prevent so-called exploding offers that expire before students have time to weigh all their options. Firms have largely adhered to the rule and have not pressured students to accept early offers before the traditional recruiting season begins, career-services administrators said."</em></p>
<p>Even though self-regulation worked out well for law firms, I doubt that it will ever work in technology. But junior developers should be aware that exploding offers are really just bullshit. Everyone would be better off if exploding offers disappeared. Please call the bluff when you see it.</p>
<p><img src="https://erikbern.com/assets/explosion.gif" alt="Explosion"></p>
<p>(Edit: See the <a href="https://news.ycombinator.com/item?id=11449274">Hacker News discussion</a>)</p>
Meta-blogging2016-03-12T00:00:00Zhttps://erikbern.com/2016/03/12/meta-blogging.html<p>(This is not a very relevant/useful post for regular readers – feel free to skip. I thought I would share it so people can find it on Google.)</p>
<p>My blog blew up twice in a week earlier this year when I landed on Hacker News. The first time I was asleep so I didn't notice that the site went down. The second time I did notice, and scrambled to reconfigure Apache & MySQL to handle the load.</p>
<p>I decided it was time to move off Wordpress.</p>
<p>This is something I had been thinking for a long time – I hated the layout with my old site, especially the typography. I probably could have spent a bunch of time tweaking it but it also feels philosophically wrong to run a LAMP stack in 2016 for something as simple as a blog.</p>
<p>After some research I chose Jekyll. I liked the idea of static content and it seemed very lightweight. To do this I had to</p>
<ol>
<li>Clone <a href="https://github.com/poole/poole">Poole</a></li>
<li>Install the <a href="https://wordpress.org/plugins/jekyll-exporter/">Wordpress to Jekyll exporter</a></li>
<li>Run this <a href="https://gist.github.com/erikbern/5e81bf7d68e9deab9c55">simple postprocessing script</a> I had to build for some cleanup</li>
<li>Fixup a couple of things with Poole (in particular add <code>height: auto;</code> to the <code>img</code> tag in <code>_sass/_base.scss</code>, everything else was cosmetic superficial stuff, mostly to get nice serif fonts that seems to be the shit recently).</li>
</ol>
<p>Additionally I reconfigured some stuff around related pages (<code>brew install gsl</code>, <code>gem install rb-gsl</code>, set <code>lsi: true</code> in <code>_config.yml</code>). LSI is a pretty crappy algorithm for NLP but unfortunately there's nothing better out there.</p>
<p>Since the entire state is stored in the file system, I also use Github to host a repo with the blog in it. I'm still hosting the blog on a Digitalocean droplet, but might kill it and just switch to <a href="https://pages.github.com/">Github Pages</a> at some point.</p>
<p>Page load time went down drastically after deploying it:</p>
<p><img src="https://erikbern.com/assets/pingdom_stats.png" alt="Pingdom stats"></p>
<p>This was all good until and I was running happily on my new blog until I was checking <a href="https://feedly.com">Feedly</a>. First it claimed that I was no longer subscribed to my own blog, then when I added it, my number of subscribers had dropped from 300 to 9. WTF! I realized it's because my previous RSS was broken. I ended up setting up some 301 redirects using Apache. First of all, in <code>/feed/.htaccess</code></p>
<pre><code>RedirectMatch 301 /feed/(.*) http://erikbern.com/atom.xml
</code></pre><p>This will redirect <code>/feed/</code> to <code>atom.xml</code>. Then I moved <code>index.php</code> to <code>wordpress.php</code> and set this up in <code>/.htaccess</code>:</p>
<pre><code>RewriteEngine On
RewriteCond %{QUERY_STRING} feed=
RewriteRule (.*) /atom.xml? [R=301,L]
RewriteCond %{REQUEST_URI} ^/$
RewriteCond %{QUERY_STRING} p=
RewriteRule (.*) /wordpress.php [R=301,L]
</code></pre><p>The first pattern will redirect <code>/?feed=xyz</code> to <code>atom.xml</code>. The last one is for old links to my blog – it will do a double 301, from <code>/?p=841</code> to <code>/wordpress.php?p=841</code> to <code>/2014/11/29/deep-learning-for-chess/</code>.</p>
<p>I'm now up to 230 readers on Feedly – not sure wtf is going on but seems better than 9. Please resubscribe if you lost it!</p>
Iterate or die2016-03-02T00:00:00Zhttps://erikbern.com/2016/03/02/iterate-or-die.html<p>Here's a conclusion I've made building consumer products for many years: <strong>the speed at which a company innovates is limited by its iteration speed.</strong></p>
<p>I don't even mean throughput here. I just mean the cycle time. Invoking <a href="https://en.wikipedia.org/wiki/Little%27s_law">Little's law</a> this is also related to the <em>total inventory of features not being deployed yet</em>.</p>
<p>In a hypothetical scenario, clone two teams of identical engineers and split them up in two groups A and B. Actually, clone B another nine times so that they are 10x larger. Give them the exact same tools and the same problems to solve, but team B can only deploy code every 3 months whereas A deploys multiple times per day. I bet team A will outperform B in terms of delivering business value, even though they are 10 times smaller.</p>
<p>I don't have a proof for this, it's really just a grumpy coder speculating. The way I visualize it is applying <a href="https://en.wikipedia.org/wiki/Stochastic_gradient_descent">stochastic gradient descent</a> on a function that keeps on changing. If you used SGD, you know that sometimes a lower learning rate can help you converge faster, especially if you can evaluate the function a lot more often.</p>
<p><img src="https://erikbern.com/assets/2016/02/rosenbrock_animated.gif" alt="image"></p>
<p><strong>Iterate or die</strong></p>
<p>A large set of companies do not have iteration in its DNA. I'm particularly excited about this because I'm trying to compete in the banking space.</p>
<p>Let's consider how a big bank builds a new product. First, they would conduct customer research. Then, come up with a set of requirements. Then, make up a big ass GANTT chart and put 100s of engineers on it. 1-2 years after the project is started, they launch it, together with a huge spend on marketing. Under the year that has passed, <em>nothing has been learned that wasn't known from the start</em>. Every assumption that was made from scratch will take a year to validate.</p>
<p>It's like looking at a map and then trying to run through a forest for ten hours. Inevitably you are going to be very far from your target.</p>
<p>A modern day software shop is not a manufacturing plant. It probably resembles applied research a lot more. You can't plan research. You need to embrace uncertainty and iterate based on new information all the time. Forget about the six month plan you have.</p>
<p>Sometimes it's good to stop and look at the map. Your total speed is lower, but you can adjust your directions all the time.</p>
<p><img src="https://erikbern.com/assets/2015/10/giphy.gif" alt="image"></p>
<p>Apparently the army realized this and have invented a bunch of methods like <a href="http://www.army.gov.au/Our-future/LWSC/Our-publications/~/media/Files/Our%20future/LWSC%20Publications/AAJ/2013Autumn/Ferry_F3EA%20Targeting%20Paradigm.pdf">F3EA</a>: <em>Contemporary warfare challenges the practice of targeting and the philosophy of its purpose, promoting a <strong>shift from targeting for effect to targeting to learn</strong>.</em> It's interesting that the US army has learned this the hard way: a small group of insurgents changing tactics very quickly is a serious threat to the 10x larger American war machine.</p>
<p><strong>Building modern software</strong></p>
<p>What kind of things do you learn? There's a lot of schools here. Highly anecdotal qualitative can be great directional evidence. Once you get closer to the optimum, you need to shift to A/B tests. Some people preach that the product and tech team should do customer support. Other people think the CEO's job is to email the first 1000 customers. At my company, we spend a lot of time looking at user sessions in <a href="https://www.fullstory.com/">FullStory</a> and it's been a fantastic tool to see issues. I also talk to customers over our chat feature. Sometimes quantitative methods work, sometimes qualitative.</p>
<p>The other day a customer told me he ran into this bug and within an hour, I had deployed a fix. This is literally a 5000x faster iteration cycle than a big bank (5000 hours is a bit more than 6 months). It's the equivalent of walking through the forest, constantly checking the surroundings and making sure it matches the map. We might walk a bit slower (because our tech team is 10x smaller than most banks), but we learn new things at a much higher rate.</p>
<p><img src="https://erikbern.com/assets/2016/02/right_image_projectManagement.jpg" alt="image"><em>Seriously if I had more time I would start a Tumblr featuring people drawing horizontally flipped content on glass</em></p>
<p>I think most of failed IT projects can be traced back to this. It reminds me of <a href="http://yourstory.com/2014/09/webvan-e-tailer/">Webvan's epic failure</a>. Instead of iterating quickly and learning, the company embarked on a “scale at any cost” strategy. Or the <a href="http://computersweden.idg.se/2.2683/1.547944/haveriet-inifran--sa-gick-pust-fran-succ%E9-till-fiasko">new system for the Swedish police</a> (in Swedish) that had to be shut down after wasting $1B taxpayer money. Or the epic <a href="http://www.computerweekly.com/opinion/Six-reasons-why-the-NHS-National-Programme-for-IT-failed">IT project to reform the UK health records</a> that spend about £12B before shutting down.</p>
<p>What I'm saying isn't exactly <a href="https://en.wikipedia.org/wiki/Inter-universal_Teichm%C3%BCller_theory">inter-universal Teichmüller theory</a>, but interestingly even modern companies struggle with this. Spotify generally iterates pretty well but has had its fair share of big bang projects that would go on for a year without learning anything from real users. The product them would keep hypothesizing and develop an even more elaborate model for the bet.</p>
<p><strong>But Erik. What about Agile?</strong></p>
<p>A process where you deploy code at best every 3 weeks is really mini-waterfall. I like the basic tenets but I find that it encourages cargo cult behavior and distracts from the focus on the end result – creating a tight feedback loop and building a learning machine. Many companies use Agile as a way to deliver software often, but not as a way to learn quickly. If you're not constantly monitoring usage and adjusting your path then you are not learning.</p>
<p><strong>Why is my team moving slowly?</strong></p>
<p>One antipattern is to compensate lack of productivity with hiring. This is likely to get throughput up marginally, but cycle time down by a lot. I have seen companies with broken organization models, like having a “ML theory” team in NYC and an “ML implementation” team in another state. Good luck iterating quickly and learning fast. An organization has to be designed to minimize the information latency.</p>
<p>Another antipattern is to attribute project failure to lack of planning, and add even more planning. This 2005 article <a href="http://spectrum.ieee.org/computing/software/why-software-fails">Why software fails</a> is a great example of the wrong conclusion. The authors of the article should obviously have asked me – projects rarely fail because of bad planning – they fail because planning might have been futile in the first place. There's only so much you can prepare for.</p>
<p><img src="https://erikbern.com/assets/2016/02/malfunction.gif" alt="image"></p>
<p><strong>Erik? Why so many strong feelings?</strong></p>
<p>I think a lot about this because it's the only way my company can win. We're a bank and I'm pretty sure we are the only bank in the world that does continuous deployment, deploying code 20-30 times every day.</p>
<p>The word “paradigm” has an annoying ring to it, but actually think there is a new one of how to build a consumer product. Tech companies spent the last 10 years figuring out how to build a learning machine. If your company is based on scale advantages, that's great, but unless you learn how to iterate quickly, you're going to be dead.</p>
<p> </p>
My issue with GPU-accelerated deep learning2016-02-03T00:00:00Zhttps://erikbern.com/2016/02/03/my-issue-with-gpu-accelerated-deep-learning.html<p>I've been spending several hundred bucks renting GPU instances on AWS over the last year. The speedup from a GPU is awesome and hard to deny. GPUs have taken over the field. Maybe following the footsteps of Bitcoin mining there's some research on <a href="https://gigaom.com/2015/02/23/microsoft-is-building-fast-low-power-neural-networks-with-fpgas/">using FPGA</a> (I know very little about this).</p>
<p>I don't think there's a coincidence that GPUs that are built for graphics turn out to be great for image classification using convolutional neural networks. When you are dealing with pixel data packed into 2D arrays it's possible to parallelize all operations very efficiently.</p>
<p>My issue is that the complexity of each minibatch is $$ \mathcal{O}(n) $$ where $$ n $$ is the number of parameters. The larger models you are dealing with, the bigger this issue becomes.</p>
<p>Word2vec uses a clever technique called hierarchical softmax to achieve $$ \mathcal{O}(\log n) $$ (<a href="http://www-personal.umich.edu/~ronxin/pdf/w2vexp.pdf">more details here</a>). I have no idea how to implement this on a GPU and I suspect it's impossible. Here's where the CPU shows its strength – traversing a logarithmic datastructure takes a lot of branching and can't be expressed as a batch operation.</p>
<p>Logarithmic data structures happens to be a field I'm pretty excited about, particularly for vector models and multi-class prediction problems. I'm the author of <a href="https://github.com/spotify/annoy">Annoy</a>, which a library for high dimensional nearest neighbor queries, so it's something I've spent some time thinking about.</p>
<p>For collaborative filtering and natural language processing, GPU architectures are highly constraining. I suspect once you hit a billion parameters or so, more specialized networks that use logarithmic datastructures will outperform for NLP and CF. The speedup from the brute force GPU approach will be offset by the smarter datastructures that a CPU can handle. I haven't seen any research on this but seems to me like a huge opportunity. In particular, I would love to see hybrid architectures that can use a GPU for the “dense” networks and CPU for the “sparse” networks.</p>
Some more font links2016-01-25T00:00:00Zhttps://erikbern.com/2016/01/25/some-more-font-links.html<p>My blog post about fonts generated lots of traffic – it landed on Hacker News, took down my site while I was sleeping, and then obviously vanished from HN before I woke up. But it also got retweeted by a ton of people.</p>
<p>This clearly constitutes another proof of how effective animated gifs are. There's some stuff out there on the internet that I think is about 10x cooler than my blog post:</p>
<p><a href="http://blog.otoro.net/2015/12/28/recurrent-net-dreams-up-fake-chinese-characters-in-vector-format-with-tensorflow/">Recurrent Net Dreams Up Fake Chinese Characters in Vector Format with TensorFlow</a> – blog post from a few weeks ago, doing something similar but modeling the strokes of Chinese characters as vector paths.</p>
<p><img src="https://erikbern.com/assets/2016/01/CXTebdZUQAEMe01-300x188.png" alt="image"></p>
<p><a href="http://vecg.cs.ucl.ac.uk/Projects/projects_fonts/projects_fonts.html">Learning a Manifold of Fonts</a> – something I found the other day</p>
<p><img src="https://erikbern.com/assets/2016/01/Screen-Shot-2016-01-24-at-11.40.13-PM-300x189.png" alt="image"></p>
<p><a href="http://www.cs.toronto.edu/~graves/handwriting.html">Recurrent neural network handwriting generation demo</a> – very cool RNN approach, similar to the Chinese character experiment above.</p>
<p><img src="https://erikbern.com/assets/2016/01/handwritten-300x30.png" alt="image"></p>
<p>Some more <a href="http://www.genekogan.com/works/a-book-from-the-sky.html">Chinese characters generated using a neural network</a> – in this case it's a DCGAN (deep convolutional generative adversarial network) which is probably a better architecture than what I was using.</p>
<p><img src="https://erikbern.com/assets/2016/01/tumblr_o03o2hiSRm1qav3uso3_r1_500.gif" alt="image"></p>
<p><a href="http://iotic.com/averia/">Avería</a> – several people sent me this link about generating an “average” font</p>
<p><img src="https://erikbern.com/assets/2016/01/spec04-300x168.png" alt="image"></p>
Analyzing 50k fonts using deep neural networks2016-01-21T00:00:00Zhttps://erikbern.com/2016/01/21/analyzing-50k-fonts-using-deep-neural-networks.html<p>For some reason I decided one night I wanted to get a bunch of fonts. A lot of them. An hour later I had a bunch of <a href="http://scrapy.org/">scrapy</a> scripts pulling down fonts and a few days later I had more than 50k fonts on my computer.</p>
<p>I then decided to convert it to bitmaps. It turns out this is a bit trickier than it might seem like. You need to crop in such a way that each character of a font is vertically aligned, and scale everything to fit the bitmap. I started with 512 * 512 bitmaps of all character. For every font you find the max y and min y of the bounding box, and the same thing for each individual letter. After some more number juggling I was able to scale all characters down to 64 * 64.</p>
<p>The result is a tensor of size 56443 * 62 * 64 * 64. Exercise for the reader: where does the number 62 come from? I stored it as a tiny little (13GB) HDF5 file that you can download here: <a href="https://drive.google.com/file/d/0B0GtwTQ6IF9AU3NOdzFzUWZ0aDQ/view?usp=sharing&resourcekey=0-hJ4N66Y4_LeYPpnuLSvugw">fonts.hdf5.</a>.</p>
<p>If you take the average of all fonts, here's what you get:</p>
<p><img src="https://erikbern.com/assets/2016/01/avg.png" alt="image"></p>
<p>Hopefully by now it should be clear where the number 62 came from.</p>
<p>The median is a lot less blurry than the average:</p>
<p><img src="https://erikbern.com/assets/2016/01/median.png" alt="image"></p>
<p>Both mean and median are well-formed and legible! However individual fonts are all over the place:</p>
<p><img src="https://erikbern.com/assets/2016/01/alphabet.png" alt="image"></p>
<p>I guess I practically begged for it, stealing fonts from various sketchy places all over the web. In particular most of the fonts don't even have lower case versions of the letters. A minority of fonts miss certain characters and will just output rectangles instead. And look at the ridiculous Power Ranger figure for the lower case “c”!</p>
<p><strong>Training a neural network</strong></p>
<p>Now, let's train a neural network that generates characters! Specifically what I wanted to do is to create a “font vector” that is a vector in latent space that “defines” a certain font. That way we embed all fonts in a space where similar fonts have similar vectors.</p>
<p>I built a simple neural network using Lasagne/Theano – <a href="https://github.com/erikbern/deep-fonts/blob/master/model.py">check out the code here</a>. It took an insane amount of time to converge, probably because there's so much data and parameters. After <em>weeks</em> of running, the model converges to something that looks decent.</p>
<p>Some notes on the model</p>
<ul>
<li>4 hidden layers of fully connected layers of width 1024.</li>
<li>The final layer is a 4096 layer (64 * 64) with sigmoid nonlinearity so that the output is between 0 (white) and 1 (black).</li>
<li>L1 loss between predictions and target. This works much better than L2 which generates very “gray” images – you can see qualitatively in the pictures above.</li>
<li>Pretty strong L2 regularization of all parameters.</li>
<li>Leaky rectified units (alpha=0.01) of nonlinearity on each layer.</li>
<li>The first layer is 102D – each font is a 40D vector joined with a 62D binary one-hot vector of what is the character.</li>
<li>Learning rate is 1.0 which is shockingly high – seemed to work well. Decrease by 3x when no improvements on the 10% test set is achieved in any epoch.</li>
<li>Minibatch size is 512 – seemed like larger minibatches gave faster convergence for some weird reason.</li>
<li>No dropout, didn't seem to help. I did add some moderate Gaussian noise (of sigma 0.03) to the font vector and qualitatively it seemed to help a bit.</li>
<li>Very simple data augmentation by blurring the input randomly with sigma sampled from [0, 1]. My theory was that this would help fitting characters that have thin lines.</li>
</ul>
<p>All of the code is available in the <a href="https://github.com/erikbern/deep-fonts">erikbern/deep-fonts</a> repo on Github.</p>
<p>After convergence, we end up having a nice 40D embedding of all 50k fonts. Looks like it ends up being roughly a multivariate normal – here's the distribution of each of the 40 dimensions:</p>
<p><img src="https://erikbern.com/assets/2016/01/pairplot_cropped.png" alt="image"></p>
<p> </p>
<p><strong>Playing around with the model</strong></p>
<p>To start with, let's recreate real font characters with characters generated from the network. Let's plot the real character together with the model outputs. For each pair below, the real character is on the left, the model output on the right.</p>
<p><img src="https://erikbern.com/assets/2016/01/real_vs_pred.png" alt="image"></p>
<p>These are all characters drawn from the <em>test set</em>, so the network hasn't seen any of them during training. All we're telling the network is (a) what font it is (b) what character it is. The model has seen other characters of the same font during training, so what it does is to infer from those training examples to the unseen test examples.</p>
<p>The network does a decent job at most of the characters, but gives up on some of the more difficult ones. For instance, characters with thin black lines are very hard to predict for the model, since if it renders the line just a few pixel to the side, that's twice the loss of just rendering whitespace.</p>
<p>We can also interpolate between different fonts in continuous space. Since every font is a vector, we can create arbitrary font vectors and generate output from it. Let's sample four fonts and put them in the corners of a square, then interpolate between them!</p>
<p><img src="https://erikbern.com/assets/2016/01/grid2.png" alt="image"></p>
<p>Certain characters have multiple forms that we can interpolate between, eg. lowercase <em>g:</em></p>
<p><img src="https://erikbern.com/assets/2016/01/grid3.png" alt="image"></p>
<p>We can also pick a font vector and generate new fonts from random perturbations:</p>
<p><img src="https://erikbern.com/assets/2016/01/noisy_font_2.gif" alt="image"></p>
<p>(btw internet god – please forgive me for wasting bandwidth on all the animated gifs in this blog post!)</p>
<p>We can also generate completely new fonts. If we model the distribution of font vectors as a multivariate normal, we can sample random vectors from it and look at the fonts they generate. I'm interpolating between a few of those vectors in the picture below:</p>
<p><img src="https://erikbern.com/assets/animated_font.gif" alt="image"></p>
<p>An interesting thing here is that the model has learned that many fonts use upper case characters for the lower case range – the network interpolates between Q and q seamlessly. Here's an example of the network interpolating very slowly between two fonts where this is the main difference:</p>
<p><img src="https://erikbern.com/assets/font_pair.gif" alt="image"></p>
<p>Another cool thing we can do since we have all fonts in a continuous space is to run t-SNE on them and embed all fonts into the 2D plane. Here's a small excerpt of such an embedding:</p>
<p><img src="https://erikbern.com/assets/tsne_cropped.png" alt="image"></p>
<p><strong>Final remarks</strong></p>
<p>There are many other fun things you can do. It's clear that there's some room for improvement here. In particular, if I had more time, I would definitely explore generative adversarial models, which seems better at generating pictures. Another few things should be relatively easy to implement, such as batch normalization and parametric leaky rectifications. And finally the network architecture itself could probably benefit from doing deconvolutions instead of fully connected layers</p>
<p>Feel free to <a href="https://drive.google.com/file/d/0B0GtwTQ6IF9AU3NOdzFzUWZ0aDQ/view?usp=sharing&resourcekey=0-hJ4N66Y4_LeYPpnuLSvugw">download the data</a> and play around with it if you're interested!</p>
I believe in the 10x engineer, but...2016-01-08T00:00:00Zhttps://erikbern.com/2016/01/08/i-believe-in-the-10x-engineer-but.html<ul>
<li>The easiest way to be a 10x engineer is to make 10 other engineers 2x more efficient. Someone can be a 10x engineer if they do nothing for 364 days then convinces the team to change programming language to a 2x more productive language.</li>
<li>A motivated 10x engineer in one team could be a demotivated 0.5x engineer in another team (and vice versa).</li>
<li>A average 1x engineer could easily become a 5x engineer if surrounded by 10x engineers. Engagement and work ethics is contagious.</li>
<li>The cynical reason why 10x engineers aren't paid 10x more salary is that there is no way for the new employer to know. There is no “10x badge”.</li>
<li>…but also, a 10x engineer can go to a new company and become an 1x engineer because of bad focus / bad engagement / tech stack mismatch.</li>
<li>So unfortunately there's less economic rationality for companies to pay 10x salaries to 10x engineers (contrary to what <a href="http://www.businessinsider.com/google-policy-to-pay-unfairly-2015-4">Google</a> or <a href="http://www.slideshare.net/reed2001/culture-1798664/98-Takes_Great_Judgment_Goal_is">Netflix</a> says)</li>
<li>There's no such thing as a 10x engineer spending time on something that never ends up delivering business value. If something doesn't deliver business value, it's 0x.</li>
<li>If you build something that the average engineer <em>would not have been able to build, no matter how much time</em>, that can make you 100x or 1000x, or ∞x. <a href="http://slatestarcodex.com/2015/12/27/things-that-are-not-superintelligences/">Quoting Alexander Scott</a>: <em>There is no number of ordinary eight-year-olds who, when organized into a team, will become smart enough to beat a grandmaster in chess<a href="http://slatestarcodex.com/2015/12/27/things-that-are-not-superintelligences/">.</a></em></li>
<li>Most of the 10x factor is most likely explained by team and company factors (process, tech stack, etc) and applies to everyone in the team/company. Intra-team variation is thus much smaller than 10x (even controlling for the fact that companies tend to attract people of equal caliber). Nature vs nurture…</li>
<li>I've never met the legendary “10x jerk”. Anecdotally the outperforming engineers are generally nice and humble.</li>
<li>Don't get hung up on the exact numbers here, it's just for illustration purposes. I.e. someone introduced a <a href="http://pythonsweetness.tumblr.com/post/64740079543/how-to-lose-172222-a-second-for-45-minutes">bug in the trading system</a> of Knight Capital that made them lose $465M in 30 minutes. Did that make it a -1,000,000x engineer? (and btw it had more to do with company culture). The numbers aren't meant to be taken literally.</li>
</ul>
<p><img src="https://erikbern.com/assets/2016/01/business_meeting_3-1024x440.jpg" alt="image"></p>
<p><em>I got a unique photo opportunity of this small group of 10x engineers until they suddenly vanished. All I managed to hear was “Merkle trees” and “Kappa architecture”. What are the meanings of those expressions? We will never know.</em></p>
Books I read in 20152016-01-01T00:00:00Zhttps://erikbern.com/2016/01/01/books-i-read-in-2015.html<p>Early last year when I left Spotify I decided to do more reading. I was planning to read at least one book per week and in particular I wanted to brush up on management, economics, and technology. 2015 was also a year of exclusively non-fiction, which is a pretty drastic shift, since I grew up reading fiction compulsively for 20 years.</p>
<p>My goal for 2015 failed – I ended up reading about 40 books last year. Here is a small selection of the best ones. Not all of it was published in 2015.</p>
<p><img src="https://erikbern.com/assets/2016/01/Zero-to-One-Notes-on-Startups-or-How-to-Build-the-Future-Peter-Thiel-Small-Business-205x300.jpg" alt="image"></p>
<p><img src="https://erikbern.com/assets/2016/01/Hard-Thing-cover-199x300.jpg" alt="image"></p>
<p><strong>Ben Horowitz – The Hard Thing about Hard Things</strong></p>
<p><strong>Peter Thiel – Zero to One</strong></p>
<p>Both books are highly entertaining. Ben Horowitz has a very narrative style and takes the reader through the ups and down of Opsware. Peter Thiel tries to provoke and goes on with long rants on how to position yourself. He stays true to his character – a nihilist libertarian who knows something about the future mere mortals do not. I like to think of the book as a set of mental models or factors that are all very important but maybe not as crucial as Thiel wants it to be. Ben in contrast stays close to earth and discusses his approach to management. It's more like an HBR case study, except a lot more interesting and fun.</p>
<p><img src="https://erikbern.com/assets/2016/01/SUPERFORECASTING-194x300.jpg" alt="image"></p>
<p><img src="https://erikbern.com/assets/2016/01/future-babble-196x300.jpg" alt="image"></p>
<p><strong>Philip Tetlock and Dan Gardner – Superforecasting</strong></p>
<p><strong>Dan Gardner – Future Babble</strong></p>
<p>I have a soft spot for cognitive biases, predictions, and making things quantitative. Both build heavy on the classic Expert Political Judgement by Philip Tetlock himself. Future Babble is by Dan Gardner, whereas Superforecasting is by the two of them together.</p>
<p>The books are about predictions but apply to any decision making with limited information. The fascinating TL;DR is that most people can become better decision makers by incorporating multiple factors and viewpoints, constantly calibrating their decisions, and stay away from single “big idea” explanations. If I had to pick one of these, read Superforecasting.</p>
<p><strong><img src="https://erikbern.com/assets/2016/01/lean-in_custom-575cb1cc7e2e0e704abfffbc2a0ce498dafad0f8-s6-c30-182x300.jpg" alt="image">Sheryl Sandberg – Lean in</strong></p>
<p>You could read this book from several perspectives, each useful. The intended perspective is if you're a woman and want to make it in business. I'm not a woman but there's at least two other perspectives of the book that both make it a worthwhile read. Most of the book to is really a great guide on how to make it in business in America. Being from another culture (growing up with a humble Scandinavian mindset) I found that it generalized quite well from the original target audience. The other reason to read it as a man is that it describes the double standards and the uphill struggles of women in business. Everyone's biased, it's just a difference whether they deny it or admit it. If you're managing people, I think it's your duty to be aware of your biases and how other people's biases affect women. Either perspective you choose, this book is an easy read, and worth spending a few hours on.</p>
<p><strong><img src="https://erikbern.com/assets/2016/01/high-output-mgmt-195x300.jpg" alt="image"> <img src="https://erikbern.com/assets/2016/01/team-of-teams-199x300.jpg" alt="image">Andy Grove – High Output Management</strong></p>
<p><strong>Stanley McChrystal – Team of Teams</strong></p>
<p>These books aren't very similar but in one way they represent the opposite sides of how to manage efficiently. Stanley McChrystal spends a lot of time discussing the <a href="https://en.wikipedia.org/wiki/Frederick_Winslow_Taylor#Work">Taylor approach</a> to management and how it breaks down in wars, especially fighting insurgents. Say what you want about the military, but it represents the ultimate management under uncertainty. Interestingly Superforecasting borrows a chapter out of this book, spending a lot of time on Taylor and modern warfare, starting with <a href="https://en.wikipedia.org/wiki/Helmuth_von_Moltke_the_Elder#Moltke.27s_theory_of_war">van Moltke</a>.</p>
<p>I think of management as a series of steps building on each other, ranging from maximum certainty (we know what we want to build and how to get there) to total uncertainty (we don't know what to build and have no idea how to find out). On that ladder, High Output Management is a great introduction to the lower levels, and Team of Teams a series of essays on what breaks down at the higher levels. None of the books is exhaustive, but definitely worth reading if you are a manager or interested in management.</p>
<p><strong>Jessica Livingston – Founders at Work</strong></p>
<p>Jessica Livingston (of YCombinator) interviews a set of founders. It's a bit dated (2007) but still a great set of stories of what built a bunch of companies.</p>
<p class="p1">
<strong>David Ogilvy – Ogilvy on advertising</strong>
</p>
<p class="p1">
This books roughly comes off as Peter Thiel talking about advertising. Highly opinionated with lots of concrete advice for how to do advertising well. The book is severely dated – It's from 1983, but really talks more of the Mad Men era of 1960's. I still find it somewhat relevant, but more importantly it's an easy fun read.
</p>More MCMC – Analyzing a small dataset with 1-5 ratings2015-12-05T00:00:00Zhttps://erikbern.com/2015/12/05/more-mcmc-analyzing-a-small-dataset-with-1-5-ratings.html<p>I've been obsessed with how to iterate quickly based on small scale feedback lately. One awesome website I encountered is <a href="https://usabilityhub.com">Usability Hub</a> which lets you run 5 second tests. Users see your site for 5 seconds and you can ask them free-form questions afterwards. The nice thing is you don't even have to build the site – just upload a static png/jpg and collect data.</p>
<p>We are redesigning our website, so I ran a bunch of experiments where I asked users how trustworthy they think the website looks like, on a scale from 1 to 5. So let's say you do that for several variants. How do you estimate the uncertainty of the average score?</p>
<p>You could compute the mean and the variance and use that to estimate. But let's pause for a second. We know this distribution is <em>not</em> a normal distribution because it's constrained to integers between 1 and 5.</p>
<p>Instead, let's use a <a href="https://en.wikipedia.org/wiki/Multinomial_distribution">multinomial distribution</a> for the distributions of the five possible ratings. Furthermore let's say prior distribution is a <a href="https://en.wikipedia.org/wiki/Dirichlet_distribution">Dirichlet distribution</a>. Now let's compute the weighted average using the posterior of the that distribution. Much cooler!</p>
<p>I also discovered <a href="https://pymc-devs.github.io/pymc3/">PyMC3</a> and <a href="http://stanford.edu/~mwaskom/software/seaborn/">Seaborn</a> which turns out to be two pretty cool tools. Relevant code:</p>
<div class="oembed-gist">
<noscript>
View the code on <a href="https://gist.github.com/erikbern/6a79c41384b217ddc097">Gist</a>.
</noscript>
</div>
<p>Output:</p>
<p><img src="https://erikbern.com/assets/2015/12/ratings_mcmc.png" alt="image">Beautiful stuff! But how does it compare to the normal approximation? I'm glad you asked! Here are both on the same plot:</p>
<p><img src="https://erikbern.com/assets/2015/12/ratings_mcmc1.png" alt="image"></p>
<p>You can see that there <em>is</em> a substantial difference. This is caused by two things: (a) our sample is not drawn from a normal distribution (b) the sample size is small.</p>
<p>For large sample sizes, the average of non-normal distributions converges to have a normal distribution (this is the <a href="https://en.wikipedia.org/wiki/Central_limit_theorem">Central limit theorem</a>), but our sample size is very small (only 50 ratings in each set).</p>
<p>Dealing with these small dataset reminds me of the discussion between Karl Pearson and William Sealy Gossett (aka <em>Student</em>). Gossett, working for the Guinness factory in Dublin, developed a lot of modern statistics working with beer samples, in particular with small batch sizes. Talking to Pearson about this, Pearson remarked that <em>Only naughty brewers deal in small samples!</em> The t-test (of Gossett) is a great example of something coming out of necessity of working with small samples sizes. For larger samples, normal approximations work out very well.</p>
<p>Side note: I found <a href="http://andrewgelman.com/2009/04/29/conjugate_prior/">a discussion by Andrew Gelman</a> suggesting modeling this as a softmax instead – another option worth trying if you're interested)</p>
There is no magic trick2015-11-28T00:00:00Zhttps://erikbern.com/2015/11/28/there-is-no-magic-trick.html<p>(Warning: super speculative, feel free to ignore)</p>
<p>As Yogi Berra said, “It's tough to make predictions, especially about the future”. Unfortunately predicting is hard, and unsurprisingly people look for the Magic Trick™ that can resolve all the uncertainty. Whether it's recruiting, investing, system design, finding your soulmate, or anything else, there's always an alleged shortcut.</p>
<p>In the famous book <a href="http://www.amazon.com/Expert-Political-Judgment-Good-Know/dp/0691128715">Expert Political Judgment</a> a huge amount of forecasts about the future are tracked over a long time. The conclusion is: people suck at forecasting. The only characteristic that seems somewhat predictive is what the author calls being a <em>hedgehog</em> vs being a <em>fox</em>. Hedgehogs (bad) are people who have one mental model they apply to anything. Foxes (good) apply a huge amount of different model and combine them to arrive at a conclusion. (Confusingly, hedgehogs do not <em>hedge</em> their bets).</p>
<p>This is a quite profound conclusion that goes beyond prediction. In fact I see it in almost any hard decision I have to make.</p>
<p>Let's think about recruiting, for instance. So many people claim to have found the ultimate interview question. It ranges from “how old were you when you started coding?” to “what are your open source contributions” to “please spend ten hours on this take home assignment”.</p>
<p>After probably 500 tech interviews I've realized one thing: there is no trick. Empirically the correlation between who I <em>thought would be good</em> and who actually <em>turned out to be good</em> is very small. The <a href="https://en.wikipedia.org/wiki/Overconfidence_effect">overconfidence effect</a> definitely is a real thing and I've become more skeptical about my abilities. The one thing I've learned is: <em>try to collect as many independent metrics</em> as you can. The other day I actually came across an <a href="http://lab4.psico.unimib.it/nettuno/forum/free_download/articolo_114.pdf">old paper</a> saying something similar.</p>
<p>The same thing applies to investing. You might follow Peter Thiel's advice and <a href="http://www.businessinsider.com/peter-thiel-ama-2014-9">never invest</a> in companies where they wear suits. Or you might have an extremely strong conviction that self-driving cars will take over so you go out and short GM's stock. But remember you're up against professional portfolio managers who stare at their screens for 14 hours per day. Did they miss something you are seeing? No. They know that what you are seeing is a small fraction of their valuation of a company.</p>
<p><img src="https://erikbern.com/assets/2015/11/giphy-1.gif" alt="image"></p>
<p>What makes it even worse is both investing and recruiting are activities that takes place in a <em>market.</em> You are fighting with n other actors to find mispricings and arbitrage opportunity. Just like buying stocks based on a single model is bad, recruiting based on a single model will give you bad candidates. What happens is basically <a href="https://en.wikipedia.org/wiki/Adverse_selection">adverse selection</a> and it will cause you to overpay for underperformance.</p>
<p>See below for a very silly market model where two companies X (blue) and Y (red) bid on employees but X knows <em>something</em> that Y doesn't know. I model that by assuming employees break down into a set of random factors and X know a few more factors than Y know. Click the graph to see the code.</p>
<p><img src="https://erikbern.com/assets/2015/11/there_is_no_trick4.png" alt="image"></p>
<p>It's better to be further to the left (lower cost) and higher up (more value) for a company.</p>
<p>It's a bit hard to see from the model but what happens is the total total surplus (<em>value – cost</em>) for company X is some positive number and for Y it's approximately zero. This holds true any time company X knows <em>just a bit more</em> about employees than company Y. Warren Buffet once said: “If you've been playing poker for half an hour and you still don't know who the patsy is, you're the patsy.”</p>
<p>Speaking of models, one of the most useful insights from machine learning is how much value you get from combining many models. This has been the central dogma in the machine learning community for a long time, whether it's <a href="http://blog.kaggle.com/category/dojo/">Kaggle</a>, or the <a href="http://www.netflixprize.com/assets/GrandPrize2009_BPC_BellKor.pdf">Netflix Prize</a>, or <a href="http://www.slideshare.net/xamat/10-more-lessons-learned-from-building-machine-learning-systems">industry applications</a>. All models are wrong, but <a href="https://en.wikiquote.org/wiki/George_E._P._Box">some are useful</a> – combining a bunch of those models will always outperform.</p>
<p>I think the best meta-model for how to think of any complex systems, whether it's recruiting or investing or anything else, is something like <a href="https://en.wikipedia.org/wiki/Boosting_(machine_learning)">boosting</a>. You start with nothing, then you find the best model that explains what you see. Then you increase the weight of the misclassified examples and fit another model (<em>weak learner</em>, in boosting lingo). And so on. Eventually you have built up a set of simple models that you can combine for a final prediction. (As a side note I think the reason humans can do this so well is they can use priors very efficiently)</p>
<p>Peter Thiel's advice is a set of models that are wrong, but still marginally useful, so why not include them? Does a company have network effect? Sure, marginally helpful. Does a candidate <a href="http://www.businessinsider.com/peter-thiel-ama-2014-9">have an MBA</a>? Etc. These all sound like weak learners to me. Using just one of them is pretty bad. Add up 100 of them and you have a pretty good prediction.</p>
<p> </p>
Installing TensorFlow on AWS2015-11-12T00:00:00Zhttps://erikbern.com/2015/11/12/installing-tensorflow-on-aws.html<p>Curious about Google's newly released <a href="https://tensorflow.org">TensorFlow</a>? I don't have a beefy GPU machine, so I spent some time getting it to run on EC2. The <a href="https://gist.github.com/erikbern/78ba519b97b440e10640">steps on how to reproduce</a> it are pretty brutal and I wouldn't recommend going through it unless you want to waste five hours of your live.</p>
<p>Instead, I recommend instead just <a href="https://console.aws.amazon.com/ec2/v2/home?region=us-east-1#LaunchInstanceWizard:ami=ami-cf5028a5">getting the AMI that I built</a> (ami-cf5028a5). Choose g2.2xlarge and you should have a box with TensorFlow running in a minute or two! Note that it's only available in us-east-1 (virginia) so far.</p>
<p>If you haven't used AWS, here's a <a href="https://www.kaggle.com/c/facial-keypoints-detection/details/deep-learning-tutorial">tutorial</a> on how to set up an instance from an AMI. I usually use spot instances since they are <em>much</em> cheaper, but they have some risk of getting killed unexpectedly (interestingly it seems more rare now, I wonder if it's since the Bitcoin price is so much lower).</p>
<p>There are some known issues with TensorFlow on AWS. In particular I wasn't able to get better performance from g2.8xlarge compared to g2.2xlarge, which sucks, since one of the cool features with TensorFlow is that it should distribute work across GPU's. See <a href="https://github.com/tensorflow/tensorflow/issues/25">this thread</a> for some more info. Looking forward to see these issues getting resolved.</p>
<p><strong>What is TensorFlow?</strong></p>
<p>It seems like there's a lot of misunderstanding about TensorFlow. It's not some crazy flow based graphical tool to do neural nets. It's kind of boring really. It's just a marginally better version of <a href="http://www.deeplearning.net/software/theano/">Theano</a> with much faster compilation times and capability to distribute work over multiple GPU's/machines. Theano completely blew my mind when I first discovered it. Its approach was super innovative, but it's pretty rough around the edges and I think in open source the pioneers die with arrows in their backs.</p>
<p>I expect TensorFlow (or maybe <a href="http://rll.berkeley.edu/cgt/">CGT</a> or something else) to grow more popular. But in practice I don't think people will use any of those straight up for machine learning – higher level libraries like <a href="https://keras.io">Keras</a> will be the preferred way to do most deep learning tasks.</p>
Looking for smart people2015-11-04T00:00:00Zhttps://erikbern.com/2015/11/04/looking-for-smart-people.html<p>I haven't mentioned what I'm currently up to. Earlier this year I left Spotify to join a small startup called <a href="https://better.com/">Better</a>. We're going after one of the biggest industries in the world that also turns out to be completely broken. The mortgage industry might not be the #1 industry you pictured yourself in, but it's an enormous opportunity to fix a series of real consumer problems and join a company that I predict will be huge.</p>
<p><img src="https://erikbern.com/assets/2015/10/Wl6dJCp.gif" alt="image"></p>
<p>We're 6 engineers at the moment, mostly focused on backend stuff, but a bit of frontend and machine learning stuff as well. We have also raised a pretty substantial amount of money. At this point we're just a few weeks from launching, so I will definitely keep you posted. If you are interested in hearing more, drop me an email at <a href="mailto:erik@better.com">erik@better.com</a></p>
MCMC for marketing data2015-10-31T00:00:00Zhttps://erikbern.com/2015/10/31/mcmc-for-marketing-data.html<p>The other day I was looking at marketing spend broken down by channel and wanted to compute some simple uncertainty estimates. I have data like this:</p>
<table>
<tr>
<th>
</th>
<pre><code><th>
Total spend
</th>
<th>
Transactions
</th>
</code></pre>
</tr>
<tr>
<th>
Channel A
</th>
<pre><code><td>
2292.04
</td>
<td>
9
</td>
</code></pre>
</tr>
<tr>
<th>
Channel B
</th>
<pre><code><td>
1276.85
</td>
<td>
2
</td>
</code></pre>
</tr>
<tr>
<th>
Channel C
</th>
<pre><code><td>
139.59
</td>
<td>
3
</td>
</code></pre>
</tr>
<tr>
<th>
Channel D
</th>
<pre><code><td>
954.98
</td>
<td>
5
</td>
</code></pre>
</tr>
</table>
<p>Of course, it's easy to compute the cost per transaction, but how do you produce uncertainty estimates? Turns out to be somewhat nontrivial. I don't even think it's possible to do a <a href="https://en.wikipedia.org/wiki/Student%27s_t-test">t-test</a>, which is kind of interesting in itself.</p>
<p>Let's make some assumptions about the model:</p>
<ol>
<li>The cost per transaction is an unknown with some prior (I just picked uniform)</li>
<li>The expected number of transaction is the total budget divided by the (unknown) cost per transaction</li>
<li>The actual observed number of transactions is a <a href="https://en.wikipedia.org/wiki/Poisson_distribution">Poisson</a> of the expected number of transactions</li>
</ol>
<p>I always wanted to try using <a href="https://pymc-devs.github.io/pymc/">pymc</a> and now I had an excuse. See <a href="https://gist.github.com/erikbern/65660dc8aa5df99b5f84">gist</a> below:</p>
<div class="oembed-gist">
<noscript>
View the code on <a href="https://gist.github.com/erikbern/65660dc8aa5df99b5f84">Gist</a>.
</noscript>
</div>
<p>The result in the form of an animated GIF (Unfortunately animated gifs were never widely accepted as a homework format back in school)</p>
<p><img src="https://erikbern.com/assets/2015/10/marketing_mc2.gif" alt="image"></p>
<p>You even get a useless graph for free!</p>
<p><img src="https://erikbern.com/assets/2015/10/graph.png" alt="image"></p>
<p>Of course, we could have computed this exactly, but I know myself and I'm very unlikely to get the expressions right without some serious effort. The conjugate prior of a Poisson is a <a href="https://en.wikipedia.org/wiki/Gamma_distribution">Gamma distribution</a> and we have to account for the parameterization of the cost per conversion as the budget divided by the total conversions, which will be another factor. How fun is that? I don't have access to any windows to write on, so unfortunately not so fun.</p>
<p><img src="https://erikbern.com/assets/2015/10/fc96a0834fad9bb68b00fc864f444e.jpg" alt="image"></p>
<p><em>From A Beautiful Mind</em></p>
<p>Anyway – this particular example might not have been the most useful example of using PyMC, but I do quite like the idea of it. Especially applied to conversion analyses, since it translates directly into a generative model. I will definitely use it for some further funnel analysis – in particular when the number of data points is very small and the model is very complex.</p>
Interview with a Data Scientist: Erik Bernhardsson2015-10-28T00:00:00Zhttps://erikbern.com/2015/10/28/interview-with-a-data-scientist-erik-bernhardsson.html<p><em><a href="https://peadarcoyle.wordpress.com/2015/10/03/interview-with-a-data-scientist-erik-bernhardsson/">I was featured</a> in Peadar Coyle's <a href="https://peadarcoyle.wordpress.com">interview series</a> interviewing various “data scientists” – which is kind of arguable since (a) all the other ppl in that series are much cooler than me (b) I'm not really a data scientist. Anyway, reposting the full interview:</em></p>
<p>As part of my interviews with Data Scientists I recently caught up with Erik Bernhardsson who is famous in the world of ‘Big Data’ for his open source contributions, his leading of teams at Spotify, and his various talks at various conferences.</p>
<p><strong>1. What project have you worked on do you wish you could go back to, and do better?</strong></p>
<p>Like… everything I ever built. But I think that’s part of the learning experience. Especially working with real users, you never know what’s going to happen. There’s no clear problem formulation, no clear loss function, lots of various data sets to use. Of course you’re going to waste too much time doing something that turns out to nothing. But research is that way. Learning stuff is what matters and kind of by definition you have to do stupid shit before you learned it. Sorry for a super unclear answer :)</p>
<p>The main thing I did wrong for many years was I built all this cool stuff but never really made it into prototypes that other people could play around with. So I learned something very useful about communication and promoting your ideas.</p>
<p><strong>2. What advice do you have to younger analytics professionals and in particular PhD students in the Sciences?</strong></p>
<p>Write a ton of code. Don’t watch TV :)</p>
<p>I really think showcasing cool stuff on Github and helping out other projects is a great way to learn and also to demonstrate market validation of your code.</p>
<p>Seriously, I think everyone can kick ass at almost anything as long as you spend a ridiculous amount of time on it. As long as you’re motivated by something, use that by focusing on something 80% of your time being awake.</p>
<p>I think people generally get motivated by coming up with various proxies for success. So be very careful about choosing the right proxies. I think people in academia often validate themselves in terms of things people in the industry don’t care about and things that doesn’t necessarily correlate with a successful career. It’s easy to fall down into a rabbit hole and become extremely good at say deep learning (or anything), but at a company that means you’re just some expert that will have a hard time getting impact beyond your field. Looking back on my own situation I should have spent a lot more time figuring out how to get other people excited about my ideas instead of perfecting ML algorithms (maybe similar to last question)</p>
<p><strong>3. What do you wish you knew earlier about being a data scientist?</strong></p>
<p>I don’t consider myself a data scientist so not sure :)</p>
<p>There’s a lot of definitions floating around about what a data scientist does. I have had this theory for a long time but just ran into <a href="https://medium.com/@rchang/my-two-year-journey-as-a-data-scientist-at-twitter-f0c13298aee6">a blog post</a> the other day. I think it summarizes my own impression pretty well. There’s two camps, one is the “business insights” side, one is the “production ML engineer” side. I managed teams at Spotify on both sides. It’s very different.</p>
<p>If you want to understand the business and generate actionable insights, then in my experience you need pretty much no knowledge of statistics and machine learning. It seems like people think with ML you can generate these super interesting insights about a business but in my experience it’s very rare. Sometimes we had people coming in writing a master’s thesis about churn prediction and you can get a really high AUC but it’s almost impossible to use that model for anything. So it really just boils down to doing lots of highly informed A/B tests. And above all, having deep empathy for user behavior. What I mean is you really need to understand how your users think in order to generate hypotheses to test.</p>
<p>For the other camp, in my experience understanding backend development is super important. I’ve seen companies where there’s a “ML research team” and a “implementation team” and there’s a “throw it over the fence” attitude, but it doesn’t work. Iteration cycles get 100x larger and incentives just get misaligned. So I think for anyone who wants to build cool ML algos, they should also learn backend and data engineering.</p>
<p><strong>4. How do you respond when you hear the phrase ‘big data’?</strong></p>
<p>Love it. Seriously, there’s this weird anti-trend of people bashing big data. I throw up every time I see another tweet like “You can get a machine with 1TB of ram for $xyz. You don’t have big data”. I almost definitely had big data at Spotify. We trained models with 10B parameters on 10TB data sets all the time. There is a lot of those problems in the industry for sure. Unfortunately sampling doesn’t always work.</p>
<p>The other thing I think those people get wrong is the production aspect of it. Things like Hadoop forces your computation into fungible units that means you don’t have to worry about computers breaking down. It might be 10x slower than if you had specialized hardware, but that’s fine because you can have 100 teams running 10000 daily jobs and things rarely crash – especially if you use Luigi :) But I’m sure there’s a fair amount of snake oil Hadoop consultants who convince innocent teams they need it.</p>
<p>The other part of “big data” is that it’s at the far right of the hype cycle. Have you been to a Hadoop conference? It’s full of people in oversized suits talking about compliance now. At some point we’ll see deep learning or flux architecture or whatever going down the same route.</p>
<p><strong>5. What is the most exciting thing about your field?</strong></p>
<p>Boring answer but I do think the progress in deep learning has been extremely exciting. Seems like every week there’s new cool applications.</p>
<p>I think even more useful is how tools and platforms are maturing. A few years ago every company wrote their own dashboards, A/B test infrastructure, log synchronization, workflow management, etc. It’s great that there’s more open source projects and that more useful tools are emerging.</p>
<p><strong>6. How do you go about framing a data problem – in particular, how do you avoid spending too long, how do you manage expectations etc. How do you know what is good enough?</strong></p>
<p>Ideally you can iterate on it with real users and see what the impact is. If not, you need to introduce some proxy metrics. That’s a whole art form in itself.</p>
<p>It’s good enough when the opportunity cost outweighs the benefit :) I.e. the marginal return of time invested is lower than for something else. I think it’s good to keep a backlog full of 100s of ideas so that you can prioritize based on expected ROI at any time. I don’t know if that’s a helpful answer but prioritization is probably the hardest problem to solve and it really just boils down to having some rules of thumb.</p>
<p><em>How Erik describes himself: I like to work with smart people and deliver great software. After 5+ years at Spotify, I just left for new exciting startup in NYC where I am leading the engineering team.</em></p>
<p><em>At Spotify, I built up and lead the team responsible for music recommendations and machine learning. We designed and built many large scale machine learning algorithms we use to power the recommendation features: the radio feature, the “Discover” page, “Related Artists”, and much more. I also authored Luigi, which is a workflow manager in Python with 3,000+ stars on Github – used by Foursquare, Quora, Stripe, Asana, etc.</em></p>
<p><em>When I was younger I participated in lots of programming competitions. My team was five times Nordic champions in programming (2003-2010) and I have an IOI gold medal (2003).</em></p>
Nearest neighbors and vector models – epilogue – curse of dimensionality2015-10-20T00:00:00Zhttps://erikbern.com/2015/10/20/nearest-neighbors-and-vector-models-epilogue-curse-of-dimensionality.html<p>This is another post based on my talk at <a href="http://www.meetup.com/NYC-Machine-Learning/events/225265016/">NYC Machine Learning</a>. The previous two parts covered most of the interesting parts, but there are still some topics left to be discussed. To go back and read the meaty stuff, check out</p>
<ul>
<li>Part 1: <a href="/2015/09/24/nearest-neighbor-methods-vector-models-part-1/">What are vector models useful for?</a></li>
<li>Part 2: <a href="/2015/10/01/nearest-neighbors-and-vector-models-part-2-how-to-search-in-high-dimensional-spaces/">How to search in high dimensional spaces – algorithms and data structures</a></li>
</ul>
<p>You should also check out <a href="http://www.slideshare.net/erikbern/approximate-nearest-neighbor-methods-and-vector-models-nyc-ml-meetup">the slides</a> and <a href="https://www.youtube.com/watch?v=QkCCyLW0ehU">the video</a> if you're interested. Anyway, let's talk about the curse of dimensionality today.</p>
<p><img src="https://erikbern.com/assets/2015/10/curse-of-dimensionality.png" alt="image"><em>This pic was obviously worth spending 20 minutes on</em></p>
<p> </p>
<p><strong>Curse of dimensionality</strong> refers to a set of things that happen when you are dealing with items in high dimensional spaces, in particular what happens with distances and neighborhoods, in such a way that finding the nearest neighbors gets tricky.</p>
<p>Consider a map of the world. Most countries have a handful of neighboring countries. It is also pretty close from New York to Philadelphia but it's far from New York to Beijing – distances are very different.</p>
<p>What happens when we go to higher dimensions is that <em>everything starts being close to everything.</em> All cities end up having almost the same distance to each other and all countries have borders to all other countries (Trump would have a lot of walls to build). This is highly nonintuitive (as is anything with more than 3 dimensions) but let's try to quantify this.</p>
<p>Let's look at how distances behaves as we go to higher dimensions. Let's sample a 10,000 points from a normal distribution, then pick a random point in the distribution, and compute the distance to the furthest and closest point:</p>
<p><img src="https://erikbern.com/assets/2015/10/knn_avg_dist_synt.png" alt="image"></p>
<p>(For code, check out <a href="https://github.com/erikbern/ann-presentation/blob/master/knn_avg_dist.py">knn_avg_dist.py</a> on Github)</p>
<p>As the number of dimensions increase, the distances to the <em>closest</em> and the <em>furthest</em> point are almost similar. <a href="https://en.wikipedia.org/wiki/Curse_of_dimensionality">Wikipedia's article</a> is actually quite enlightening and features this statement that as we go to higher dimensions, we have the relationship:</p>
<p>$$ \huge \lim_{d \to \infty} E\left(\frac{\text{dist}_{\max} (d) - \text{dist}_{\min} (d)}{\text{dist}_{\min} (d)}\right) \to 0 $$</p>
<p> </p>
<p>For example if we are in a high dimensional version of New York, then the nearest city is 1.000 miles away and the furthest city is 1.001 miles away. The ratio above is then 0.001. Let's get back to this ratio shortly.</p>
<p>This weird behavior makes nearest neighbors in high dimensional spaces tricky. It's still an <a href="https://rjlipton.wordpress.com/2009/06/18/high-dimensional-search-and-the-nn-problem/">open problem</a> whether <em>exact</em> k-NN is solvable in polynomial time.</p>
<p><strong>Saving the day</strong></p>
<p>The above relation applies to distribution where there is little structure – in particular the example I generated was just data points from the normal distribution. In the real world data sets we usually have a <em>lot</em> of structure in our data. Consider all the cities and towns of the world. This is a set of points in in 3D space, but all cities lie on a 2D sphere and so the point set will actually behave more 2D-like.</p>
<p>The same thing happens to word embeddings or any other set of vectors. Even if we're dealing with 1000's of dimensions, there underlying structure is really much more lower dimensional. This is exactly why dimensionality reduction works so well!</p>
<p>Let's actually compute the quantity mentioned above and map out some real datasets:</p>
<p><img src="https://erikbern.com/assets/2015/10/knn-distances.png" alt="image"></p>
<p>(Again for the code, check out <a href="https://github.com/erikbern/ann-presentation/blob/master/knn_avg_dist.py">knn_avg_dist.py</a> on Github)</p>
<p>The graph above shows something pretty interesting: some of these “real” high dimensional data sets have a ratio that is similar to much fewer dimensions for the normal distribution.</p>
<p>Look at the Freebase vectors (which you can <a href="https://code.google.com/p/word2vec/">download here</a>) for instance – they are 1000D, but they are similar to a normal distribution in 16D in terms of the ratio. This behavior holds true for a whole set of different vectors. The 784-dimensional <a href="http://yann.lecun.com/exdb/mnist/">MNIST digits data set</a> behaves as the 8D normal distribution. The 128-dimensional embedding of food pictures same thing.</p>
<p>I think this is why approximate nearest neighbor methods work so well up to thousands of dimensions. The key thing is the algorithms need to learn the distribution from the data. I am generally bearish on <a href="https://en.wikipedia.org/wiki/Locality-sensitive_hashing">LSH</a> for this reason.</p>
<p>Enough about approximate nearest neighbors for a while! Hope you liked this series of posts!</p>
Nearest neighbors and vector models – part 2 – algorithms and data structures2015-10-01T00:00:00Zhttps://erikbern.com/2015/10/01/nearest-neighbors-and-vector-models-part-2-how-to-search-in-high-dimensional-spaces.html<p><em>This is a blog post rewritten from a presentation at <a href="http://www.meetup.com/NYC-Machine-Learning/events/225265016/">NYC Machine Learning</a> on Sep 17. It covers a library called <a href="https://github.com/spotify/annoy">Annoy</a> that I have built that helps you do nearest neighbor queries in high dimensional spaces. In the <a href="/2015/09/24/nearest-neighbor-methods-vector-models-part-1/">first part</a>, I went through some examples of why vector models are useful. In the second part I will be explaining the data structures and algorithms that Annoy uses to do approximate nearest neighbor queries.</em></p>
<p>Let's start by going back to our point set. The goal is to find nearest neighbors in this space. Again, I am showing a 2 dimensional point set because computer screens are 2D, but in reality most vector models have much higher dimensionality.</p>
<p><img src="https://erikbern.com/assets/2015/09/scatter-1024x793.png" alt="image"></p>
<p>Our goal is to build a data structure that lets us find the nearest points to any query point in sublinear time.</p>
<p>We are going to build a tree that lets us do queries in $$ \mathcal{O}(\log n) $$ . This is how Annoy works. In fact, it's a binary tree where each node is a random split. Let's start by splitting the space once:</p>
<p><img src="https://erikbern.com/assets/2015/09/tree-1-1024x793.png" alt="image"></p>
<p>Annoy does this by picking two points randomly and then splitting by the hyperplane equidistant from those two points. The two points are indicated by the gray line and the hyperplane is the thick black line.</p>
<p>Let's keep splitting each subspace recursively!</p>
<p><img src="https://erikbern.com/assets/2015/09/tree-2-1024x793.png" alt="image"></p>
<p>A very tiny binary tree is starting to take shape:</p>
<p><img src="https://erikbern.com/assets/2015/09/tree-2-graphviz1-300x203.png" alt="image"></p>
<p>We keep splitting again:</p>
<p><img src="https://erikbern.com/assets/2015/09/tree-3-1024x793.png" alt="image"></p>
<p>… and so on. We keep doing this until there's at most K items left in each node. At that point it looks something like this (for K=10):</p>
<p><img src="https://erikbern.com/assets/2015/09/tree-full-K-1024x793.png" alt="image"></p>
<p>With the corresponding binary tree:</p>
<p><img src="https://erikbern.com/assets/2015/09/tree-full-K-graphviz1-1024x404.png" alt="image"></p>
<p> </p>
<p>Nice! We end up with a binary tree that partitions the space. The nice thing is that <em>points that are close to each other in the space are more likely to be close to each other in the tree.</em> In other words, if two points are close to each other in the space, it's unlikely that any hyperplane will cut them apart.</p>
<p>To search for any point in this space, we can traverse the binary tree from the root. Every intermediate node (the small squares in the tree above) defines a hyperplane, so we can figure out what side of the hyperplane we need to go on and that defines if we go down to the left or right child node. Searching for a point can be done in logarithmic time since that is the height of the tree.</p>
<p>Let's search for the point denoted by the red X in the plot below:</p>
<p><img src="https://erikbern.com/assets/2015/09/heap-pos-1024x793.png" alt="image"></p>
<p> </p>
<p>The path down the binary tree looks like this:</p>
<p><img src="https://erikbern.com/assets/2015/09/heap-pos-graphviz-1024x404.png" alt="image"></p>
<p>We end up with 7 nearest neighbors. Very cool, but this is not great for at least two reasons</p>
<ol>
<li>What if we want more than 7 neighbors?</li>
<li>Some of the nearest neighbors are actually outside of this leaf polygon</li>
</ol>
<p><strong>Trick 1 – use a priority queue</strong></p>
<p>The trick we're going to use is to go down on <em>both sides of a split</em> if we are “close enough” (which I will quantify in a second). So instead of just going down one path of the binary tree, we will go down a few more:</p>
<p><img src="https://erikbern.com/assets/2015/09/heap-1024x793.png" alt="image"></p>
<p>With the corresponding binary tree:</p>
<p><img src="https://erikbern.com/assets/2015/09/heap-graphviz-1024x404.png" alt="image"></p>
<p>We can configure the threshold of how far we are willing to go into the “wrong” side of the split. If the threshold is 0, then we will always go on the “correct” side of the split. However if we set the threshold to 0.5 you get the search path above.</p>
<p>The trick here is we can actually use a <em>priority queue</em> to explore nodes sorted by the max distance into the “wrong” side. The nice part is we can search increasingly larger and larger thresholds starting from 0.</p>
<p><strong>Trick 2 – build a forest of trees</strong></p>
<p>The second trick we are going to use is is to construct <em>many trees</em> aka a <em>forest</em>. Each tree is constructed by using a random set of splits. We are going to search down all those trees at the same time:</p>
<p><img src="https://erikbern.com/assets/2015/09/animated.gif" alt="image"></p>
<p>We can search all trees at the same time using one single priority queue. This has an additional benefit that the search will focus on the trees that are “best” for each query – the splits that are the <em>furthest away from the query point</em>.</p>
<p>Every tree contains all points so when we search many trees we will find some points in multiple trees. If we look at the union of the leaf nodes we get a pretty good neighborhood:</p>
<p><img src="https://erikbern.com/assets/2015/09/candidates.png" alt="image"></p>
<p>At this point we have nailed it down to a small set of points. Notice so far we have not even computed distances to a single point. Next step is to compute all distances and rank the points:</p>
<p><img src="https://erikbern.com/assets/2015/09/candidates-dist.png" alt="image"></p>
<p>We then sort all nodes by distance and return the top K nearest neighbors. Nice! And that is how the search algorithm works in Annoy.</p>
<p>Except one thing. In this case it turns out we actually did miss a couple of points outside:</p>
<p><img src="https://erikbern.com/assets/2015/09/candidates-top.png" alt="image"></p>
<p>But the A in Annoy stands for <em>approximate</em> and missing a few points is acceptable. Annoy actually has a knob you can tweak (<em>search_k</em>) that lets you trade off performance (time) for accuracy (quality).</p>
<p>The whole idea behind approximate algorithms is that sacrificing a little bit of accuracy can give you enormous performance gains (orders of magnitude). For instance we could return a decent solution where we really only computed the distance for 1% of the points – this is a 100x improvement over exhaustive search.</p>
<p>More trees always help. By adding more trees, you give Annoy more chances to find favorable splits. You generally want to bump it up as high as you can go without running out of memory.</p>
<p><strong>Summary: Annoy's algorithm</strong></p>
<p>Preprocessing time:</p>
<ol>
<li>Build up a bunch of binary trees. For each tree, split all points recursively by random hyperplanes.</li>
</ol>
<p>Query time:</p>
<ol>
<li>Insert the root of each tree into the priority queue</li>
<li>Until we have _search_k _candidates, search all the trees using the priority queue</li>
<li>Remove duplicate candidates</li>
<li>Compute distances to candidates</li>
<li>Sort candidates by distance</li>
<li>Return the top ones</li>
</ol>
<p>Feel free to check out <a href="https://github.com/spotify/annoy/blob/master/src/annoylib.h#L421">_make_tree</a> and <a href="https://github.com/spotify/annoy/blob/master/src/annoylib.h#L513">_get_all_nns</a> in annoylib.h</p>
<p>That's it for this post! More is coming from the presentation shorly. Btw, the take a look at <a href="http://www.slideshare.net/erikbern/approximate-nearest-neighbor-methods-and-vector-models-nyc-ml-meetup">the slides</a>, and the check out the <a href="https://github.com/erikbern/ann-presentation">code to generate all graphs</a> in this post.</p>
Nearest neighbor methods and vector models – part 12015-09-24T00:00:00Zhttps://erikbern.com/2015/09/24/nearest-neighbor-methods-vector-models-part-1.html<p>This is a blog post rewritten from a presentation at <a href="http://www.meetup.com/NYC-Machine-Learning/events/225265016/">NYC Machine Learning</a> last week. It covers a library called <a href="https://github.com/spotify/annoy">Annoy</a> that I have built that helps you do (approximate) nearest neighbor queries in high dimensional spaces. I will be splitting it into several parts. This first talks about vector models, how to measure similarity, and why nearest neighbor queries are useful.</p>
<p><em>Nearest neighbors</em> refers to something that is conceptually very simple. For a set of points in some space (possibly many dimensions), we want to find the closest <em>k</em> neighbors quickly.</p>
<p><img class=" size-large wp-image-1404 aligncenter" src="/assets/2015/09/scatter-nns-20-1024x793.png" alt="scatter-nns-20" width="660" height="511" /></p>
<p> </p>
<p>This turns out to be quite useful for a bunch of different applications. Before we get started on exactly how nearest neighbor methods work, let's talk a bit about vector models.</p>
<p><strong>Vector models and why nearest neighbors are useful</strong></p>
<p>Vector models are increasingly popular in various applications. They have been used in natural language processing for a long time using things like LDA and PLSA (and even earlier using TF-IDF in raw space). Recently there has been a new generation of models: <a href="https://code.google.com/p/word2vec/">word2vec</a>, RNN's, etc.</p>
<p>In collaborative filtering vector models have been among the most popular methods since going back to the Netflix Prize – the <a href="http://www.netflixprize.com/assets/GrandPrize2009_BPC_BellKor.pdf">winning entry</a> featured a huge ensemble where vector models made up a huge part.</p>
<p>The basic idea is to represent objects in a space where proximity means two items are similar. If we're using something like word2vec it could look something like this:</p>
<p><img class=" wp-image-1427 aligncenter" src="/assets/2015/09/vector-model1.png" alt="vector model" width="459" height="323" /></p>
<p> </p>
<p>In this case similarity between words is determined by the angle between them. <em>apple</em> and <em>banana</em> are close to each other, whereas <em>boat</em> is further.</p>
<p>(As a side note: much has been written about word2vec's ability to do word analogies in vector space. This is a powerful demonstration of the structure of these vector spaces, but the idea of using vector spaces is old and similarity is arguably much more useful).</p>
<p>In the most basic form, data is already represented as vectors. For an example of this, let's look at one of the most canonical data sets in machine learning – the <a href="http://yann.lecun.com/exdb/mnist/">MNIST handwritten digits</a> dataset.</p>
<p><strong>Building an image search engine for handwritten digits</strong></p>
<p>The MNIST dataset features 60,000 images of size 28×28. They each feature a handwritten digits in grayscale. One of the most basic ways we can play around with this data set is to smash each 28×28 array into a 784-dimensional vector. There is absolutely no machine learning involved in doing this, but we will get back and introduce cool stuff like neural networks and word2vec later.</p>
<p>Let's define a distance function in this space. Let's say the distance between two digits is the squared sum of the pixel differences. This is basically the squared Euclidean distance (i.e. the good old Pythagorean theorem):</p>
<p><img class=" size-medium wp-image-1406 aligncenter" src="/assets/2015/09/pixel-distance-300x57.png" alt="pixel distance" width="300" height="57" /></p>
<p>This is nice because we can compute the distance of arbitrary digits in the dataset:</p>
<p><img class=" size-medium wp-image-1407 aligncenter" src="/assets/2015/09/digit-distance-300x41.png" alt="digit distance" width="300" height="41" /></p>
<p>This now lets us search for neighbors in this 784-dimensional space. Check out some samples below – the leftmost digit is the seed digit and to the right of it are the ten most similar images using the pixel distance.</p>
<p><img class=" wp-image-1410 aligncenter" src="/assets/2015/09/MNIST-neighbors-300x164.png" alt="MNIST neighbors" width="569" height="311" /></p>
<p>You can see that it sort of works. The digits are visually quite similar, although it's obvious to a human that some of the nearest neighbors are the wrong digit.</p>
<p>This was pretty nice and easy, but this also an approach that doesn't scale very well. What about larger images? What about color images? And how to we determine similars not just in terms of visual similarity but actually what a human would think of as similar. This simple definition of “distance” leaves a lot of room for improvement.</p>
<p><strong>Dimensionality reduction</strong></p>
<p>A powerful method that works across a wide range of domains is to take high dimensional complex items and project the items down to a compact vector representation.:</p>
<ol>
<li>Do a dimensionality reduction from a large dimensional space to a small dimensional space (10-1000 dimensions)</li>
<li>Use similarity in this space instead</li>
</ol>
<p>Dimensionality reduction is an extremely powerful technique because it lets us take almost any object and translate it to a small convenient vector representation in a space. This space is generally referred to as <em>latent</em> because we don't necessarily have any prior notion of what the axes are. What we care about is that <em>objects that are similar end up being close to each other.</em> What do we mean with similarity? In a lot of cases we can actually discover that from our data.</p>
<p>So let's talk about one approach for dimensionality reduction on images: deep convolutional neural networks. I had a side project about a year ago to classify food. It's a pretty silly application but the eventual goal was to see if you could predict calorie content from pictures, and a side goal was to learn how to use convolutional neural networks. I never ended up using this for anything and wasted way to much money renting GPU instances on AWS, but it was fun.</p>
<p>To train the model, I downloaded 6M pics from Yelp and Foursquare and trained a network quite similar to the one described in <a href="http://arxiv.org/pdf/1409.1556.pdf">this paper</a> using Theano.</p>
<p><img class=" size-large wp-image-1429 aligncenter" src="/assets/2015/09/Foodnet-1024x448.png" alt="Foodnet" width="660" height="289" />](/assets/2015/09/foodnet.png)</p>
<p>The final layer in this model is a 1244-way multi-classification output using softmax so we're training this in a supervised way. These are words that occurred in the description text, eg. “spicy ramen” for the one above. However the nice thing is we have a “bottleneck” layer just before the final layer – a 128-dimensional vector that gives us exactly what we want.</p>
<p><img class=" size-medium wp-image-1414 aligncenter" src="/assets/2015/09/CNN-burger-300x103.png" alt="CNN-burger" width="300" height="103" /></p>
<p>Using the neural network as an embedding function and using cosine similarity as a metric (this is basically Euclidean distance, but normalize the vectors first) we get some quite cool nearest neighbors:</p>
<p><img class=" size-large wp-image-1416 aligncenter" src="/assets/2015/09/nearest-food-pics-1024x538.jpg" alt="nearest food pics" width="660" height="347" /></p>
<p>These similars look pretty reasonable! The top left picture is similar to a bunch of other fries. The second row shows a bunch of different white bowls with Asian food – more impressively they are all in different scales and angles, and pixel by pixel similarity is quite low. The last row shows a bunch of desserts with similar patterns of chocolate sprinkled over it. We're dealing with a space that can express object features quite well.</p>
<p>So how do we do find similar items? I'm not going to describe dimensionality reduction in great detail – there are a million different ways that you can read about. What I have spent more time thinking about is <em>how to search for neighbors in vector spaces</em>. In fact, finding the neighbors above takes only a few milliseconds per picture, because Annoy is very fast. This is why dimensionality reduction is so extremely useful. At the same time that it's discovering high level structure in data, it also computes a compact representation of items. This representation makes it easy to compute similarity and search for nearest neighbors.</p>
<p><strong>Vector methods in collaborative filtering</strong></p>
<p>Reducing dimensionality isn't just useful in computer vision, of course. As mentioned, it's incredibly useful in natural language processing. At Spotify, we use vector models extensively for collaborative filtering. The idea is to project artists, users, tracks, and other objects into a low dimensional space where similarity can be computed easily and recommendations can be made. This is in fact what powers almost all of the Spotify recommendations – in particular Discover Weekly that was launched recently.</p>
<p><img class=" wp-image-1447 aligncenter" src="/assets/2015/09/2D-embedding-of-artists.png" alt="2D embedding of artists" width="353" height="342" /></p>
<p><img class=" size-medium wp-image-1448 aligncenter" src="/assets/2015/09/CF-cosines-300x161.png" alt="CF cosines" width="300" height="161" /></p>
<p>I have already put together several presentations about this so if you're interested, you should check out some of them:</p>
<ul>
<li><a href="http://www.slideshare.net/erikbern/music-recommendations-mlconf-2014">Music Recommendations @ MLConf</a> (2014)</li>
<li><a href="http://www.slideshare.net/erikbern/mlhadoop-nyc-predictive-analytics-2">ML+Hadoop @ NYC Predictive Analytics (2013)</a></li>
</ul>
<p><strong>Exhaustive search as a baseline</strong></p>
<p>So how do we find similar items? Before we go into detail about how Annoy works, it's worth looking at the baseline of doing a <em>brute force exhaustive search</em>. This means iterating over all possible items and computing the distance for each one of them to our query point.</p>
<p>word2vec actually comes with a tool to do exhaustive search. Let's see how it compares! Using the GoogleNews-vectors-negative300.bin dataset and querying for “chinese river”, it takes about <strong>2 minutes 34 seconds</strong> to output this:</p>
<ul>
<li>Qiantang_River</li>
<li>Yangtse</li>
<li>Yangtze_River</li>
<li>lake</li>
<li>rivers</li>
<li>creek</li>
<li>Mekong_river</li>
<li>Xiangjiang_River</li>
<li>Beas_river</li>
<li>Minjiang_River</li>
</ul>
<p>I wrote a similar tool that uses Annoy (<a href="https://github.com/erikbern/ann-presentation/blob/master/nearest_neighbors.py">available on Github here</a>). The first time you run it, it will precompute a bunch of stuff and can take a lot of time to run. However the second time it runs it will load (mmap) an Annoy index directly from disk into memory. Relying on the magic page cache, this will be very fast. Let's take it for a spin and search for “chinese river”:</p>
<ul>
<li>Yangtse</li>
<li>Yangtze_River</li>
<li>rivers</li>
<li>creek</li>
<li>Mekong_river</li>
<li>Huangpu_River</li>
<li>Ganges</li>
<li>Thu_Bon</li>
<li>Yangtze</li>
<li>Yangtze_river</li>
</ul>
<p>Amazingly, this ran in <strong>470 milliseconds</strong>, probably some of it overhead for loading the Python interpreter etc. This is roughly <strong>300x faster</strong> than the exhaustive search provided by word2vec.</p>
<p>Now – some of you probably noticed that the results are marginally different. That's because the A in Annoy stands for <em>approximate</em>. We are deliberately trading off some accuracy in return for a huge speed improvement. It turns out you can actually control this knob explicitly. Telling Annoy we want to search through 100k nodes (will get back to that later) we get this result in about <strong>2 seconds</strong>:</p>
<ul>
<li>Qiantang_River</li>
<li>Yangtse</li>
<li>Yangtze_River</li>
<li>lake</li>
<li>rivers</li>
<li>creek</li>
<li>Mekong_river</li>
<li>Xiangjiang_River</li>
<li>Beas_river</li>
<li>Minjiang_River</li>
</ul>
<p>This is exactly the same as the exhaustive search it turns out – and still about <strong>50x faster</strong>.</p>
<p><strong>Other uses of nearest neighbors</strong></p>
<p>Finally just as a fun example of another use, nearest neighbors is useful when you're dealing with physical spaces too. In an earlier blog post, I was showing this world map of how long it takes to ping IP addresses from my apartment in NYC:</p>
<p><img class="aligncenter" src="/assets/world.png" alt="" width="1635" height="589" /></p>
<p>This is a <a href="https://github.com/erikbern/ping">simple application</a> of k-NN (k-nearest neighbors) regression that I've <a href="/2015/04/26/ping-the-world/">written earlier about on this blog</a>. There is no dimensionality reduction involved here – we just deal with 3D coordinates (lat/long projected to the unit sphere).</p>
<p>In the next series, I will go in depth about how Annoy works. Stay tuned!</p>
Presentations about Spotify music recommendations2015-09-22T00:00:00Zhttps://erikbern.com/2015/09/22/presentations-about-spotify-music-recommendations.html<p>A couple of people in my old team have been around talking about how Spotify does music recommendations and put together some quite good presentations.</p>
<p>First one is Neville Li's presentation about <a href="http://www.slideshare.net/sinisalyh/scala-data-pipelines-spotify">Scala Data Pipelines @ Spotify</a>:</p>
<p>The second one is Chris Johnson's <a href="http://www.slideshare.net/MrChrisJohnson/interactive-recommender-systems-with-netflix-and-spotify">presentation</a> from <a href="http://recsys.acm.org/recsys15/">RecSys 2015</a> about Interactive Recommender Systems:</p>
Antipodes2015-09-08T00:00:00Zhttps://erikbern.com/2015/09/08/antipodes.html<p>I was playing around with D3 last night and built a silly visualization of antipodes and how our intuitive understanding of the world sometimes doesn't make sense. Check out the <a href="http://bl.ocks.org/erikbern/1ff88b70b70e10f81822">visualization at bl.ocks.org</a>!</p>
<p>Basically the idea is if you fly from Beijing to Buenos Aires then you can have a layover at <em>any point of the Earth's surface</em> and it won't make the trip longer.</p>
<p><img src="https://erikbern.com/assets/2015/09/Screen-Shot-2015-09-07-at-11.33.33-PM.png" alt="image"></p>
Software Engineers and Automation2015-08-16T00:00:00Zhttps://erikbern.com/2015/08/16/software-engineers-and-automation.html<p>Every once in a while when talking to smart people the topic of automation comes up. Technology has made lots of occupations redundant, so what's next?</p>
<p><img src="https://erikbern.com/assets/2015/08/switchboard-operator.jpg" alt="image"></p>
<p><em>Switchboard operator, a long time ago</em></p>
<p>What about software engineers? Every year technology replaces parts of what they do. Eventually surely everything must be replaced? I just ran into another one of these arguments: <a href="https://medium.com/@dtauerbach/software-engineers-will-be-obsolete-by-2060-2a214fdf9737">Software Engineers will be obsolete by 2060</a>.</p>
<p>This might be a <a href="https://en.wikipedia.org/wiki/Lump_of_labour_fallacy">Lump of Labor Fallacy</a>. Think about how much around us is currently powered by software and how much <em>could</em> be powered by software. The opportunity to apply software is probably 100x larger than what's currently being used. So why aren't we using software 100x more? <em>Because software engineers are expensive.</em></p>
<p>It's easy to see this if you look back ten years. Say you wanted to build a web shop ten years ago. This was before the cloud, before API's, good web frameworks etc. Building a web shop was probably 100x more expensive back then. As a result – there were <em>a lot fewer</em> web shops available. Of course, it's harder to know what latent demand will be unlocked in the next ten years, but there's always new things coming out that you didn't realize you needed.</p>
<p>Somewhat counterintuitively, for many goods the latent demand is so big that what happens when the price drops is that the <em>total demand increases.</em> This is called <a href="https://en.wikipedia.org/wiki/Jevons_paradox">Jevons Paradox</a> after an economist noticed in the 1800s that increased efficiency of coal use lead to an <em>increase</em> in consumption of coal.</p>
<p><img src="https://erikbern.com/assets/2015/08/enhanced-buzz-3882-1369090195-6.jpg" alt="image"></p>
<p><em>Vin Diesel as a stock broker in the movie “Boiler Room”</em></p>
<p>The key here is whether technology <em>replaces</em> a job or whether it <em>increases the efficiency</em> of a job. Technology did not increase the output of switchboard operators, so they were replaced. Similarly, technology is not going to make truck drivers 100x as efficient, so they will be replaced by self driving trucks at some point. But technology actually has the opportunity to increase the output of software engineers by another few orders of magnitude. This will unlock a lot of latent demand, and we will need <em>more</em> software engineers, not less.</p>
<p>The other key is of course whether demand is bounded. So if you want to identify which occupations will be automated, I would look for (a) limited latent demand (b) little technical leverage.</p>
<p>Is this rationalization? Maybe!</p>
<p>Also for a good quick read, check out <a href="http://www.amazon.com/Race-Against-The-Machine-Accelerating-ebook/dp/B005WTR4ZI">Race Against the Machine</a> by Erik Brynjolfsson and Andrew McAfee.</p>
coin2dice2015-07-24T00:00:00Zhttps://erikbern.com/2015/07/24/math-problem.html<p>Here's a problem that I used to give to candidates. I stopped using it seriously a long time ago since I don't believe in puzzles, but I think it's kind of fun.</p>
<ol>
<li>Let's say you have a function that simulates a random coin flip. It returns “H” or “T”. This is the <em>only random generator available</em>. How can write a new function that simulates a random dice roll (1…6)?</li>
<li>Is there any method that guarantees that the second function returns in finite time?</li>
<li>Let's say you want to do this $$ n $$ times where $$ n \to \infty $$ . What's the most efficient way to do it? Efficient in terms of <em>using the fewest amount of coin flips</em>.</li>
</ol>
<p>The first part is old, I think. The second and third part are follow up questions that I came up with.</p>
<p>I'll give you some time to think about it!</p>
<p> </p>
<p> </p>
<p> </p>
<p> </p>
<p> </p>
<p> </p>
<p> </p>
<p> </p>
<p> </p>
<p>Don't peak!</p>
<p> </p>
<p> </p>
<p> </p>
<p> </p>
<p> </p>
<p> </p>
<p> </p>
<p> </p>
<p> </p>
<p> </p>
<p> </p>
<p> </p>
<p> </p>
<p> </p>
<p> </p>
<p>Did you figure it out?</p>
<p> </p>
<p> </p>
<p> </p>
<p> </p>
<p> </p>
<p> </p>
<p> </p>
<p> </p>
<p> </p>
<p> </p>
<p><strong>Solutions</strong></p>
<ol>
<li>There's a multitude of ways to do this. The easiest way to do it is probably to flip the coin three times and map the outcomes like this: (HHH, 0), (HHT, 1), (HTH, 2), (HTT, 3), (THH, 4), (THT, 5), (TTH, 6), (TTT, 7). If you end up getting HHH or TTT, you flip again.</li>
<li>Impossible! If you flip the coin $$ n $$ times then there's exactly $$ 2^n $$ outcomes. But we can't partition this space evenly into 6 buckets since $$ 3\nmid 2^n $$</li>
<li>This one is trickier. Think about it in terms of the amount of information you extract. Every coin flip extracts 1 bit, but every dice roll consumes $$ \log_2 6\approx 2.585 $$ bits. This is a lower bound – you need <em>at least</em> that many coin flips per dice roll.</li>
</ol>
<p>Is there a way to achieve that lower bound? Turns out there is: basically encode a long series of coin flip as a binary representation of a number between 0 and 1, then convert it to base 6. This idea resembles <a href="https://en.wikipedia.org/wiki/Arithmetic_coding">Arithmetic coding</a>. Sample code:</p>
<p>{% gist erikbern/22c48c622dd9e160419c %}</p>
<p>Hope you enjoyed geeking out with a math problem this time!</p>
Benchmark of Approximate Nearest Neighbor libraries2015-07-04T00:00:00Zhttps://erikbern.com/2015/07/04/benchmark-of-approximate-nearest-neighbor-libraries.html<p><a href="https://github.com/spotify/annoy">Annoy</a> is a library written by me that supports fast approximate nearest neighbor queries. Say you have a high (1-1000) dimensional space with points in it, and you want to find the nearest neighbors to some point. Annoy gives you a way to do this very quickly. It could be points on a map, but also word vectors in a latent semantic representation or latent item vectors in collaborative filtering.</p>
<p>I've made a few optimizations to Annoy lately and I was curious to see how it stacks up against other libraries out there, so I wrote a benchmark suite: <a href="https://github.com/erikbern/ann-benchmarks">ann-benchmarks</a>. It supports any library with a Python interface and I added a bunch of them. It even has Travis integration!</p>
<p><img src="https://erikbern.com/assets/ann-benchmarks-glove.png" alt="image"></p>
<p><em>Cosine 100D results</em></p>
<p><img src="https://erikbern.com/assets/ann-benchmarks-sift.png" alt="image"></p>
<p><em>Results for 128D Euclidean</em></p>
<p>The results so far for Annoy are <em>pretty great</em>. The only method that consistently beats Annoy is SW-graph from <a href="https://github.com/searchivarius/NonMetricSpaceLib">nmslib</a> which is about 2-3x faster at the same precision. But Annoy beats both <a href="http://www.cs.ubc.ca/research/flann/">FLANN</a> and <a href="https://github.com/aaalgo/kgraph">KGraph</a> at high precisions (>95%). At lower precisions (<95%) and cosine distance, Annoy is not quite as fast as FLANN and KGraph.</p>
<p>A surprising result was that <a href="https://github.com/ryanrhymes/panns">Panns</a>, <a href="https://nearpy.io">Nearpy</a>, and <a href="http://scikit-learn.org/stable/modules/generated/sklearn.neighbors.LSHForest.html">LSHForest</a> all are very low performance. They are roughly 1,000 times slower than the other ones, and even worse, Panns & LSHForest don't even produce high precision scores. I created <a href="https://github.com/scikit-learn/scikit-learn/issues/4917">an issue</a> in scikit-learn about LSHForest's performance. Of course, it might be that I did something wrong in the benchmark.</p>
<p>Annoy was actually never built with performance in mind. The killer feature was always to be able to load/unload indexes quickly using mmap – which no other package supports – but it's fun to see that it's actually very competitive on performance too. One of the things that made a difference was that I recently changed the interface for Annoy slightly (don't worry, it's backwards compatible). There is now a query-time tradeoff knob which lets you vary how many nodes are inspected.</p>
<p>The other factor not covered by the graph above is how hard it is to install most of these libraries. Annoy should compile and run almost anywhere (Linux, Win, OS X) very easily, but the other libraries can be challenging to install. For instance, both kgraph and nmslib depend on GCC-4.8, so they require custom installations. There are <a href="https://github.com/erikbern/ann-benchmarks/tree/master/install">scripts</a> to install all libraries in the repo tested with Ubuntu 12.04 and 14.04. For other platforms – good luck!</p>
<p>I might do a talk in September at the <a href="http://www.meetup.com/NYC-Machine-Learning">NYC Machine Learning meetup</a> about this, we'll see! Until then, I found <a href="http://stefansavev.com/pdf/RandomProjectionsForSearchAndMachineLearning.pdf">this really great presentation</a> by Stefan Savev (with <a href="http://stefansavev.com/randomtrees/">corresponding web site</a>). He claims <a href="https://github.com/stefansavev/random-projections-at-berlinbuzzwords">his own implementation</a> is a bit faster than Annoy! It's in Scala so I haven't tested it yet.</p>
<p><img src="https://erikbern.com/assets/2015/07/Screen-Shot-2015-07-05-at-10.51.40-AM.png" alt="image"></p>
<p><em>Slides from Stefan Savev's presentation</em></p>
More Luigi alternatives2015-07-02T00:00:00Zhttps://erikbern.com/2015/07/02/more-luigi-alternatives.html<p>The workflow engine battle has intensified with some more interesting entries lately! Here are a couple I encountered in the last few days. I love that at least two of them are direct references to Luigi!</p>
<p><strong>Airflow</strong> <a href="http://nerds.airbnb.com/airflow/">(Blog Post)</a> (<a href="https://github.com/airbnb/airflow">GitHub</a>)</p>
<p>Airflow from Airbnb is probably the most interesting one. I've only glanced at it, but here are some very superficial notes</p>
<ul>
<li>Seems mostly targeted to run raw UNIX commands using a pretty simple syntax with Jinja templates</li>
<li>Tasks don't have support for parameters but it seems like you can build tasks dynamically by just putting them in a function</li>
<li>It seems to be built around daily jobs, meaning dates and backfill by dates is a foundational concept of the package (whereas in Luigi dates are just one out of many different parameters)</li>
<li>There is a database of task history which is great</li>
<li>The visualization seems great</li>
<li>It also supports farming out jobs to other machines. This is something Luigi definitely needs</li>
<li>It also comes with built-in support for HDFS, S3, MySQL and Postgres, similar to Luigi</li>
<li>There's a built-in triggering mechanism (also something Luigi needs)<figure id="attachment_1313" style="width: 300px;" class="wp-caption aligncenter"></li>
</ul>
<p><img src="https://erikbern.com/assets/2015/07/Screen-Shot-2015-05-28-at-11.13.01-AM-300x196.png" alt="image"><em>Screen shot of Airflow (from the blog post)</em></p>
<p><strong>Mario</strong> (<a href="http://intentmedia.com/one-up-building-machine-learning-pipelines-with-mario/">Blog post</a>) <a href="https://github.com/intentmedia/mario">(GitHub)</a></p>
<p>Mario seems to be a “Luigi in Scala”. It seems extremely simplistic, so it's probably more conceptual at this point than meant to be full-fledged.</p>
<p>The choice of Scala is interesting. First of all, I think it's fair to say that the JVM has taken over the data stack. A lot of Luigi's core concept are really functional in nature and a language like Scala might be a better choice. A cool thing is that the RPC between Luigi clients and the scheduler is actually just a simple REST interface and Luigi's scheduler could in fact support clients running other languages. Mario doesn't do this but it's something I've been meaning to explore for a long time.</p>
<p><strong>Ruigi</strong> <a href="https://github.com/kirillseva/ruigi">(GitHub)</a></p>
<p>Ruigi is “Luigi in R”. It follows the same set of conventions but seems to be pretty simple in that it runs everything locally.</p>
<p><strong>Makeflow</strong> <a href="http://ccl.cse.nd.edu/software/makeflow/">(Web site)</a></p>
<p>Seems to be some academic project mostly for publishing papers. What's up with not using GitHub in 2015? And also having a “download” section with tarballs!</p>
<p>The benefit of Makeflow seems to be support for a bunch of batch systems commonly used in HPC in academia. The dependencies are specified using their own DSL with some simple Makefile-like notation.</p>
<p><strong>Conclusions</strong></p>
<p>So what's the state of workflow engines at the moment? Allow me to say something provocative just for the sake of it: <em>they all kind of suck. Including Luigi.</em> There is basically so much trial and error when building a workflow engine and everytime I encounter one I just see a bunch of bad design decisions. Same when I look at Luigi. Luigi was the result of a bunch of <em>many</em> iterations and it avoids roughly 100 pitfalls we encountered in earlier attempts, but there are still some parts of the design that can be addressed.</p>
<p>I don't mean to bash my own open source project here. Open sourcing Luigi has helped a lot of people building awesome stuff and I think it's better than anything else out there.</p>
<p>I hope with the explosion of workflow engines lately, we will see a convergence of ideas to a second generation of much better, much more scalable, and much easier ones. My dream is that someone combines every god damned workflow engine in the world and write a new one, preferably in some JVM based language like Scala. I sincerely have no idea how that would look like, but I would love to do that some day as a Luigi 2.0!<figure id="attachment_1306" style="width: 276px;" class="wp-caption aligncenter"></p>
<p><img src="https://erikbern.com/assets/2015/06/Luigi-Lance-781x1024.png" alt="image"><em>Me and one of my cats (who is not too happy). Long story!</em></p>
3D in D32015-06-21T00:00:00Zhttps://erikbern.com/2015/06/21/3d-in-d3.html<p>I have spent some time lately with <a href="http://d3js.org/">D3</a>. It's a lot of fun to build interactive graphs. See for instance this <a href="https://rawgit.com/bettermg/crossfader/master/demo.html#wine">demo</a> (will provide a longer writeup soon).</p>
<p>D3 doesn't have support for 3D but you can do projections into 2D pretty easily. It's just old school computer graphics. I ended up adding an animated background to this blog based on <a href="https://github.com/erikbern/d3-3d">an experiment</a>. The math is simple.</p>
<p>First, there's the rotation. Given a bunch of 3D coordinates, how do you rotate them in 3D space? The cleanest way is to define angles $$ \alpha, \beta, \gamma $$ and use them for rotation in the yz-plane, xz-plane, and xy-plane, respectively. Each of them define a rotation matrix. For the xy-plane, we get the rotation matrix $$ R_{xy} $$ (<a href="https://github.com/erikbern/d3-3d/blob/master/d3-3d.js#L5">see code</a>):</p>
<p>$$ R_{xy} = \begin{pmatrix} \cos(\gamma) & -\sin(\gamma) & 0 \ \sin(\gamma) & \cos(\gamma) & 0 \ 0 & 0 & 1 \end{pmatrix} $$</p>
<p>We get three of these matrices in total: $$ R_{yz}, R_{xz}, R_{xy} $$ .</p>
<p>The rotation of any vector $$ \mathbf{v} $$ can now be described as $$ R_{yz} R_{xz} R_{xy}\mathbf{v} $$ . The nice thing is we can _precompute_ the product of these matrices $$ R $$ (<a href="https://github.com/erikbern/d3-3d/blob/master/d3-3d.js#L14">see code</a>). Math porn:</p>
<p>$$ R = \begin{pmatrix} 1 & 0 & 0 \ 0 & \cos(\alpha) & -\sin(\alpha) \ 0 & \sin(\alpha) & \cos(\alpha) \end{pmatrix} \begin{pmatrix} \cos(\beta) & 0 & \sin(\beta) \ 0 & 1 & 0 \ -\sin(\beta) & 0 & \cos(\beta) \end{pmatrix} \begin{pmatrix} \cos(\gamma) & -\sin(\gamma) & 0 \ \sin(\gamma) & \cos(\gamma) & 0 \ 0 & 0 & 1 \end{pmatrix} $$</p>
<p> </p>
<p>Now going forward we can use the matrix $$ R $$ to rotate any vector $$ \mathbf{v} $$ (<a href="https://github.com/erikbern/d3-3d/blob/master/d3-3d.js#L25">see code</a>).</p>
<p>The other thing you want to do is to make distant objects look further away. Thinking through proportionalities you can derive a pretty simple equation (<a href="https://github.com/erikbern/d3-3d/blob/master/d3-3d.js#L31">see code</a>). $$ x� = x / (z/d + 1) $$ , and same for $$ y $$ . The constant $$ d $$ is just a hack to scale down the $$ z $$ values.</p>
<p>Not sure whether the 3D animation is cool or just annoying, but I'll prob keep it for a bit – enjoy!</p>
The hardest challenge about becoming a manager2015-06-05T00:00:00Zhttps://erikbern.com/2015/06/05/the-hardest-challenge-about-becoming-a-manager.html<p>Note: this post is full of pseudo-psychology and highly speculative content. Like most fun stuff!</p>
<p>I became a manager back in 2009. Being a developer is fun. You have this very tangible way to measure yourself. Did I deploy something today? How much code did I write today? Did I solve some really cool machine learning problem on paper?</p>
<p>But as 1:1's and emails and architecture discussions started filling up my day I often walked home with this gnawing feeling of having accomplished nothing. I saw my team build and deploy some really cool stuff, but I had this sort of guilt as if I was pretty useless.</p>
<p>To feel better about myself, I started coding more. But I noticed when I started coding it was like smoking crack. I couldn't stop doing it. I would come in at 9am thinking about some fun problem, then get completely sucked into it. I would find myself at 9pm drinking Red Bull deep in some highly optimized C++ latent factor model. That felt great until I realized I had missed a bunch of 1:1's and had 43 unread emails in my inbox.</p>
<p><img src="https://erikbern.com/assets/2015/06/tumblr_n44tmpqcn31sv7laoo1_500.gif" alt="image"></p>
<p>I think what happens in your brain is you create all these proxies for accomplishments that take years to retrain. I would be incredibly costly if every action was judged in terms of its benefits amortized over your entire life time. Instead, we humans have an ability to invent pretty arbitrary proxies, such as getting high scores on exams, or in my case, write shitloads of code.</p>
<p>Proxies are great because they let you make decisions much quicker. If I have decided that it's good for me to write code, then I will start doing it, and eventually feel great about it. After a few years of doing something very consciously (<em>programming is good because I can build this cool game and show it to my friends</em>) you build up this great rewards system (kind of like Pavlov's dogs?) that makes you feel good about it in itself (<em>programming is cool because I feel good when I do it</em>).</p>
<p>The problem is when your ultimate goal changes and your old proxies are still in effect. You <em>rational</em> side might tell you: hey, look at you, you're team is really happy, they are learning new stuff, and delivering lots of stuff. But still, you have this really weird feeling that you are not getting <em>anything useful</em> done.</p>
<p>This took me literally <em>years</em> to retrain. I remember at some point I saw someone in my team that did something unexpectedly impressive and I got really excited. I got excited because I realized this person had grown tremendously since joining, and presumably some small fraction of it was due to me. With enough exposure finally this starts to be the new proxy for delivering value. Something the <em>irrational</em> side immediately detects and makes you feel a sense of accomplishment about.</p>
<p>Anyway… once an addict, always an addict. I still have relapses and fall back into programming sometimes. In general I've noticed it's <em>extremely</em> hard to balance and try to do 50-50 development and management. Basically one of the sides take over until it's 90-10. Either you start coding and you fall back to your old crack habits. Or you manage to break out of it, and you go into this opposite mode where you just don't have the energy to go into the zone.</p>
<p>I don't know what my conclusion is. Programmers are the most irrational people I know and I think they are really driven by more of a irrational, <a href="http://en.wikipedia.org/wiki/Thinking,_Fast_and_Slow">System 1</a> kind of thinking, the pattern matching brain. That's why I think so many super smart people get stuck in habits (<em>I really want to just solve super cool graph algorithm problems!</em>). The most powerful way to make progress is to put your rational System 2 on and constantly remind the other side what's really making impact and what's really long term beneficial. It takes a few year, but with enough persistence, your rational self can really train the primitive pattern matching brain to feel a sense of accomplishment in doing almost anything.</p>
<p>Sorry for offending anyone with my drug references!</p>
The lane next to you is more likely to be slower than yours2015-05-28T00:00:00Zhttps://erikbern.com/2015/05/28/the-lane-next-to-you-is-more-likely-to-be-slower-than-yours.html<p>Saw this link on Hacker News the other day: <a href="http://www.citylab.com/commute/2015/05/the-highway-lane-next-to-yours-isnt-really-moving-any-faster/394079/">The Highway Lane Next to Yours Isn’t Really Moving Any Faster</a></p>
<p>The article describes a phenomenon unique to traffic where cars spread out when they go fast and get more compact when they go slow. That's supposedly the explanation.</p>
<p>There's a much simpler explanation that works for <em>any</em> queue. Let's consider a supermarket checkout with two lines. One of them has a slow worker and will take 10 minutes. The other one has a fast worker and will take 5 minutes. You don't know which one is which so you pick one at random.</p>
<p>With $$ p=1/2 $$ you will pick the slow one, of course. But let's say you go to this supermarket every day for a year. Here's the interesting thing: on average you will spend $$ 2/3 $$ <em>time in the slow queue.</em> So if you sample any point in time where you are standing in line uniformly, with $$ p=2/3 $$ the other line will be faster.</p>
<p> </p>
<p> </p>
Better precision and faster index building in Annoy2015-05-26T00:00:00Zhttps://erikbern.com/2015/05/26/40-better-precision-and-4x-faster-index-building-in-annoy.html<p>Sometimes you have these awesome insights. A few days ago I got an <a href="https://github.com/spotify/annoy/issues/64">idea</a> for how to improve index building in <a href="https://github.com/spotify/annoy">Annoy</a>.</p>
<p>For anyone who isn't acquainted with Annoy – it's a C++ library with Python bindings that provides fast high-dimensional nearest neighbor search.</p>
<p>Annoy recursively builds up a tree given a set of points. The algorithm so far was: at every level, pick a random hyperplane out of all possible hyperplanes that intersect the convex hull given by the point set. The hyperplane defines a way to split the set of points into two subsets. Recursively apply the same algorithm on each subset until there's only a small set of points left.</p>
<p>A much smarter way is this: <strong>sample two points from the set of points</strong>, compute the hyperplane equidistant to those points, and use this hyperplane to split the point set.</p>
<p>(I just described what happens for Euclidean distance. Angular is almost the same, just slightly simpler).</p>
<p>Implementing this turns makes index building <strong>4x faster</strong> for Euclidean distance. But more importantly, the <strong>search quality is substantially better</strong>, both for angular and Euclidean distance. The difference is particularly large for high dimensional spaces.</p>
<p>I put together <a href="https://github.com/spotify/annoy/blob/master/test/accuracy_test.py">a test</a> that measures precision for nearest neighbor search on the <a href="http://nlp.stanford.edu/projects/glove/">GloVe pretrained vectors</a> using some hardcoded values for various parameters (10 trees, 10 nearest neighbors). See below:</p>
<p><img src="https://erikbern.com/assets/2015/05/annoy-64-angular.png" alt="image"></p>
<p><img src="https://erikbern.com/assets/2015/05/annoy-64-euclidean.png" alt="image"></p>
<p> </p>
<p>This is pretty cool given that the <a href="https://github.com/spotify/annoy/commit/47267bf02cfca40e716956d858857bf6f822615d">commit is actually more red than green</a> – the new algorithm is a lot simpler and I could remove a lot of old stuff that was no longer needed.</p>
<p>The intuitive reason why this works so well is: consider what happens if you have 200 dimensions, but your data is really “mostly” located on a lower dimensional space of say 20 dimensions. Then Annoy will find splits that are more aligned with the distribution of your data. I suspect these cases are pretty common in high dimensional spaces.</p>
<p>I also fixed another <a href="https://github.com/spotify/annoy/commit/0c062cf1951f4539b49454fbeb8853e417a5d524">randomness issue</a> that looked pretty severe (although I think in practice it didn't cause any issues) and added a unit tests that runs the f=25 test shown above in the graphs.</p>
<p>There is a fresh 1.3.1 version out on <a href="https://pypi.python.org/pypi/annoy">PyPI</a> and <a href="https://github.com/spotify/annoy">Github</a> – get it while it's hot!</p>
Annoy – now without Boost dependencies and with Python 3 Support2015-05-03T00:00:00Zhttps://erikbern.com/2015/05/03/annoy-now-without-boost-dependencies-and-with-python-3-support.html<p><img src="https://erikbern.com/assets/2015/05/ann.png" alt="image"></p>
<p><a href="https://github.com/spotify/annoy">Annoy</a> is a C++/Python package I built for fast approximate nearest neighbor search in high dimensional spaces. Spotify uses it a lot to find similar items. First, matrix factorization gives a low dimensional representation of each item (artist/album/track/user) so that every item is a k-dimensional vector, where k is typically 40-100. This is then loaded into an Annoy index for a number of things: fast similar items, personal music recommendations, etc.</p>
<p>Annoy stands for <em>Approximate Nearest Neighbors something something</em> and was originally open sourced back in 2013, although it wasn't entirely well-supported until last year when I fixed a couple of <a href="https://github.com/spotify/annoy/issues/13">crucial bugs</a>. Subsequently, <a href="http://dirk.eddelbuettel.com/">Dirk Eddelbuettel</a> released <a href="https://github.com/eddelbuettel/rcppannoy">RCppAnnoy</a>, an R version of Annoy.</p>
<p>The key feature of Annoy is that it supports file-based indexes that can be <a href="http://en.wikipedia.org/wiki/Mmap">mmapped</a> very quickly. This makes it very easy to share indexes across multiple processes, load/save indexes, etc.</p>
<p>I built the original version of Annoy using <a href="http://www.boost.org/doc/libs/1_58_0/libs/python/doc/index.html">Boost Python</a> but a bunch of people have complained that it's pretty <a href="http://www.pyimagesearch.com/2015/04/27/installing-boost-and-boost-python-on-osx-with-homebrew/">hard to install</a>. Additionally, Boost Python doesn't support Python 3.</p>
<p>Last weekend I decided to fix it. I have something to confess. I've been meaning to address the Boost dependency for a long time, but never found the time to do it. Finally I just put up an ad on <a href="https://www.odesk.com/o/jobs/job/_~01db2e6798bfc36441/">Odesk</a> and outsourced the whole project. I found a <a href="https://github.com/dvenum">great developer</a> who built it all in a few hours.</p>
<p>It might seem ironic to outsource open source projects since I don't get payed for it. But I spend time working on open source projects because it gives me things back in many ways – networking, recognition, some sort of fuzzy altruistic feeling of having contributed. I don't mind spending a few bucks on it, same way as I don't mind spending time on it.</p>
<p>The results is, Annoy <a href="https://github.com/spotify/annoy/issues/43">doesn't depend on Boost</a>, and now has <a href="https://github.com/spotify/annoy/issues/46">Python 3 support</a>. Grab the new version from Github/<a href="https://pypi.python.org/pypi/annoy">PyPI</a> and Please let me know if you run into any issues!</p>
Ping the world2015-04-26T00:00:00Zhttps://erikbern.com/2015/04/26/ping-the-world.html<p>I just pinged a few million random IP addresses from my apartment in NYC. Here's the result:</p>
<p><img src="https://erikbern.com/assets/2015/04/nyc.png" alt="image"></p>
<p>Some notes:</p>
<ul>
<li>What's going on with Sweden? Too much torrenting?</li>
<li>Ireland is likewise super slow, but <em>not</em> Northern Ireland</li>
<li>Eastern Ukraine is also super slow, maybe not surprising given current events.</li>
<li>Toronto seems screwed too, as well as part of NH and western PA.</li>
<li>Russia has <em>fast</em> internet.</li>
</ul>
<p>The world:</p>
<p><img src="https://erikbern.com/assets/2015/04/world.png" alt="image"></p>
<p><strong>Some more notes on methodology</strong></p>
<ul>
<li>The source code <a href="https://github.com/erikbern/ping">is here</a>.</li>
<li>It's based on a 50 nearest neighbor average with the top 10% outliers removed.</li>
<li>Almost all random pings time out, so this is skewed towards the few (<10%) of hosts that actually respond</li>
<li>Some gaps of the map are filled out too much from neighbors. Eg. North Korea.</li>
<li>When computing nearest neighbors it's much easier if you convert everything to 3D vectors first. I used <a href="https://github.com/spotify/annoy">Annoy</a> in 3D for nearest neighbors. Annoy is a Python module (written by me) that does fast approximate nearest neighbors using random projections.</li>
<li><a href="http://matplotlib.org/basemap/">Basemap</a> is kind of a pain in the ass to install and mess around with, but gives nice plots.</li>
<li>I was pinging using subprocess from Python and threads. Really want to give Go a shot on this as a way to learn it.</li>
</ul>
Black Box Machine Learning in the Cloud2015-04-22T00:00:00Zhttps://erikbern.com/2015/04/22/black-box-machine-learning-in-the-cloud.html<p><img src="https://erikbern.com/assets/2015/04/black-cloud-4g9h.jpg" alt="image"></p>
<p>There's a bunch of companies working on machine learning as a service. Some old companies like <a href="https://cloud.google.com/prediction/docs">Google</a>, but now also <a href="http://aws.amazon.com/machine-learning/">Amazon</a> and <a href="http://azure.microsoft.com/en-us/services/machine-learning">Microsoft</a>.</p>
<p>Then there's a ton of startups: <a href="http://prediction.io/">PredictionIO</a> ($2.7M funding), <a href="https://bigml.com/">BigML</a> ($1.6M funding), <a href="http://www.clarifai.com/">Clarifai</a>, etc, etc. Here's a <a href="http://www.bloomberg.com/company/content/uploads/sites/2/2014/12/machine-learning-jpeg.jpg">nice map</a> from Bloomberg showing some of the landscape.</p>
<p>As much as I love ML, I'm not super bullish on these companies. I wrote a pretty cynical tweet the other day</p>
<p><img src="https://erikbern.com/assets/2015/04/Screen-Shot-2015-04-14-at-10.42.31-PM.png" alt="image"></p>
<p>Instead of the negative let's go through the ways I think a machine learning API can actually be useful (ok full disclosure: I don't think it's very many)</p>
<p><strong>Does it solve an immediate business problem?</strong></p>
<p>In ML dreamtown, an engineer realizes one day: “Hey, I have all these feature vectors, and these target values, and a loss function, I just wish someone could approximate a function for me”.</p>
<p>In reality, ML problems are often super messy, and it can be pretty challenging to get from data into a regression/classification problem (or anything else). Model fitting isn't the issue, <em>getting to model fitting</em> is the hard part. Here is a bunch of real-world scenarios I worked with over the last years:</p>
<ol>
<li>Ad targeting based on music consumption. This is a very ill-defined problem and we need to figure out what we really want to solve.</li>
<li>Predict churn. We can build this complex model that takes user features and predict whether they are going to churn out. The resulting model is generally not that useful though – it doesn't give us any actionable insight.</li>
<li>Predict ad clickthrough rate. Yes – we can take historical data and train a binary classifier, but it suffers from a lot of issues (such as observation bias, feedback loops, etc).</li>
</ol>
<p><strong>Does it focus on a particular niche?</strong></p>
<p>It's a lot more likely you solve an immediate business need if you focus on a specific niche. Natural language processing for sales people? I don't know.</p>
<p>Focusing on a particular niche makes it easier to build something that works off the shelf. A general purpose outlier detection is not as useful as a model to detect insurance fraud.</p>
<p>**Does it build on proprietary data sets? **</p>
<p>If you have amassed enormous troves of security footage, or aerial photography, or financial data, or whatever, then you can train a model that <em>no one else can train</em>. You can then sell this model for lots of money, because the cost of building up this data set is a huge barrier for anyone else.</p>
<p><strong>Is there secret sauce?</strong></p>
<p>Remember that trying to build something secret you are up against about 10,000 machine learning researchers in academia who spend all their time trying to come up with new methods. It's true that lots of machine learning has a bit of a gap between academia an industry. But this is just things that are <em>hard and messy.</em> That's not a defensible asset in the long run.</p>
<p>Convolutional neural networks for instance. It's still pretty messy to get <a href="http://deeplearning.net/software/theano/">Theano</a> or <a href="http://torch.ch/">Torch</a> working – I know because I spent a lot of time reading papers and documentation to get a simple image classifier working. But the complexity of this is going to go down very quickly. In a year's time there will be open source libraries with pre-trained models for image classification that are on par with anything you can get through an API (probably better).</p>
<p><strong>Does it solve infrastructural issues?</strong></p>
<p>Scaling applications is still a hard problem. Similarly the use of GPU's in deep learning creates an artificial barrier for many companies who don't want to deal with Amazon instances etc – there is some value in abstracting this away from users.</p>
<p>The question is what companies have problems that require large scale machine learning that <em>don't</em> have problems that require scalability.</p>
<p><strong>Do you have smart people?</strong></p>
<p>I actually think the biggest upside in many of these companies is the possibility of acqui-hire. It's no secret that machine learning engineers are high in demand. So maybe the best strategy is try to attack some super hard problem, ignore whether it's actually useful, and hire as many smart people as possible.</p>
<p> </p>
<p> </p>
It's called Berkson's paradox!2015-04-09T00:00:00Zhttps://erikbern.com/2015/04/09/its-called-berksons-paradox.html<p>As noted by <a href="https://twitter.com/davidandrzej/status/585940491927027712">multiple</a> <a href="https://twitter.com/JSEllenberg/status/585959375769972736">tweets</a>, my previous post describes a phenomenon denoted <a href="http://en.wikipedia.org/wiki/Berkson%27s_paradox">Berkson's paradox</a>.</p>
<p>Here's another example: <a href="http://www.slate.com/blogs/how_not_to_be_wrong/2014/06/03/berkson_s_fallacy_why_are_handsome_men_such_jerks.html">Why Are Handsome Men Such Jerks?</a></p>
Norvig's claim that programming competitions correlate negatively with being good on the job2015-04-07T00:00:00Zhttps://erikbern.com/2015/04/07/norvigs-claim-that-programming-competitions-correlate-negatively-with-being-good-on-the-job.html<p>I saw a bunch of tweets over the weekend about Peter Norvig <a href="http://www.catonmat.net/blog/programming-competitions-work-performance/">claiming there's a negative correlation</a> between being good at programming competitions and being good at the job. There were some decent <a href="https://news.ycombinator.com/item?id=9324209">Hacker News comments</a> on it.</p>
<p>Norvig's statement is obviously not true if we're drawing samples from the general population – most people can't code. It doesn't necessarily even have to do with time allocation as this commenter alluded to:</p>
<blockquote>
<p>Being a champion at something requires excruciating narrow focus on something for unusually long time. If you are getting GPA of 4.0 or play Rachmaninoff's Piano Concerto No 3 or deadlift 400 pounds or in top 1000 chess players – you probably have to work on it for hours a day for years while ignoring everything else (of course unless you are one of those 1 in million polymath).</p>
</blockquote>
<p>Here's the real reason: <em>Google is already selecting for the top 1% programmers using some criteria, leading to selection bias. Even if the two values are positively correlated, you might have a selection criterion that leads to a negative correlation.</em></p>
<p>But let's start with the ideal case. Let's say there's a slight positive correlation between “being good at programming competitions” and “what really matters”. Let's assume Google hires perfectly. Let's assume everyone is on a multivariate Gaussian:</p>
<p><img src="https://erikbern.com/assets/2015/04/recruiting_perfect.png" alt="image"></p>
<p> </p>
<p>For all the people that were <em>hired</em>, I calculate the correlation between “Programming competition skills” and “What really matter”. The correlation for hired people is almost 0.2 and it's still positive!</p>
<p>However let's say Google for some reason puts <em>too much weight</em> on programming competitions during the interviews. We now get a negative correlation!</p>
<p><img src="https://erikbern.com/assets/2015/04/recruiting_bad.png" alt="image"></p>
<p>Does this mean it's bad to hire people who are good at programming competition? No, it just means that we probably overweighted it during the hiring process. If we lower the weight a bit we get something a positive correlation again:</p>
<p><img src="https://erikbern.com/assets/2015/04/recruiting_medium.png" alt="image"></p>
<p>But in general does it mean we should never look at programming competition skills? Actually the reality is a lot more complicated. Instead of observing what really matters, you observe some crappy proxy for it. And when all metrics is noisy, you should put some nonzero positive weight on any metric that correlate positively with your target. Just not too much!</p>
<p><img src="https://erikbern.com/assets/2015/04/recruiting_realistic.png" alt="image"></p>
<p>Sorry for spamming you with scatter plots, but it's in the name of statistics! My point here is that you can tweak these variables and <em>end up seeing correlations with pretty much any value</em>. So when you have these complex selection biases you need to be super careful about how to interpret the data. It's a great reminder that studies like <a href="http://www.thestreet.com/story/12328981/1/googles-project-oxygen-pumps-fresh-air-into-management.html">Project Oxygen</a> always need to be taken with a bucket of sea salt.</p>
<p>Are there other examples of selection biases leading to spurious correlations? Let me know!</p>
<p> </p>
Pinterest open sources Pinball2015-03-14T00:00:00Zhttps://erikbern.com/2015/03/14/pinterest-open-sources-pinball.html<p><img src="https://erikbern.com/assets/2015/03/41Pz5ClQ46L._SY300_.jpg" alt="image"></p>
<p>Pinterest just open sourced <a href="https://github.com/pinterest/pinball">Pinball</a> which seems like an interesting <a href="https://github.com/spotify/luigi">Luigi</a> alternative. There's two blog posts: <a href="http://engineering.pinterest.com/post/74429563460/pinball-building-workflow-management">Pinball: Building workflow management</a> (from 2014) and <a href="http://engineering.pinterest.com/post/113376157699/open-sourcing-pinball">Open-sourcing Pinball</a> (from this week). The author has a comment in the <a href="https://news.ycombinator.com/item?id=9189196">comments thread</a> on Hacker News:</p>
<blockquote>
<p>Luigi was not available in public, when Pinball starts. So not sure the pros and cons between Pinball and Luigi.</p>
<p>When we build pinball, we aim to build a scalable and flexible workflow manager to satisfy the the following requirements (I just name a few here).</p>
<ol>
<li>easy system upgrade – when we fix bug or adding new features, there should be no interruption for current running workflow and jobs.</li>
<li>easy add/test workflow – end user can easily add new jobs and workflows into pinball system, without affecting other running jobs and workflows.</li>
<li>extensibility – a workflow manager should be easy to extended. As the company and business grows, there will be a lot new requirements and features needed. And also we love your contributions as well.</li>
<li>flexible workflow scheduling policy, easy failure handling.</li>
<li>We provide rich UI for you to easily manage your workflows – auto retry failed job, – you can retry failed job, can skip some job, can select a subset of jobs of a workflow to run (all from UI) – you can easily access all the running history of your job, and also get the stderr, stdout logs of your jobs – you can also explore the topology of your workflow, and also support easy search.</li>
<li>Pinball is very generic can support different kind platform, you can use different hadoop clusters,e.g., quoble cluster, emr cluster. You can write different kind of jobs, e.g., hadoop streaming, cascading, hive, pig, spark, python …</li>
</ol>
<p><span style="color: #000000;">There are a lot interesting things built in Pinball, and you probably want to have a try!</span></p>
</blockquote>
<p>Sounds pretty similar to Luigi! My initial impression is that</p>
<ul>
<li>The <a href="https://github.com/pinterest/pinball/blob/master/ARCHITECTURE.rst">architecture</a> is a bit more advanced than Luigi and has some features that Luigi lacks. From what I can tell, it comes with task storage out of the box (whereas Luigi's task history DB is still not entirely integrated), distributed execution, and a triggering mechanism. These are all areas where Luigi still needs some love</li>
<li>The workflow API seems <a href="https://github.com/pinterest/pinball/tree/master/tutorial/example_repo">very convoluted</a>. I don't really understand how the code works and there's a lot of boiler plate.</li>
</ul>
<p>Fun to have something to compare to. Not that I want to rationalize Luigi's missing features, but in general I would argue that the importance of good API design is underrated compared to good architecture. I still believe the key thing for a workflow manager is to reduce boiler plate and configuration at any point. It's slightly harder to create an easy to use API than to think hard about architecture and check all the boxes for every feature.</p>
<p><img src="https://erikbern.com/assets/2015/03/powering-interactive-data-analysis-at-pinterest-by-amazon-redshift-3-638.jpg" alt="image"></p>
<p>Hopefully we'll see more of these in the future. Obviously being Luigi's author, I think Luigi is an awesome tool. But I think it's 10% of what it could be, and diversity in this space is great for innovation. There's a lot of them now: <a href="http://oozie.apache.org/">Oozie</a>, <a href="http://azkaban.github.io/">Azkaban</a>, <a href="https://github.com/factual/drake">Drake</a>, <a href="https://github.com/pinterest/pinball">Pinball</a>, etc. Some people apparently use <a href="http://jenkins-ci.org/">Jenkins</a> for workflow management. A wildcard I encountered the other day is <a href="https://github.com/hammerlab/ketrew">Ketrew</a>. I wish I knew enough OCaml to understand what's going on!</p>
The relationship between commit size and commit message size2015-02-26T00:00:00Zhttps://erikbern.com/2015/02/26/the-relationship-between-commit-size-and-commit-message-size.html<p><img src="https://erikbern.com/assets/2015/02/Screen-Shot-2015-02-24-at-8.56.35-PM.png" alt="Screen Shot 2015-02-24 at 8.56.35 PM" width="585" height="241" class="alignnone size-full wp-image-1100" /></p>
<p>Wow I guess it was more than a year ago that I tweeted this. Crazy how time flies by. Anyway, here's my rationale:</p>
<ul>
<li>When I update one line of code I feel like I have to put in a long explanation about its side effects, why it's fully backwards compatible, and why it fixes some issue #xyz.</li>
<li>When I refactor 500 lines of code, I get too lazy to write anything sensible, so I just put “refactoring FooBarController”. Note: <em>don't do at home!</em></li>
</ul>
<p>I decided to plot the relationship for <a href="https://github.com/spotify/luigi">Luigi</a>:
{% include 2015-02-26-the-relationship-between-commit-size-and-commit-message-size.html %}</p>
<p>The plot is clickable! Check it out! It's an old school <a href="http://en.wikipedia.org/wiki/Image_map#Pure_HTML">image map</a> which is pretty pathetic, since no one has used it since 1997, but it was just so much easier for this task. Hover over any point to see the commit message and click on it to jump to the commit on Github.</p>
<p>As you can see, there's essentially <em>no relationship</em> between the two values. Not as spectacular as I was hoping for, but still kind of weird/interesting.</p>
<p>Code <a href="https://gist.github.com/erikbern/0f347c8d789402a09f2e">is here</a> if you're curious!</p>
My favorite management failures2015-02-22T00:00:00Zhttps://erikbern.com/2015/02/22/my-favorite-management-failures.html<p>For most people straight out of school, work life is a bit of a culture shock. For me it was an awesome experience, but a lot of the constraints were different and I had to learn to optimize for different things. It wasn't necessarily the technology that I struggled with. The hardest part was how to manage my own projects and my time, as well as how to grow and make impact as an engineer. I've listed some of my biggest mistakes, which are also mistakes I see other (mostly junior) engineers make.</p>
<p> </p>
<p><strong>Having the wrong scope</strong></p>
<p>How do you know what's the right amount of work to spend on a project? I had horrible intuition about this coming out of school. One thing I think is helpful is to think of the relationship between time spent and impact. For a given project, it looks something like this:</p>
<p><img src="https://erikbern.com/assets/2015/02/time-impact.png" alt="image"></p>
<p>It usually ends up being a <a href="http://en.wikipedia.org/wiki/Concave_function">concave</a> function.</p>
<p>How do you pick a point on this curve? If you only have one task then it's usually pretty easy because you have some constraint on total time or total impact. In school usually you work on some task until it hits a certain y value (problem is solved) or until it hits a certain x value (time to turn in what you have).</p>
<p>The problem is in real life you actually need to pick not just one point on one curve but a points on each <em>many</em> curves. Actually an <em>infinite</em> number of curves. And you need to pick these points subject to the constraint that you get the maximum value per time invested.</p>
<p><img src="https://erikbern.com/assets/2015/02/time-impact-2-copy.png" alt="image"></p>
<p> </p>
<p>This is a much harder problem! It means the amount of time we spend on task A is actually determined not just by how hard task A is but how hard an <em>infinite</em> number of other tasks are.</p>
<p>Let's get mathematical here: for this concave optimization problem you can show that the <em>marginal impact of each task should be identical</em>. (I really want to write a book some day called <em>The Mathematics of Project Management</em>)</p>
<p><img src="https://erikbern.com/assets/2015/02/time-impact-31.png" alt="image"></p>
<p>This means: recognize when the marginal impact of spending more time on a project starts to get low and you get more marginal impact elsewhere. Or just think: is this already good enough to deliver user value? Then take a break and look at the whole portfolio of possible task: ignoring what I have done so far, what's the highest impact next thing I can do?</p>
<p><strong>Focusing only on the things you are supposed to focus on</strong></p>
<p>This might sound weird. What are you supposed to do at work? Most of the time you should probably do what your team/manager told you to do. But guess what? Your team/manager is not an all-seeing all-knowing oracle. Sometimes you might actually have a better idea of what to do.</p>
<p>Your sole purpose of working somewhere is to <em>deliver value for the company</em>. Completing a task from the backlog is a great proxy for that. But it's still a proxy and as such has no intrinsic value. In many cases there might be even higher leverage things that no one will tell you to do. For instance, look around you. Is the team struggling with some old framework? Can you help someone get unblocked?</p>
<p>I like people to come in every morning and ask themselves: <em>what is the highest impact thing I can do to for the company today?</em> And do that. If you think about it, task backlogs is a completely artificial construct needed because we don't have perfect information.</p>
<p>This gets especially important if you are interested in management roles. The higher up you get, the less people are going to tell you what to do.</p>
<p>Silly obligatory visualization:</p>
<p><img src="https://erikbern.com/assets/2015/02/things-to-do.png" alt="image"></p>
<p><strong>Focusing only on low-leverage activities</strong></p>
<p>There's only that much leverage you get by being an individual contributor. Even if you're a 10x engineer. Look around you for things with a force multiplier built in. Usually that means applying something to the entire team. Are you using the wrong language for the tool? Spend a few days investigating something else, introduce it to the team, and watch the whole team move twice as fast.</p>
<p><img src="https://erikbern.com/assets/2015/02/Screen-Shot-2015-02-22-at-1.32.23-PM.png" alt="image"></p>
<p>I used to work with <a href="https://twitter.com/sinisa_lyh">Neville Li</a> at Spotify who was a genius at finding these opportunities. He also never did what you told him to. Instead, he would spend days reading blogs and trying new technologies. Every few months he would find something that made the whole team 2x as much productive. Then he would organize a workshop, introduce it to the team, and move on.</p>
<p><strong>Not realizing technology isn't just a job</strong></p>
<p>This is probably my most cynical note, or optimistic, depending on how you look at it.</p>
<p>The truth is, software engineering isn't just a normal job. It's a life style. It's also a field that keeps changing from year to year. If you want to be successful, you need to stay up to date. If you want to be above average, you need to do things like:</p>
<ul>
<li>Working on side projects</li>
<li>Reading tech blogs</li>
<li>Following influencers on Twitter</li>
<li>Going to meetups</li>
<li>Reading papers</li>
<li>Etc</li>
</ul>
<p>Being a software engineer is a fantastic career in many ways. With lots of freedom comes a lot of responsibilities. If you want to stay fresh, you need to invest a fair amount of your spare time.</p>
<p><strong>Not drawing diagrams on glass walls</strong></p>
<p>This is a no-brainer. Everyone knows that solid software engineers work draw everything on glass walls. And they also write everything flipped horizontally because it's cooler.</p>
<p><img src="https://erikbern.com/assets/2015/02/cloud.jpg" alt="image"></p>
<p><strong>Summary</strong></p>
<p>I love technology. Go write some kick ass code now.</p>
<p> </p>
Leaving Spotify2015-02-11T00:00:00Zhttps://erikbern.com/2015/02/11/leaving-spotify.html<p>Febrary 6 was my last day at Spotify. In total I spent more than six years at Spotify and it was an amazing experience.</p>
<p>I joined Spotify in Stockholm in 2008, mainly because a bunch of friends from programming competitions had joined already. Their goal to change music consumption seemed ridiculous at that point, but six years later I think it's safe to say they actually succeeded.</p>
<p>Back in the early days, my job was to do almost anything related to data. I think the range of tasks that I was responsible for has now grown into 100+ people at Spotify. My day to day tasks was all over the map: Hadoop maintenance, Powerpoint presentations, label reporting, ran A/B tests, optimized ad delivery, did ad delivery forecasts, built music recommendations, and much more (for most of that time we were actually three people though, not just me).</p>
<p>It was an amazing learning experience to see a company grow this way. I think a company goes through different challenges at every stage, both technically and organizationally (honestly a lot more of the latter compared to the former).<figure id="attachment_1057" style="width: 1024px;" class="wp-caption alignnone"></p>
<p><img src="https://erikbern.com/assets/2015/02/2921097859_a593807084_b.jpg" alt="image"><em>Pushing the button, launching Spotify to the world (late 2008)</em></p>
<p> <figure id="attachment_1062" style="width: 604px;" class="wp-caption alignnone"></p>
<p><img src="https://erikbern.com/assets/2015/02/25763_335297926215_6279776_n.jpg" alt="image"><em>Figuring out the cable situation (2009)</em></p>
<p>I've been craving to go back and go through the same journey again, so I've joined a small startup in NYC as the head of engineering. I will share more details soon. Hopefully this time will be an opportunity to apply all those things I learned at Spotify.</p>
<p><a href="https://twitter.com/OskarStal">Oskar Stål</a>, the CTO of Spotify and a great mentor, would always tell me that I have to decide between machine learning and the “CTO ladder” at some point. I made a conscious decision right now to focus more on management and building teams. I think this might be the topic of some future blog post, but not now.</p>
<p>What's going to happen to my open source projects such as <a href="https://github.com/spotify/luigi">Luigi</a> and <a href="https://github.com/spotify/annoy">Annoy</a>? Nothing should change, except I will have a lot less time to spend on it.</p>
<p>Stay tuned for more updates!</p>
<p> </p>
Scala Data Pipelines for Music Recommendations2015-01-13T00:00:00Zhttps://erikbern.com/2015/01/13/scala-data-pipelines-for-music-recommendations.html<p><a href="https://twitter.com/MrChrisJohnson">Chris Johnson</a>‘s presentation from <a href="http://datadaytexas.com/">Data Day Texas</a>:</p>
Everything I learned about technical debt2014-12-30T00:00:00Zhttps://erikbern.com/2014/12/30/everything-i-learned-about-technical-debt.html<p>I just made it to Sweden suffering from jet lag induced insomnia, but this blog post will not cover that. Instead, I will talk a little bit about <a href="http://en.wikipedia.org/wiki/Technical_debt">technical debt</a>.</p>
<p>The concept of technical debt always resonated with me, partly because I always like the analogy with “real” debt. If you take the analogy really far, there are some curious implications. I always like to think of the “interest rate” of software development. Debt is really just borrowing from the future, with some interest rate. You are getting a free lunch right now, but you need to pay back 1.2 free lunches in a few months. That's the interest rate. In a software project the equivalent could be to pick a database that will have scalability issues later, or to make all member variables of some class public. You are doing it because it makes it easier to do things <em>now</em> but you will have to pay the cost of that later.</p>
<p>A recent paper from Google stretches the analogy in its title: <a href="http://research.google.com/pubs/pub43146.html">Machine Learning: The High-Interest Credit Card of Technical Debt</a>. It focuses specifically on machine learning, but definitely read it if you are interested. A recent blog post challenges if tech debt is really “debt” in the strict sense (you borrow fixed amount and pay back slightly more) or if it has a more complicated structure: <a href="http://www.higherorderlogic.com/2010/07/bad-code-isnt-technical-debt-its-an-unhedged-call-option/">Bad code isn't Technical Debt, it's an Unhedged Call Option</a>.</p>
<p>I like the blog post because it brings up something I have noticed many times. A lot of developers have this intuitive aversion towards tech debt and always want to fix anything that's perceived as “hacky”. <em>FooBarController is a 1,000 line mayhem that no one understands, we need to refactor it!</em> But say FooBarController is a well separated component that you have no intent on ever modifying, then there's really no reason to fix it. It's almost always a waste of time to try to fix bad code or bad architecture unless you at least some idea of why it helps you in the future.</p>
<p>So in some cases it makes sense not to fix technical debt. In other cases, it makes sense to take on tech debt deliberately. Back to the interest rate analogy: if the interest rate is lower than the return of investment, you <em>should borrow money from the bank.</em> It's fine to ship a product a year earlier with a hacky code, if you make a lot of money, and hire a ton of developers to clean it up. The concept of interest rate applies both to financing and software engineering.</p>
<p>In my experience, the biggest issues isn't taking on technical debt or not. As long as you make a conscious decision to take on tech debt, and everyone agrees it's tech debt that you might need to fix later, you're in the clear. <strong>You will get problems if you build up technical debt without acknowledging it.</strong> I made a chart to make it clear:</p>
<table style="vertical-align: top;">
<tr>
<th>
</th>
<pre><code><th>
</th>
<th colspan="2">
Do you think you are taking on tech debt?
</th>
</code></pre>
</tr>
<tr>
<th>
</th>
<pre><code><th>
</th>
<th>
No
</th>
<th>
Yes
</th>
</code></pre>
</tr>
<tr>
<th rowspan="2">
Are you taking on tech debt?
</th>
<pre><code><th>
No
</th>
<td>
Ok, cool
</td>
<td>
Don't worry so much!
</td>
</code></pre>
</tr>
<tr>
<th>
Yes
</th>
<pre><code><td>
<a href="/assets/2014/12/sopranos.png"></a>
</td>
<td>
<a href="/assets/2014/12/bank-loan.png"></a>
</td>
</code></pre>
</tr>
</table>
<p>The bottom left picture is <a href="http://en.wikipedia.org/wiki/Tony_Soprano">Tony Soprano</a> knocking on your door because he's here to collect the debt you owe him. What happened is, you saw this investment (real estate?) that you thought would appreciate 10% year on year. You borrowed money from Tony, but you never realized you might have to pay it back. It turns out the interest rate was a lot more hefty than you thought, and now he wants it back a year later with 50% interest rate.</p>
<p>The bottom right picture is you going to the bank because you want to buy real estate. You examine the interest rates and make a decision to get a mortgage.</p>
<p>These pictures might not illustrate the point super well, because the bottom right also covers this situation: <strong>borrowing at a high interest rate because the return on investment is even higher</strong>. Maybe you know of this boxing match that's already rigged, and it's 5:1 odds. You won't be able to borrow money from the bank, so you go to Tony Soprano and borrow it for a few days. Next week, you pay it back with some interest, but you still made a ton of money.</p>
<p>Back to software engineering. The example above is like shipping the v2.0 of your web shop on time, and it turns out to be much better for users. You sell twice as much now! But you also have a bunch of scripts you have to run manually every day. You clearly should automate those scripts later, and it might be <em>really</em> messy to do so, but it's also clear that <em>you can do that later</em>. You made a deliberate decision to borrow some resources from the future, because the return of your investment was really high.</p>
<p> </p>
I already found the best gifs2014-12-28T00:00:00Zhttps://erikbern.com/2014/12/28/i-already-found-the-best-gifs.html<p>Just search for “<a href="https://www.google.com/search?q=hackers+gif&safe=off&espv=2&biw=1289&bih=706&source=lnms&tbm=isch&sa=X&ei=_FSfVJfWKYuVNvJK&ved=0CAgQ_AUoAQ">hackers gif</a>“.</p>
<p><img src="https://erikbern.com/assets/2014/12/hackers-the-plague-1.gif" alt="image"></p>
<p><img src="https://erikbern.com/assets/2014/12/hackers-gif-preparing-to-hack.gif" alt="image"></p>
<p><img src="https://erikbern.com/assets/2014/12/hackers-mathew-lillard.gif" alt="image"></p>
<p>There you go. Fun for your work emails for the next 500 years. From the awesome movie <a href="http://www.imdb.com/title/tt0113243/">Hackers</a>. That movie together with <a href="http://www.imdb.com/title/tt0080120/">The Warriors</a> convinced me that I wanted to live in NYC when I was like… 14 years old.</p>
A brief history of Hadoop at Spotify2014-12-20T00:00:00Zhttps://erikbern.com/2014/12/20/a-brief-history-of-hadoop-at-spotify-2008-2009.html<p>I was talking with some data engineers at Spotify and had a moment of nostalgia.</p>
<p><strong>2008</strong></p>
<p>I was writing my master's thesis at Spotify and had to run a Hadoop job to extract some data from the logs. Every time I started running the job, I kept hearing this subtle noise. I kept noticing the correlation for a few days but I was too intimidated to ask. Finally people starting cursing that their machines had gotten really slow lately and I realized <em>we were running Hadoop on the developer's desktop machines</em>. No one had told me. I think back then we had only GB's of log data. I remember running <em>less</em> on the log and I would recognize half the usernames because they were my friends.</p>
<p><strong>2009</strong></p>
<p>We took a bunch of machines and put them on a pallet in the foosball room. It was a super hot Swedish summer and I kept running this matrix factorization job in Hadoop that would fail halfway through. The node on the top of the pile would crash and you had to reboot it. I suspected overheating. We had a fan running in the room but it wasn't helping. Finally I realized the problem was the sun was shining in through the window.<figure id="attachment_994" style="width: 1600px;" class="wp-caption alignnone"></p>
<p><img src="https://erikbern.com/assets/2014/12/Old_Hadoop_cluster1.jpeg" alt="image"><em><a href="https://twitter.com/jooon">Jon Åslund</a> with our Hadoop cluster</em></p>
<p>I found a big sheet or blanket and some nails and a hammer and put it up over the window. I was finally able to run my matrix factorization job to completion after doing this. This is probably going to be my favorite bug fix until the day I die.</p>
<p>In the summer of 2009, we installed a 30-node Hadoop cluster in our data center in Stockholm. Finally a “real” cluster.</p>
<p><strong>2011</strong></p>
<p>More and more people started using Hadoop so we decided to move to Elastic Mapreduce. I uploaded all our logs to S3 and we put together some tooling so that you could run things on our own Hadoop cluster or on EC2 using the same source code. It was pretty beautiful but the performance wasn't super great compared to how much we were paying.</p>
<p>Later in 2011 we had grown even more. We decided to move back to our own data center. We installed 500 nodes in our data center in London, later upgrading it to 700 and then 900 nodes.<figure id="attachment_1005" style="width: 612px;" class="wp-caption alignnone"></p>
<p><img src="https://erikbern.com/assets/2014/12/droppedImage1.png" alt="image"><em>Our fifth Hadoop cluster</em></p>
<p>I also implemented Luigi as a workflow engine with Mapreduce support in late 2011.</p>
<p><strong>2012</strong></p>
<p>There was this long-standing assumption (at least I had) that Hadoop jobs were I/O bound and thus the language didn't matter. We were using Python for probably 95% of all jobs, with some stuff in Hive by the analytics team. During 2012 and forward, we started realizing Python isn't the ideal language, both from a performance and usability point of view. Eventually we would end up switching to <a href="https://crunch.apache.org/">Crunch</a> and <a href="https://github.com/twitter/scalding">Scalding</a>. We still use Luigi as the workflow engine to glue everything together.</p>
<p>This is a super simplified history of everything that took place. <a href="https://twitter.com/L_phant">Josh Baer</a> and Rafal Wojdyla are talking about the <a href="http://strataconf.com/big-data-conference-ca-2015/public/schedule/detail/38595">Evolution of Hadoop at Spotify</a> at Strata in February for the rest of the story!</p>
Luigi Presentation @ NYC Data Science, Dec 16, 20142014-12-17T00:00:00Zhttps://erikbern.com/2014/12/17/luigi-presentation-nyc-data-science-dec-16-2014.html<p>More Luigi presentations!</p>
Luigi talk tomorrow2014-12-16T00:00:00Zhttps://erikbern.com/2014/12/16/luigi-talk-tomorrow.html<p>At <a href="http://www.meetup.com/NYC-Data-Science/events/218604422/">NYC Data Science meetup</a>! Unfortunately the space is full but the talk will be livestreamed – check out the meetup web page for a link tomorrow.</p>
Deep learning for… Go2014-12-11T00:00:00Zhttps://erikbern.com/2014/12/11/deep-learning-for-go.html<p>This is the last post about deep learning for chess/go/whatever. But <a href="http://arxiv.org/abs/1412.3409">this really cool paper</a> by Christopher Clark and Amos Storkey was forwarded to me by <a href="https://twitter.com/meickenberg">Michael Eickenberg</a>. It's about using convolutional neural networks to play Go. The authors of the paper do a much better job than I would ever have done of modeling move prediction in Go and show that their model beat certain Go engines.</p>
<p>The fascinating thing about this paper is that playing against other Go engines, they just plug in their move prediction function, with no deep search beyond one level. That means the total time it spends is a fraction of the opponents. Still, the fact that it plays so well speaks for its strength.</p>
<p>So what happened if we could plug this into a deep search framework? The authors suggest doing exactly that in the conclusion. State of the art of Go engines actually use <a href="http://en.wikipedia.org/wiki/Monte_Carlo_tree_search">Monte Carlo tree search</a> rather than <a href="http://en.wikipedia.org/wiki/Minimax">minimax</a> but other than that, it's the same principle.</p>
<p>I talked a bit with the authors and the main thing that you have to change is to switch from move prediction to an evaluation function. For my chess experiments, I found a (hacky) way to train a function that does both at the same time. There's essentially two terms in my objective function: one is comparing the actual move with a random move, using a sigmoid:</p>
<p>$$ frac{P(q)}{P(q) + P(r)} = frac{exp(f(q))}{exp(f(q)) + exp(f(r))} $$ .</p>
<p>If you extend that to <em>all possible random moves</em> you actually get a full probability distribution (a softmax) over all possible next moves.</p>
<p>$$ P(p rightarrow q) = frac{exp(f(q))}{sum exp(f(r)) } $$ .</p>
<p>Now, how do you “convert” that into an evaluation function? That's the second term, which tries fit the negative parent score to the current score. We penalize the quantity $$ f(p) + f(q) $$ by throwing in two more sigmoids. It's a “soft constraint” that has absolutely no probabilistic interpretation. This a hacky solution, but here's how I justify it:</p>
<ol>
<li>Note that the evaluation functions are unique up to a monotonic transform, so we can actually mangle it quite a lot.</li>
<li>The softmax distribution has one degree of freedom in how it chooses the quantities, so (I'm speculating) the artificial constraint does not change the probabilities.</li>
</ol>
<p>I think you could do the exact thing with their Go engine. In fact I'm willing to bet a couple of hundred bucks that if you did that, you would end up with the best Go engine in the world.</p>
<p>Btw another fun thing was that they plot some of the filters and they seem as random as the ones I learn for Chess. But a clever trick enforcing symmetry seem to help the model quite a lot.</p>
<p><img src="https://erikbern.com/assets/2014/12/Screen-Shot-2014-12-11-at-5.11.32-PM.png" alt="image"></p>
Deep learning for… chess (addendum)2014-12-08T00:00:00Zhttps://erikbern.com/2014/12/08/deep-learning-for-chess-addendum.html<p>My previous blog post about deep learning for chess blew up and made it to Hacker News and a couple of other places. One pretty amazing thing was that the <a href="https://github.com/erikbern/deep-pink">Github repo</a> got 150 stars overnight. There was also lots of <a href="https://news.ycombinator.com/item?id=8685840">comments</a> on the Hacker News post that I thought were really interesting. (See this skeptical <a href="https://news.ycombinator.com/item?id=8687273">comment</a> for instance).</p>
<p>A couple of things came up in several places. I actually fully agree with a lot of the skepticism my blog post got. Here's a bit of clarification + other stuff</p>
<p><strong>My assumption that amateur players make near-optimal moves</strong></p>
<p>Let me retract that statement a bit. But just a little bit. There's several ideas here. The first one is that if 1,000 amateur chess players could vote for the next move, that move is probably pretty strong. There's some anecdotal evidence suggesting that a large amount of amateurs actually, eg. <a href="http://en.wikipedia.org/wiki/Kasparov_versus_the_World">Kasparov vs the World</a>. The cool thing is that training this machine learning model, it will actually <em>learn to pick the move that corresponds to what “most” players would choose.</em> (You can actually see that the probability distribution over all next valid moves are given by a <a href="http://en.wikipedia.org/wiki/Softmax_function">softmax distribution</a> where the $$ z $$ values are given by the evaluation function).</p>
<p>The second idea is that a lot of moves are pretty obvious, because you are forced to do something. The third thing is that almost any move is good compared to a <em>random</em> move.</p>
<p>I think in hindsight it's probably not correct that most moves by amateur players are “near-optimal”, but I don't think it matters for the model.</p>
<p><strong>What does each layer show if you look at it?</strong></p>
<p>I looked at it, but it's pretty much all over the place. Unlike convolutional neural networks, where the first layer often represents edges, there is nothing like that in this network. It seems like the logic is encoded throughout the whole network. Here's the first few coefficients of the first feature (out of the 2048 features in the first layer), ranked in decreasing order of magnitude:</p>
<table>
<tr>
<td>
0.0856
</td>
<pre><code><td>
q @ e7
</td>
</code></pre>
</tr>
<tr>
<td>
-0.0686
</td>
<pre><code><td>
P @ f7
</td>
</code></pre>
</tr>
<tr>
<td>
0.0658
</td>
<pre><code><td>
q @ f6
</td>
</code></pre>
</tr>
<tr>
<td>
0.0657
</td>
<pre><code><td>
P @ d3
</td>
</code></pre>
</tr>
<tr>
<td>
-0.0655
</td>
<pre><code><td>
r @ c6
</td>
</code></pre>
</tr>
<tr>
<td>
0.0650
</td>
<pre><code><td>
N @ e4
</td>
</code></pre>
</tr>
<tr>
<td>
0.0648
</td>
<pre><code><td>
P @ d6
</td>
</code></pre>
</tr>
<tr>
<td>
-0.0625
</td>
<pre><code><td>
r @ e6
</td>
</code></pre>
</tr>
<tr>
<td>
0.0625
</td>
<pre><code><td>
q @ d6
</td>
</code></pre>
</tr>
<tr>
<td>
0.0588
</td>
<pre><code><td>
p @ d7
</td>
</code></pre>
</tr>
</table>
<p>White pieces are upper case, black are lower case. I don't see much going on here.</p>
<p><strong>There is actually at least one paper about using deep neural networks for Go</strong></p>
<p>****Ilya Sutskever and Vinod Nair wrote <a href="http://www.cs.utoronto.ca/~ilya/pubs/2008/go_paper.pdf">this paper</a> in 2008. It even uses convolutional neural networks. It only has about 10k parameters (compared to 10M in my model) but it does something very similar to what I did: it tries to predict the next move of an expert player. I'm not sure why they didn't evaluate playing with it though. I would guess it probably needs a lot more parameters to play well.</p>
<p> </p>
<p> </p>
Deep learning for... chess2014-11-29T00:00:00Zhttps://erikbern.com/2014/11/29/deep-learning-for-chess.html<p>I've been meaning to learn <a href="http://deeplearning.net/software/theano/">Theano</a> for a while and I've also wanted to build a chess AI at some point. So why not combine the two? That's what I thought, and I ended up spending way too much time on it. I actually built most of this back in September but not until Thanksgiving did I have the time to write a blog post about it.</p>
<p><strong>What's the theory?</strong></p>
<p>Chess is a game with a finite number of states, meaning if you had infinite computing capacity, you could actually <a href="http://en.wikipedia.org/wiki/Solving_chess">solve chess</a>. Every position in chess is either a win for white, a win for black, or a forced draw for both players. We can denote this by the function $$ f(\mbox{position}) $$ . If we had an infinitely fast machine we could compute this by</p>
<ol>
<li>Assign all the final positions the value $$ {-1, 0, 1} $$ depending on who wins.</li>
<li>Use the recursive rule</li>
</ol>
<p>$$ f(p) = \max_{p \rightarrow p’} -f(p’) $$</p>
<p>where $$ p \rightarrow p’ $$ denotes all the legal moves from position $$ p $$ . The minus sign is because the players alternate between positions, so if position $$ p $$ is white's turn, then position $$ p’ $$ is black turns (and vice versa). This is the same thing as <a href="http://en.wikipedia.org/wiki/Minimax">minimax</a>.</p>
<p>There's approximately <a href="http://en.wikipedia.org/wiki/Shannon_number">$$ 10^{43} $$ positions</a>, so there's no way we can compute this. We need to resort to approximations to $$ f(p) $$ .</p>
<p><strong>What's the point of using machine learning for this?</strong></p>
<p>What machine learning really boils down to is approximating functions given data. So assuming we can get a lot of data to learn this from, we can learn this function $$ f(p) $$ . Once we have a model, an objective, and training data, we can go knock ourselves out.</p>
<p>I downloaded 100M games from <a href="http://www.ficsgames.org/download.html">FICS Games Database</a> and began training a machine learning model. My function $$ f(p) $$ is learned from data by using two principles</p>
<ol>
<li>Players will choose an optimal or near-optimal move. This means that for two position in succession $$ p \rightarrow q $$ observed in the game, we will have $$ f(p) = -f(q) $$ .</li>
<li>For the same reason above, going from $$ p $$ , not to $$ q $$ , but to a <em>random</em> position $$ p \rightarrow r $$ , we must have $$ f(r) > f(q) $$ because the random position is better for the next player and worse for the player that made the move.</li>
</ol>
<p><strong>The model</strong></p>
<p>We construct $$ f(p) $$ as a 3 layer deep 2048 units wide artificial neural network, with rectified linear units in each layer. The input is a 8 * 8 * 12 = 768 wide layer which indicates whether each piece (there are 12 types) is present in each square (there are 8 * 8 squares). After three matrix multiplications (each followed by a nonlinearity), there's a final dot product with a 2048-wide vector to condense it down to a single value.</p>
<p><img src="https://erikbern.com/assets/2014/11/chess-architecture-1.png" alt="image"></p>
<p>In total there's roughly 10M unknown parameters in the network.</p>
<p>To train the network, I present it with $$ (p, q, r) $$ triplets. I feed it through the network. Denoting by $$ S(x) = 1 / (1 + exp(-x)) $$ , the sigmoid function, the total objective is:</p>
<p>$$ sum_{(p, q, r)} \log S(f(q) - f(r)) + \kappa \log (f(p) + f(q)) + \kappa \log (-f(q) - f(p)) $$</p>
<p> </p>
<p>This is the log likelihood of the “soft” inequalities $$ f(r) > f(q) $$ , $$ f(p) > -f(q) $$ , and $$ f(p) < -f(q) $$ . The last two are just a way of expressing a “soft” equality $$ f(p) = -f(q) $$ . I also use $$ \kappa $$ to put more emphasis on getting the equality right. I set it to 10.0. I don't think the solution is super sensitive to the value of $$ \kappa $$ .</p>
<p><img src="https://erikbern.com/assets/2014/11/chess-architecture.png" alt="image"></p>
<p>Notice that the function we learn <em>has no idea about the rules of chess.</em> We're not even teaching it how each piece move. We make sure the model has the expressiveness to work out legal moves, but we don't encode any information about the game itself. The model learns this information by observing tons of chess games.</p>
<p>Note that I'm also not trying to learn anything from <em>who won the game.</em> The reason is that the training data is full of games played by amateurs. If a grandmaster came into the middle of a game, s/he could probably completely turn it around. This means the final score is a pretty weak label. Still, even an amateur player probably makes near-optimal moves for most time.</p>
<p><strong>Training the model</strong></p>
<p>I rented a GPU instance from AWS and trained it on 100M games for about four days using stochastic gradient descent with Nesterov momentum. I put all (p, q, r) triplets into a <a href="http://www.h5py.org/">HDF5 data file</a>. I was messing around with learning rates for a while but after a while I realized I just wanted something that would give me good results in a few days. So I ended using a slightly unorthodox learning rate scheme: $$ 0.03 \cdot \exp(-\mbox{time in days}) $$ . Since I had so much training data, regularization wasn't necessary, so I wasn't using either dropout or L2 regularization.</p>
<p>A trick I did was to encode the boards as 64 bytes and then transform the board into a 768 units wide float vector on the GPU. This gave a pretty substantial performance boost since there's a lot less I/O.</p>
<p><strong>How does a chess AI work?</strong></p>
<p>Every chess AI starts with some function $$ f(p) $$ that approximates the value of the position. This is known as <a href="http://en.wikipedia.org/wiki/Evaluation_function">evaluation function</a>.</p>
<p>This function is also combined with a deep search of many millions of positions down the game tree. It turns out that an approximation of $$ f(p) $$ is just a small part of the playing chess well. All chess AI's focus on smart search algorithms, but the number of positions explode exponentially down the search tree, so in practice you can't go deeper than say 5-10 positions ahead. What you do is you use some approximation to evaluate leaf nodes and then use some variety of <a href="http://en.wikipedia.org/wiki/Negamax">negamax</a> to evaluate a game tree of a bunch of possible next moves.</p>
<p>By applying some smart searching algorithm, we can take pretty much any approximation and make it better. Chess AI's typically start with some simple evaluation function like: every pawn is worth 1 point, every knight is worth 3 points, etc.</p>
<p>We're going to take the function we learned and use it to evaluate leaves in the game tree. Then try to search deep. So we're first going to learn the function $$ f(p) $$ from data, then we're going to plug it into a search algorithm.</p>
<p><strong>Does it work?</strong></p>
<p>I coined my chess engine <em>Deep Pink</em> as an homage to <a href="http://en.wikipedia.org/wiki/Deep_Blue_%28chess_computer%29">Deep Blue</a>. As it turns out, the function we learn can definitely play chess. It beats me, every time. But I'm a horrible chess player.</p>
<p>Does Deep Pink beat existing chess AI's? <strong>Sometimes</strong></p>
<p>I pit it against another chess engine: <a href="https://github.com/thomasahle/sunfish">Sunfish</a> by Thomas Dybdahl Ahle. Sunfish is written entirely in Python. The reason I chose to stick to the same language was that I didn't want this to be an endless exercise of making fast move generation. Deep Pink also relies heavily on quick move generation, and I didn't want to spend weeks working out edge cases with bitmaps in C++ to be able to compete with the state of the art engines. That would just be an arms race. So to be able to establish something useful, I picked a pure Python engine.</p>
<p>The obvious thing in hindsight is: the main thing you want out of any evaluation function $$ f(p) $$ isn't accuracy, it's <strong>accuracy per time unit</strong>. It doesn't matter that one evaluation function is slightly better than another if it's ten times slower, because you can take the fast (but slightly worse) evaluation function and search more nodes in the game tree. So you really want to take into account the time spent by the engine. Without further ado, here's some results of playing against the engine many times:</p>
<p><img src="https://erikbern.com/assets/2014/11/scatter-plot1.png" alt="image"></p>
<p>Notice the log-scale. The x-axis and y-axis aren't super relevant here, the main thing is the distance to the diagonal, because that tells us which engine spent more CPU time. Every game I randomized the parameters for each engine: the max depth for Deep Pink, and the max number of nodes for Sunfish. (I didn't include draws because both engines struggle with it).</p>
<p>Not surprisingly, the more time advantage either side has, the better it plays. <strong>Overall, Sunfish is better, winning the majority of the games, but Deep Pink probably wins 1/3 of the time.</strong> I'm actually pretty encouraged by this. I think with some optimizations, Deep Pink could actually play substantially better:</p>
<ul>
<li>Better search algorithm. I'm currently using <a href="http://en.wikipedia.org/wiki/Negamax#NegaMax_with_Alpha_Beta_Pruning">Negamax with alpha-beta pruning</a>, whereas Sunfish uses <a href="http://en.wikipedia.org/wiki/MTD-f">MTD-f</a></li>
<li>Better evaluation function. Deep Pink plays pretty aggressively, but makes a lot of dumb mistakes. By generating “harder” training examples (ideally fed from mistakes it made) it should learn a better model</li>
<li>Faster evaluation function: It might be possible to train a smaller (but maybe deeper) version of the same neural network</li>
<li>Faster evaluation function: I didn't use the GPU for playing, only for training.</li>
</ul>
<p>Obviously the real goal wouldn't be to beat Sunfish, but one of the “real” chess engines out there. But for that, I would have to write carefully tuned C++ code, and I'm not sure it's the best way to spend my time.</p>
<p><strong>Summary</strong></p>
<p>I'm encouraged by this. I think it's really cool that</p>
<ol>
<li>It's possible to learn an evaluation function directly from raw data, with no preprocessing</li>
<li>A fairly slow evaluation function (several orders of magnitude slower) can still play well if it's more accurate</li>
</ol>
<div>
I'm pretty curious to see if this could fare well for <a href="http://en.wikipedia.org/wiki/Computer_Go">Go</a> or other games where AI's still don't play well. Either way, the conclusions above come with a million caveats. The biggest one is obviously that I haven't challenged a “real” chess engine. I'm not sure if I have the time to start hacking on chess engines, but if anyone is interested, I've <a href="https://github.com/erikbern/deep-pink">put all the source code up on Github</a>.
</div>
<p> </p>
Optimizing things: everything is a proxy for a proxy for a proxy2014-11-22T00:00:00Zhttps://erikbern.com/2014/11/22/optimizing-things-everything-is-a-proxy-for-a-proxy-for-a-proxy.html<p>Say you build a machine learning model, like a movie recommender system. You need to optimize for something. You have 1-5 stars as ratings so let's optimize for mean squared error. Great.</p>
<p>Then let's say you build a new model. It has even lower mean squared error. You deploy it. This model turns out to give a lower mean squared error. You roll it out to users and the metrics are tanking. Crap! Ok so maybe mean squared error isn't the right thing to optimize for.</p>
<p>The way you solve this, of course, is you start A/B testing your changes. But what metric to choose? People often ask me why we use one or another metric. We typically look at numbers like <em>Daily active users</em>, <em>Day 2 retention</em>, etc. But what if optimizing too hard for one hurts the other? What if you're driving day 2 retention but screwing up month 2 retention?</p>
<p>What I like to remind myself is that <strong>everything is a proxy metric</strong>. We really want to <a href="http://en.wikipedia.org/wiki/Shareholder_value#Maximizing_shareholder_value">maximize shareholder value</a> or something like similar (let's not get into a debate about this, so for the purpose of this blog post I'm going to assume that's our goal).</p>
<p>The problem is, you can't take all your hyperparameters and calculate the gradient</p>
<p>$$ \frac{\partial}{\partial Theta} \mbox{shareholder value}(\Theta) $$</p>
<p> </p>
<p>That's silly for many reasons, but let's break it down. First of all, the functional relationship is highly stochastic, and depends on all kinds of external factors. Second of all, there's no way we can even evaluate multiple values of this function, and it won't be possible until we invent time machines. Third of all, there's no way we can extract gradient information <em>at all.</em></p>
<p>So what are we going to do? We're going to invent a new function that we think is <strong>highly correlated</strong> with shareholder value. We could even define multiple functions if we want to, just to cross check different ones. But we will <em>never be able to establish the correlation</em> because of the reasons I just mentioned.</p>
<p>So that's usually why metrics like daily active users are great. If you are trying to grow your company, it's reasonable to assume that ultimately user growth will lead to success.</p>
<p>But in general, what properties should such a function have? Ideally as many as possible out of this:</p>
<ol>
<li>Should be highly correlated with shareholder value. For a company focusing on growth, the number of active users is probably a good one.</li>
<li>Should be possible to measure separate independent outcomes, using A/B tests, blind tests, or something else. For instance, number of signups is tricky to test.</li>
<li>Should be fast to measure. We don't want to launch an A/B test and have to wait many months to get an answer</li>
<li>Should have a high signal to noise ratio. You want to extract as much value from it. If you're running an A/B test you want to reach statistical significance quickly.</li>
</ol>
<p>One thing I've learned the hard way is that sometimes it's often useful to pick a more biased metric if that means you can results faster or getting more results. For instance, we can roll out an A/B test with two different recommendation algorithms. We probably won't see an impact on high level metrics such as retention, so we can pick a feature-specific metric instead.</p>
<p>But we can go even further. Still if we're A/B testing, we probably have to run that test for two weeks to get any meaningful numbers. At the end of the day we obtain <strong>1 bit of information</strong> (roughly) at best after two weeks, which tells us which test group won.</p>
<p>If we want to iterate quickly sometimes it makes a lot more sense to just take the output of the recommendation algorithms and let people go through a blind test. This is slightly more biased because we're not using real users, but usually a lot quicker, and also lets us extract a <em>lot more information</em>. Not just do we learn which algorithm is the better, we often end up with lots of (noisy) anecdotal information, such as “algorithm A sucks for popular content” or “algorithm B is less diverse”.</p>
<p>At the lowest level, if you have a recommender algorithm, the model's objective (eg. mean squared error) is another great proxy. Turns out it's extremely easy to try multiple parameters and learn from it – all you need to do is to retrain the model. It totally dominates points 2, 3 and 4, but doesn't do a great job on point 1.</p>
<p><strong>TL;DR any metric you're using is just a proxy. Pick the right one for your task.</strong></p>
Luigi conquering the world2014-11-15T00:00:00Zhttps://erikbern.com/2014/11/15/luigi-spreading-to-the-west-coast.html<p>I keep forgetting to buy a costume for Halloween every year, so this year I prepared and got myself a Luigi costume a month in advance. Only to realize I was going to be out of town the whole weekend. If anyone wants a Luigi costume, let me know!<figure id="attachment_816" style="width: 395px;" class="wp-caption alignnone"></p>
<p><img src="https://erikbern.com/assets/2014/11/Screen-Shot-2014-11-15-at-11.34.19-AM.png" alt="image"><em>(I'm not as big as the guy in the picture)</em></p>
<p>Anyway, that's not the Luigi this blog post is about. This is about the <a href="https://github.com/spotify/luigi">Python workflow manager</a> that I've open sourced. If you're putting together batch jobs into complex pipelines, you should check it out.</p>
<p>There's been a couple of companies in NYC using it for a while, eg. Foursquare, Bitly, and Mortar Data. The latter company even provides a <a href="https://help.mortardata.com/technologies/luigi">hosted Luigi solution.</a></p>
<p>Lately, there's been a surge of contributors (at the time of writing there's 78 contributors, which is pretty cool!). People at <a href="https://www.houzz.com/">Houzz</a> has sent tons of pull requests, and they are not the only ones.</p>
<p>Two blog posts just came out, both describing their use of Luigi (among other things)</p>
<ul>
<li><a href="https://overflow.bufferapp.com/2014/10/31/buffers-new-data-architecture/">Buffer's New Data Architecture</a></li>
<li>Asana: <a href="https://eng.asana.com/2014/11/stable-accessible-data-infrastructure-startup/">How to Build Stable, Accessible Data Infrastructure at a Startup</a></li>
</ul>
<p>In addition, I found this interesting deck from Stripe:</p>
<p>There's also a couple of meetups in the past and the future. There was a dedicated <a href="https://www.eventbrite.com/e/luigi-users-meetup-tickets-12152567657">Luigi meetup</a> on July 31 at the Spotify NYC office, also sponsored by <a href="https://www.runads.com/">Run Ads</a> who use Luigi a lot. Here are <a href="https://www.slideshare.net/erikbern/luigi-future">my slides about Luigi's future</a>, heavily delayed:</p>
<p>I'm also talking about Luigi at the <a href="https://www.meetup.com/NYC-Data-Science/events/218604422/">NYC Data Science meetup</a> on Dec 19 (also at Spotify's NYC office). Feel free to drop by and ask me some tough questions!</p>
<p> </p>
Annoying blog post2014-11-11T00:00:00Zhttps://erikbern.com/2014/11/11/annoying-blog-post.html<p>I spent a couple of hours this weekend going through some pull requests and issues to <a href="https://github.com/spotify/annoy">Annoy</a>, which is an open source C++/Python library for <a href="http://en.wikipedia.org/wiki/Nearest_neighbor_search#Approximate_nearest_neighbor">Approximate Nearest Neighbor</a> search.</p>
<p>I set up Travis-CI integration and spent some time on <a href="https://github.com/spotify/annoy/issues/13">one of the issues</a> that multiple people had reported. At the end of the day, it turns out the issue was actually caused by a bug in GCC 4.8. Some crazy compiler optimization introduced between 4.6 and 4.8 caused this loop to be removed:</p>
<pre>if (indices.size() <= (size_t)_K) {
for (size_t i = 0; i < indices.size(); i++)
m->children[i] = indices[i];
return item;
}</pre>
<p>Replacing it with std::copy turned out to do the trick</p>
<pre>if (indices.size() <= (size_t)_K) {
copy(indices.begin(), indices.end(), m->children);
return item;
}</pre>
<p>It's still bizarre, but I probably deserved it, given how Annoy is abusing C++. The m->children array is declared as being only 2 elements long, but I deliberately overflow the array because I allocate extra space after it. I think this might cause GCC to unroll the loop to run twice.</p>
<p>I always feel a bit more comfortable when it turns out that the compiler is introducing bugs rather than my code. Made me think of the Jeff Dean joke: <em>Jeff Dean builds his code before committing it, but only to check for compiler and linker bugs.</em></p>
<p>Anyway, after fixing this in three separately places, it seems like it's finally working. <a href="http://dirk.eddelbuettel.com/">Dirk Eddelbuettel</a> is working on an <a href="https://github.com/eddelbuettel/rcppannoy">R implementation</a> of Annoy which is fun to see.</p>
<p>I haven't spent much time with Annoy in a year or two and looking around it seems like there's some new competitors on the block. <a href="https://github.com/ryanrhymes/panns">Panns</a> is one of them, another one is the <a href="https://t.co/yTLZCez225">LSHForest pull request</a> for scikit-learn. I haven't looked at them thoroughly, but they are both Python-only and claim some advantages over Annoy. None of them implement mmap as a method to load indexes, which imho is Annoy's killer feature.</p>
<p>There's a <a href="http://maheshakya.github.io/gsoc/2014/08/17/performance-comparison-among-lsh-forest-annoy-and-flann.html">performance benchmark</a> featuring Annoy, LSHForest, and <a href="http://www.cs.ubc.ca/research/flann/">FLANN</a>, written by the author of LSHForest. Annoy performs horribly in the benchmark, getting its ass severely kicked by the other two. After re-running the benchmark myself, I think what happened is that the bug I mentioned above was present for Annoy and that's why it performed so bad. Re-running <a href="https://gist.github.com/maheshakya/b7bcf915c9d5bab89d8d">the benchmark</a> (thanks for making it easily reproducible!) yields very different results.</p>
<p>It's extremely hard to compare all trade-offs between index building time, index size, query performance, and accuracy. So please don't take this super seriously. The only thing I changed in the benchmark was (1) I added Panns, for good measure (2) I reduced the number of trees for Annoy (and Panns) to 10 instead of using n_features. Without reducing the number of trees for Annoy, it gets pretty much 100% accuracy for all data sets, but takes several minutes to build each index. So to emphasize approximate aspect of ANN, I decided to sacrifice some accuracy to gain performance.</p>
<p>Pardon the lousy graphics, but here's the result in all its glory:</p>
<p><img src="https://erikbern.com/assets/2014/11/Screen-Shot-2014-11-10-at-10.47.42-PM.png" alt="image"></p>
<p><img src="https://erikbern.com/assets/2014/11/Screen-Shot-2014-11-10-at-11.07.52-PM.png" alt="image"></p>
<p><img src="https://erikbern.com/assets/2014/11/Screen-Shot-2014-11-10-at-10.49.37-PM.png" alt="image"></p>
<p>In my layman terms:</p>
<ul>
<li>Annoy and Panns outperform LSHF and FLANN significantly on accuracy.</li>
<li>Index building process is fast for LSHF and FLANN. Annoy takes a lot more time, but Panns is 10x slower than Annoy</li>
<li>FLANN is faster than Annoy for queries. Annoy is 10x faster than LSHF. Panns is super duper slow.</li>
</ul>
<p>And with my severely biased conclusions:</p>
<ul>
<li>If you want to use mmap for fast index loading, use Annoy</li>
<li>If you want to minimize file size at any cost, use Panns</li>
<li>If you want fast query times at any cost, use FLANN</li>
<li>If you want a pure Python solution, use LSHF</li>
<li>For anything else, use Annoy. Or am I going too far promoting my own projects now…?</li>
</ul>
<p>Btw, I would love it if someone could help me reimplement the algo used by Panns in Annoy, since it seems pretty good.</p>
<p>For another comparison, check out Radim Řehůřek's <a href="http://radimrehurek.com/2014/01/performance-shootout-of-nearest-neighbours-querying/">Performance Shootout of Nearest Neighbours</a>.</p>
<p>All metrics below:</p>
<table dir="ltr" border="1" cellspacing="0" cellpadding="0">
<colgroup> <col width="100" /> <col width="100" /> <col width="100" /> <col width="100" /></colgroup> <tr>
<td>
</td>
<pre><code><td data-sheets-value="[null,2,&quot;Time building index (s)&quot;]">
Time building index (s)
</td>
<td data-sheets-value="[null,2,&quot;Average query time (ms)&quot;]">
Average query time (ms)
</td>
<td data-sheets-value="[null,2,&quot;Average accuracy&quot;]">
Average accuracy
</td>
</code></pre>
</tr>
<tr>
<td data-sheets-value="[null,2,"n_samples: 1000 n_features: 100"]">
n_samples: 1000 n_features: 100
</td>
<pre><code><td data-sheets-numberformat="[null,2,&quot;0.000&quot;,1]">
</td>
<td data-sheets-numberformat="[null,2,&quot;0.000&quot;,1]">
</td>
<td data-sheets-numberformat="[null,2,&quot;0.000&quot;,1]">
</td>
</code></pre>
</tr>
<tr>
<td data-sheets-value="[null,2,"LSHF"]">
LSHF
</td>
<pre><code><td data-sheets-value="[null,3,null,0.0223457813263]" data-sheets-numberformat="[null,2,&quot;0.00&quot;,1]">
0.02
</td>
<td data-sheets-value="[null,3,null,5.461249351499999]" data-sheets-numberformat="[null,2,&quot;0.00&quot;,1]" data-sheets-formula="=R[-32]C[0]*1000">
5.46
</td>
<td data-sheets-value="[null,3,null,0.5856]" data-sheets-numberformat="[null,2,&quot;0.00&quot;,1]">
0.59
</td>
</code></pre>
</tr>
<tr>
<td data-sheets-value="[null,2,"Annoy"]">
Annoy
</td>
<pre><code><td data-sheets-value="[null,3,null,0.146422863007]" data-sheets-numberformat="[null,2,&quot;0.00&quot;,1]">
0.15
</td>
<td data-sheets-value="[null,3,null,0.26562213897700004]" data-sheets-numberformat="[null,2,&quot;0.00&quot;,1]" data-sheets-formula="=R[-32]C[0]*1000">
0.27
</td>
<td data-sheets-value="[null,3,null,0.9776]" data-sheets-numberformat="[null,2,&quot;0.00&quot;,1]">
0.98
</td>
</code></pre>
</tr>
<tr>
<td data-sheets-value="[null,2,"Flann"]">
Flann
</td>
<pre><code><td data-sheets-value="[null,3,null,0.00321507453918]" data-sheets-numberformat="[null,2,&quot;0.00&quot;,1]">
0.00
</td>
<td data-sheets-value="[null,3,null,0.17126083374]" data-sheets-numberformat="[null,2,&quot;0.00&quot;,1]" data-sheets-formula="=R[-32]C[0]*1000">
0.17
</td>
<td data-sheets-value="[null,3,null,0.5978]" data-sheets-numberformat="[null,2,&quot;0.00&quot;,1]">
0.60
</td>
</code></pre>
</tr>
<tr>
<td data-sheets-value="[null,2,"Panns"]">
Panns
</td>
<pre><code><td data-sheets-value="[null,3,null,3.27013206482]" data-sheets-numberformat="[null,2,&quot;0.00&quot;,1]">
3.27
</td>
<td data-sheets-value="[null,3,null,66.48426055910001]" data-sheets-numberformat="[null,2,&quot;0.00&quot;,1]" data-sheets-formula="=R[-32]C[0]*1000">
66.48
</td>
<td data-sheets-value="[null,3,null,0.9258]" data-sheets-numberformat="[null,2,&quot;0.00&quot;,1]">
0.93
</td>
</code></pre>
</tr>
<tr>
<td>
</td>
<pre><code><td data-sheets-numberformat="[null,2,&quot;0.00&quot;,1]">
</td>
<td data-sheets-numberformat="[null,2,&quot;0.00&quot;,1]">
</td>
<td data-sheets-numberformat="[null,2,&quot;0.00&quot;,1]">
</td>
</code></pre>
</tr>
<tr>
<td data-sheets-value="[null,2,"n_samples: 1000 n_features: 500"]">
n_samples: 1000 n_features: 500
</td>
<pre><code><td data-sheets-numberformat="[null,2,&quot;0.00&quot;,1]">
</td>
<td data-sheets-numberformat="[null,2,&quot;0.00&quot;,1]">
</td>
<td data-sheets-numberformat="[null,2,&quot;0.00&quot;,1]">
</td>
</code></pre>
</tr>
<tr>
<td data-sheets-value="[null,2,"LSHF"]">
LSHF
</td>
<pre><code><td data-sheets-value="[null,3,null,0.0957989692688]" data-sheets-numberformat="[null,2,&quot;0.00&quot;,1]">
0.10
</td>
<td data-sheets-value="[null,3,null,7.10513591766]" data-sheets-numberformat="[null,2,&quot;0.00&quot;,1]" data-sheets-formula="=R[-32]C[0]*1000">
7.11
</td>
<td data-sheets-value="[null,3,null,0.609]" data-sheets-numberformat="[null,2,&quot;0.00&quot;,1]">
0.61
</td>
</code></pre>
</tr>
<tr>
<td data-sheets-value="[null,2,"Annoy"]">
Annoy
</td>
<pre><code><td data-sheets-value="[null,3,null,0.388671875]" data-sheets-numberformat="[null,2,&quot;0.00&quot;,1]">
0.39
</td>
<td data-sheets-value="[null,3,null,0.7512760162350001]" data-sheets-numberformat="[null,2,&quot;0.00&quot;,1]" data-sheets-formula="=R[-32]C[0]*1000">
0.75
</td>
<td data-sheets-value="[null,3,null,0.9826]" data-sheets-numberformat="[null,2,&quot;0.00&quot;,1]">
0.98
</td>
</code></pre>
</tr>
<tr>
<td data-sheets-value="[null,2,"Flann"]">
Flann
</td>
<pre><code><td data-sheets-value="[null,3,null,0.00826096534729]" data-sheets-numberformat="[null,2,&quot;0.00&quot;,1]">
0.01
</td>
<td data-sheets-value="[null,3,null,0.24263381958]" data-sheets-numberformat="[null,2,&quot;0.00&quot;,1]" data-sheets-formula="=R[-32]C[0]*1000">
0.24
</td>
<td data-sheets-value="[null,3,null,0.6164]" data-sheets-numberformat="[null,2,&quot;0.00&quot;,1]">
0.62
</td>
</code></pre>
</tr>
<tr>
<td data-sheets-value="[null,2,"Panns"]">
Panns
</td>
<pre><code><td data-sheets-value="[null,3,null,9.94446802139]" data-sheets-numberformat="[null,2,&quot;0.00&quot;,1]">
9.94
</td>
<td data-sheets-value="[null,3,null,140.598635674]" data-sheets-numberformat="[null,2,&quot;0.00&quot;,1]" data-sheets-formula="=R[-32]C[0]*1000">
140.60
</td>
<td data-sheets-value="[null,3,null,0.9594]" data-sheets-numberformat="[null,2,&quot;0.00&quot;,1]">
0.96
</td>
</code></pre>
</tr>
<tr>
<td>
</td>
<pre><code><td data-sheets-numberformat="[null,2,&quot;0.00&quot;,1]">
</td>
<td data-sheets-numberformat="[null,2,&quot;0.00&quot;,1]">
</td>
<td data-sheets-numberformat="[null,2,&quot;0.00&quot;,1]">
</td>
</code></pre>
</tr>
<tr>
<td data-sheets-value="[null,2,"n_samples: 10000 n_features: 100"]">
n_samples: 10000 n_features: 100
</td>
<pre><code><td data-sheets-numberformat="[null,2,&quot;0.00&quot;,1]">
</td>
<td data-sheets-numberformat="[null,2,&quot;0.00&quot;,1]">
</td>
<td data-sheets-numberformat="[null,2,&quot;0.00&quot;,1]">
</td>
</code></pre>
</tr>
<tr>
<td data-sheets-value="[null,2,"LSHF"]">
LSHF
</td>
<pre><code><td data-sheets-value="[null,3,null,0.247771978378]" data-sheets-numberformat="[null,2,&quot;0.00&quot;,1]">
0.25
</td>
<td data-sheets-value="[null,3,null,8.01199913025]" data-sheets-numberformat="[null,2,&quot;0.00&quot;,1]" data-sheets-formula="=R[-32]C[0]*1000">
8.01
</td>
<td data-sheets-value="[null,3,null,0.609]" data-sheets-numberformat="[null,2,&quot;0.00&quot;,1]">
0.61
</td>
</code></pre>
</tr>
<tr>
<td data-sheets-value="[null,2,"Annoy"]">
Annoy
</td>
<pre><code><td data-sheets-value="[null,3,null,3.16764092445]" data-sheets-numberformat="[null,2,&quot;0.00&quot;,1]">
3.17
</td>
<td data-sheets-value="[null,3,null,0.44639110565199996]" data-sheets-numberformat="[null,2,&quot;0.00&quot;,1]" data-sheets-formula="=R[-32]C[0]*1000">
0.45
</td>
<td data-sheets-value="[null,3,null,0.9826]" data-sheets-numberformat="[null,2,&quot;0.00&quot;,1]">
0.98
</td>
</code></pre>
</tr>
<tr>
<td data-sheets-value="[null,2,"Flann"]">
Flann
</td>
<pre><code><td data-sheets-value="[null,3,null,0.0239078998566]" data-sheets-numberformat="[null,2,&quot;0.00&quot;,1]">
0.02
</td>
<td data-sheets-value="[null,3,null,0.203204154968]" data-sheets-numberformat="[null,2,&quot;0.00&quot;,1]" data-sheets-formula="=R[-32]C[0]*1000">
0.20
</td>
<td data-sheets-value="[null,3,null,0.6164]" data-sheets-numberformat="[null,2,&quot;0.00&quot;,1]">
0.62
</td>
</code></pre>
</tr>
<tr>
<td data-sheets-value="[null,2,"Panns"]">
Panns
</td>
<pre><code><td data-sheets-value="[null,3,null,55.3448691368]" data-sheets-numberformat="[null,2,&quot;0.00&quot;,1]">
55.34
</td>
<td data-sheets-value="[null,3,null,71.1174964905]" data-sheets-numberformat="[null,2,&quot;0.00&quot;,1]" data-sheets-formula="=R[-32]C[0]*1000">
71.12
</td>
<td data-sheets-value="[null,3,null,0.9594]" data-sheets-numberformat="[null,2,&quot;0.00&quot;,1]">
0.96
</td>
</code></pre>
</tr>
<tr>
<td>
</td>
<pre><code><td data-sheets-numberformat="[null,2,&quot;0.00&quot;,1]">
</td>
<td data-sheets-numberformat="[null,2,&quot;0.00&quot;,1]">
</td>
<td data-sheets-numberformat="[null,2,&quot;0.00&quot;,1]">
</td>
</code></pre>
</tr>
<tr>
<td data-sheets-value="[null,2,"n_samples: 10000 n_features: 500"]">
n_samples: 10000 n_features: 500
</td>
<pre><code><td data-sheets-numberformat="[null,2,&quot;0.00&quot;,1]">
</td>
<td data-sheets-numberformat="[null,2,&quot;0.00&quot;,1]">
</td>
<td data-sheets-numberformat="[null,2,&quot;0.00&quot;,1]">
</td>
</code></pre>
</tr>
<tr>
<td data-sheets-value="[null,2,"LSHF"]">
LSHF
</td>
<pre><code><td data-sheets-value="[null,3,null,1.28864502907]" data-sheets-numberformat="[null,2,&quot;0.00&quot;,1]">
1.29
</td>
<td data-sheets-value="[null,3,null,9.49889659882]" data-sheets-numberformat="[null,2,&quot;0.00&quot;,1]" data-sheets-formula="=R[-32]C[0]*1000">
9.50
</td>
<td data-sheets-value="[null,3,null,0.1492]" data-sheets-numberformat="[null,2,&quot;0.00&quot;,1]">
0.15
</td>
</code></pre>
</tr>
<tr>
<td data-sheets-value="[null,2,"Annoy"]">
Annoy
</td>
<pre><code><td data-sheets-value="[null,3,null,10.4567909241]" data-sheets-numberformat="[null,2,&quot;0.00&quot;,1]">
10.46
</td>
<td data-sheets-value="[null,3,null,1.1410522460899999]" data-sheets-numberformat="[null,2,&quot;0.00&quot;,1]" data-sheets-formula="=R[-32]C[0]*1000">
1.14
</td>
<td data-sheets-value="[null,3,null,0.5042]" data-sheets-numberformat="[null,2,&quot;0.00&quot;,1]">
0.50
</td>
</code></pre>
</tr>
<tr>
<td data-sheets-value="[null,2,"Flann"]">
Flann
</td>
<pre><code><td data-sheets-value="[null,3,null,0.0745980739594]" data-sheets-numberformat="[null,2,&quot;0.00&quot;,1]">
0.07
</td>
<td data-sheets-value="[null,3,null,0.243935585022]" data-sheets-numberformat="[null,2,&quot;0.00&quot;,1]" data-sheets-formula="=R[-32]C[0]*1000">
0.24
</td>
<td data-sheets-value="[null,3,null,0.1334]" data-sheets-numberformat="[null,2,&quot;0.00&quot;,1]">
0.13
</td>
</code></pre>
</tr>
<tr>
<td data-sheets-value="[null,2,"Panns"]">
Panns
</td>
<pre><code><td data-sheets-value="[null,3,null,154.577830076]" data-sheets-numberformat="[null,2,&quot;0.00&quot;,1]">
154.58
</td>
<td data-sheets-value="[null,3,null,139.825344086]" data-sheets-numberformat="[null,2,&quot;0.00&quot;,1]" data-sheets-formula="=R[-32]C[0]*1000">
139.83
</td>
<td data-sheets-value="[null,3,null,0.5372]" data-sheets-numberformat="[null,2,&quot;0.00&quot;,1]">
0.54
</td>
</code></pre>
</tr>
<tr>
<td>
</td>
<pre><code><td data-sheets-numberformat="[null,2,&quot;0.00&quot;,1]">
</td>
<td data-sheets-numberformat="[null,2,&quot;0.00&quot;,1]">
</td>
<td data-sheets-numberformat="[null,2,&quot;0.00&quot;,1]">
</td>
</code></pre>
</tr>
<tr>
<td data-sheets-value="[null,2,"n_samples: 10000 n_features: 1000"]">
n_samples: 10000 n_features: 1000
</td>
<pre><code><td data-sheets-numberformat="[null,2,&quot;0.00&quot;,1]">
</td>
<td data-sheets-numberformat="[null,2,&quot;0.00&quot;,1]">
</td>
<td data-sheets-numberformat="[null,2,&quot;0.00&quot;,1]">
</td>
</code></pre>
</tr>
<tr>
<td data-sheets-value="[null,2,"LSHF"]">
LSHF
</td>
<pre><code><td data-sheets-value="[null,3,null,2.69871807098]" data-sheets-numberformat="[null,2,&quot;0.00&quot;,1]">
2.70
</td>
<td data-sheets-value="[null,3,null,13.7353038788]" data-sheets-numberformat="[null,2,&quot;0.00&quot;,1]" data-sheets-formula="=R[-32]C[0]*1000">
13.74
</td>
<td data-sheets-value="[null,3,null,0.1588]" data-sheets-numberformat="[null,2,&quot;0.00&quot;,1]">
0.16
</td>
</code></pre>
</tr>
<tr>
<td data-sheets-value="[null,2,"Annoy"]">
Annoy
</td>
<pre><code><td data-sheets-value="[null,3,null,18.2781989574]" data-sheets-numberformat="[null,2,&quot;0.00&quot;,1]">
18.28
</td>
<td data-sheets-value="[null,3,null,2.32357978821]" data-sheets-numberformat="[null,2,&quot;0.00&quot;,1]" data-sheets-formula="=R[-32]C[0]*1000">
2.32
</td>
<td data-sheets-value="[null,3,null,0.4868]" data-sheets-numberformat="[null,2,&quot;0.00&quot;,1]">
0.49
</td>
</code></pre>
</tr>
<tr>
<td data-sheets-value="[null,2,"Flann"]">
Flann
</td>
<pre><code><td data-sheets-value="[null,3,null,0.11420583725]" data-sheets-numberformat="[null,2,&quot;0.00&quot;,1]">
0.11
</td>
<td data-sheets-value="[null,3,null,0.322947502136]" data-sheets-numberformat="[null,2,&quot;0.00&quot;,1]" data-sheets-formula="=R[-32]C[0]*1000">
0.32
</td>
<td data-sheets-value="[null,3,null,0.1242]" data-sheets-numberformat="[null,2,&quot;0.00&quot;,1]">
0.12
</td>
</code></pre>
</tr>
<tr>
<td data-sheets-value="[null,2,"Panns"]">
Panns
</td>
<pre><code><td data-sheets-value="[null,3,null,278.210582972]" data-sheets-numberformat="[null,2,&quot;0.00&quot;,1]">
278.21
</td>
<td data-sheets-value="[null,3,null,257.453641891]" data-sheets-numberformat="[null,2,&quot;0.00&quot;,1]" data-sheets-formula="=R[-32]C[0]*1000">
257.45
</td>
<td data-sheets-value="[null,3,null,0.49]" data-sheets-numberformat="[null,2,&quot;0.00&quot;,1]">
0.49
</td>
</code></pre>
</tr>
</table>The Filter Bubble is Silly and you Can't Guess What Happened Next2014-10-10T00:00:00Zhttps://erikbern.com/2014/10/10/the-filter-bubble-is-silly-and-you-cant-guess-what-happened-next.html<p>I'm at <a href="recsys.acm.org/recsys14/program/">RecSys 2014</a>, meeting a lot of people and hanging out at talks. Some of the discussions here was about the <a href="http://en.wikipedia.org/wiki/Filter_bubble">filter bubble</a> which prompted me to formalize my own thoughts.</p>
<p>I firmly believe that it's the role of a system to respect the user's intent. Any sensible system will optimize for user's long-term happiness by providing info back to the user that s/he finds useful. This holds true as long as a system isn't (a) stupid and recommends the wrong content (b) trying to push its own agenda, that may or may not be hidden.</p>
<p>When I go to Google and search for “banana” it tries to predict my intent. I expect to results about bananas back. It's like I go to an Indian restaurant and order something – I expect to get Indian food back.</p>
<p>Now, the chef could be bad, and I might not get what most people consider Indian food. But that's just a “bug”. The chef knows that he should respect my intent.</p>
<p>The other option is that I get some weird food because the chef has a hidden agenda. For instance, maybe s/he puts crack in my food so that I come back tomorrow. Or maybe, s/he gives me a hamburger, tells me this is Indian food, and blatantly lies that there's no other Indian restaurants in United States.</p>
<p>Luckily, we live in a free market, and as long as there's some competition, I believe that the truth will prevail. I'll eventually figure out that <em>there are other Indian restaurants</em> and I will discover that they are much better. This also means that there's really no incentive for the chef to serve something that's wildly different that what I'm asking for.</p>
<p>My point is, I think any system's role is to respect the intent of the user, and serve whatever you ask for. It's the <em>user's</em> role to decide what s/he wants to consume, and in a free market I think there will be those options out there.</p>
<p>Anyway, this story took a funny twist. As I was debating this over Twitter, some Twitter bot stepped in and started offering advice on Indian restaurants. Obviously unfiltered and neutral.</p>
<p><img src="https://erikbern.com/assets/2014/10/Screen-Shot-2014-10-09-at-9.41.47-PM.png" alt="image"></p>
Detecting corporate fraud using Benford's law2014-10-07T00:00:00Zhttps://erikbern.com/2014/10/07/detecting-corporate-fraud-using-benfords-law.html<p><strong>Note: This is a silly application. Don't take anything seriously.</strong></p>
<p><a href="http://en.wikipedia.org/wiki/Benford's_law">Benford's law</a> describes a phenomenon where numbers in any data series will exhibit patterns in their first digit. For instance, if you took a list of the 1,000 longest rivers of Mongolia, or the average daily calorie consumption of mammals, or the wealth distribution of German soccer players, you will on average see that these numbers start with “1” about 30% of the time. I won't attempt at proving this, but essentially it's a result of scale invariance. It doesn't apply to <em>all</em> numerical series, like IQ or shoe size, but this pattern turns out to pop up in a lot of places.</p>
<p>Since the theory predicts that the first digit follows a certain outcome, you can use it to find “strange” distributions that seem to disobey what we can expect statistically. The Wikipedia article mentions using Benford's law to detect accounting fraud, and Greece was busted by researchers noting that the Greek macroeconomic data <a href="http://www.forbes.com/fdc/welcome_mjx.shtml">had an abnormally large deviation from what Benford's law would predict</a>. There's another couple of papers and an interesting blog post <a href="http://econerdfood.blogspot.com/2011/10/benfords-law-and-decreasing-reliability.html">applying Benford's law to industry sectors.</a></p>
<p>For fun, I downloaded about 5,000 annual reports (10-K) for most publicly traded companies in the US, to see if there are big outliers.</p>
<p>Benford's law predict that the probability of any first digit, 1-9, is</p>
<p>$$ Q(d) = left(log (d+1) - log d right) / log 10 $$ .</p>
<p>For every annual report, I calculate the empirical distribution, $$ P(d) = n_d / sum n_i $$ where $$ n_d $$ is just the number of occurrences of a dollar amount starting with digit d. To correct for reports with few values, I smooth the measured digit distribution a bit and add $$ 100cdot P(d) $$ “fake” counts to each $$ n_d $$ .</p>
<p>To measure the difference between expected and actual distributions, I use the <a href="http://en.wikipedia.org/wiki/Kullback%E2%80%93Leibler_divergence">KL-divergence</a> which boils down to</p>
<p>$$ D_{P \mid Q} = sum_i log left( P(i) / Q(i) right) P(i) $$</p>
<p> </p>
<p>I downloaded the annual reports from SEC and extracted all figures from all tables containing dollar amounts. Since some amounts may occur many times, and skew the digit distribution, I only looked at the unique amounts that occurred in the report. I then extracted first non-zero digit of all amounts.</p>
<p>The distributions of digits for the top five outlier entries illustrate Benford's law in practice:</p>
<p><img src="https://erikbern.com/assets/2014/10/plot.png" alt="image"></p>
<p>On closer inspection, some of these seem legit. For instance, the #1 spot on the list, <a href="http://www.sec.gov/Archives/edgar/data/912595/000091259514000003/maa12312013-10k.htm">Mid-America Apartment Communities, Inc.</a> has a long list of units across the country, and the average price per unit happens to cluster around $800.</p>
<p>Below is a list containing the 100 companies with the largest KL-divergence (most “fishy”). None of the companies stand out as having an outrageous distribution, and even the top companies on the list are very unlikely to have commit fraud. The prior belief of accounting fraud is basically extremely low. We would commit the <a href="http://en.wikipedia.org/wiki/Prosecutor's_fallacy">prosecutor's fallacy</a> for singling out any of these numbers as fraudulent. Anyway, I'll follow up with a new blog post in five years to see if any of the companies below were actually caught:</p>
<div>
</div>
<div>
</div>
<table>
<tr>
<td>
0.1311
</td>
<pre><code><td>
Mid-America Apartment Communities, Inc.
</td>
</code></pre>
</tr>
<tr>
<td>
0.0578
</td>
<pre><code><td>
Power Integrations Inc.
</td>
</code></pre>
</tr>
<tr>
<td>
0.0497
</td>
<pre><code><td>
United Natural Foods,Inc.
</td>
</code></pre>
</tr>
<tr>
<td>
0.0474
</td>
<pre><code><td>
Lexicon Pharmaceuticals, Inc
</td>
</code></pre>
</tr>
<tr>
<td>
0.0461
</td>
<pre><code><td>
Pacific Office Properties Trust, Inc.
</td>
</code></pre>
</tr>
<tr>
<td>
0.0414
</td>
<pre><code><td>
Xilinx
</td>
</code></pre>
</tr>
<tr>
<td>
0.0406
</td>
<pre><code><td>
Host Hotels & Resorts Inc.
</td>
</code></pre>
</tr>
<tr>
<td>
0.0391
</td>
<pre><code><td>
World Acceptance Corp
</td>
</code></pre>
</tr>
<tr>
<td>
0.0390
</td>
<pre><code><td>
Immunomedics, Inc.
</td>
</code></pre>
</tr>
<tr>
<td>
0.0388
</td>
<pre><code><td>
Marriott International Inc.
</td>
</code></pre>
</tr>
<tr>
<td>
0.0387
</td>
<pre><code><td>
CVS Caremark Corporation
</td>
</code></pre>
</tr>
<tr>
<td>
0.0382
</td>
<pre><code><td>
Paychex, Inc.
</td>
</code></pre>
</tr>
<tr>
<td>
0.0382
</td>
<pre><code><td>
Luna Innovations Incorporated
</td>
</code></pre>
</tr>
<tr>
<td>
0.0381
</td>
<pre><code><td>
Capstead Mortgage Corporation
</td>
</code></pre>
</tr>
<tr>
<td>
0.0370
</td>
<pre><code><td>
Verso Paper Corp.
</td>
</code></pre>
</tr>
<tr>
<td>
0.0370
</td>
<pre><code><td>
Fastenal Co.
</td>
</code></pre>
</tr>
<tr>
<td>
0.0364
</td>
<pre><code><td>
Insperity, Inc.
</td>
</code></pre>
</tr>
<tr>
<td>
0.0359
</td>
<pre><code><td>
Diamond Hill Investment Group Inc.
</td>
</code></pre>
</tr>
<tr>
<td>
0.0354
</td>
<pre><code><td>
National Security Group Inc.
</td>
</code></pre>
</tr>
<tr>
<td>
0.0345
</td>
<pre><code><td>
GameStop Corp.
</td>
</code></pre>
</tr>
<tr>
<td>
0.0342
</td>
<pre><code><td>
Compass Minerals International Inc.
</td>
</code></pre>
</tr>
<tr>
<td>
0.0340
</td>
<pre><code><td>
SIRIUS XM Radio Inc.
</td>
</code></pre>
</tr>
<tr>
<td>
0.0339
</td>
<pre><code><td>
BP Prudhoe Bay Royalty Trust
</td>
</code></pre>
</tr>
<tr>
<td>
0.0326
</td>
<pre><code><td>
Investors Bancorp Inc.
</td>
</code></pre>
</tr>
<tr>
<td>
0.0323
</td>
<pre><code><td>
Kohlberg Capital Corporation
</td>
</code></pre>
</tr>
<tr>
<td>
0.0319
</td>
<pre><code><td>
Equity One
</td>
</code></pre>
</tr>
<tr>
<td>
0.0319
</td>
<pre><code><td>
Kona Grill Inc.
</td>
</code></pre>
</tr>
<tr>
<td>
0.0313
</td>
<pre><code><td>
Alliance Financial Corporation
</td>
</code></pre>
</tr>
<tr>
<td>
0.0310
</td>
<pre><code><td>
Zale Corporation
</td>
</code></pre>
</tr>
<tr>
<td>
0.0310
</td>
<pre><code><td>
Anadarko Petroleum Corporation
</td>
</code></pre>
</tr>
<tr>
<td>
0.0308
</td>
<pre><code><td>
Sigma-Aldrich Corp.
</td>
</code></pre>
</tr>
<tr>
<td>
0.0304
</td>
<pre><code><td>
Global Cash Access Holdings, Inc.
</td>
</code></pre>
</tr>
<tr>
<td>
0.0300
</td>
<pre><code><td>
Corcept Therapeutics
</td>
</code></pre>
</tr>
<tr>
<td>
0.0294
</td>
<pre><code><td>
Enbridge Energy Management LLC
</td>
</code></pre>
</tr>
<tr>
<td>
0.0293
</td>
<pre><code><td>
BJ's Restaurants Inc.
</td>
</code></pre>
</tr>
<tr>
<td>
0.0293
</td>
<pre><code><td>
Air Transport Services Group, Inc.
</td>
</code></pre>
</tr>
<tr>
<td>
0.0292
</td>
<pre><code><td>
Fairchild Semiconductor International Inc.
</td>
</code></pre>
</tr>
<tr>
<td>
0.0292
</td>
<pre><code><td>
Universal Electronics Inc.
</td>
</code></pre>
</tr>
<tr>
<td>
0.0291
</td>
<pre><code><td>
Espey Manufacturing & Electronics Corp.
</td>
</code></pre>
</tr>
<tr>
<td>
0.0290
</td>
<pre><code><td>
Inland Real Estate Corporation
</td>
</code></pre>
</tr>
<tr>
<td>
0.0286
</td>
<pre><code><td>
W. R. Berkley Corporation
</td>
</code></pre>
</tr>
<tr>
<td>
0.0285
</td>
<pre><code><td>
Albemarle Corp.
</td>
</code></pre>
</tr>
<tr>
<td>
0.0282
</td>
<pre><code><td>
Koss Corp.
</td>
</code></pre>
</tr>
<tr>
<td>
0.0281
</td>
<pre><code><td>
Leap Wireless International Inc.
</td>
</code></pre>
</tr>
<tr>
<td>
0.0279
</td>
<pre><code><td>
Encore Wire Corp.
</td>
</code></pre>
</tr>
<tr>
<td>
0.0276
</td>
<pre><code><td>
UQM Technologies, Inc.
</td>
</code></pre>
</tr>
<tr>
<td>
0.0276
</td>
<pre><code><td>
DuPont Fabros Technology Inc.
</td>
</code></pre>
</tr>
<tr>
<td>
0.0276
</td>
<pre><code><td>
Applied Materials Inc.
</td>
</code></pre>
</tr>
<tr>
<td>
0.0275
</td>
<pre><code><td>
Destination Maternity Corporation
</td>
</code></pre>
</tr>
<tr>
<td>
0.0272
</td>
<pre><code><td>
Pepsico, Inc.
</td>
</code></pre>
</tr>
<tr>
<td>
0.0271
</td>
<pre><code><td>
CorVel Corporation
</td>
</code></pre>
</tr>
<tr>
<td>
0.0270
</td>
<pre><code><td>
Nathan's Famous Inc.
</td>
</code></pre>
</tr>
<tr>
<td>
0.0269
</td>
<pre><code><td>
Sport Chalet, Inc.
</td>
</code></pre>
</tr>
<tr>
<td>
0.0269
</td>
<pre><code><td>
Key Technology Inc.
</td>
</code></pre>
</tr>
<tr>
<td>
0.0268
</td>
<pre><code><td>
Overhill Farms Inc.
</td>
</code></pre>
</tr>
<tr>
<td>
0.0268
</td>
<pre><code><td>
Digi International Inc.
</td>
</code></pre>
</tr>
<tr>
<td>
0.0267
</td>
<pre><code><td>
Materion Corporation
</td>
</code></pre>
</tr>
<tr>
<td>
0.0265
</td>
<pre><code><td>
DreamWorks Animation SKG Inc.
</td>
</code></pre>
</tr>
<tr>
<td>
0.0265
</td>
<pre><code><td>
NIC Inc.
</td>
</code></pre>
</tr>
<tr>
<td>
0.0264
</td>
<pre><code><td>
ANSYS Inc.
</td>
</code></pre>
</tr>
<tr>
<td>
0.0258
</td>
<pre><code><td>
Volterra Semiconductor Corporation
</td>
</code></pre>
</tr>
<tr>
<td>
0.0258
</td>
<pre><code><td>
Verenium Corporation
</td>
</code></pre>
</tr>
<tr>
<td>
0.0258
</td>
<pre><code><td>
KeyCorp
</td>
</code></pre>
</tr>
<tr>
<td>
0.0255
</td>
<pre><code><td>
Rockwell Collins Inc.
</td>
</code></pre>
</tr>
<tr>
<td>
0.0254
</td>
<pre><code><td>
Meritage Homes Corporation
</td>
</code></pre>
</tr>
<tr>
<td>
0.0253
</td>
<pre><code><td>
Perrigo Co.
</td>
</code></pre>
</tr>
<tr>
<td>
0.0249
</td>
<pre><code><td>
Zhone Technologies Inc
</td>
</code></pre>
</tr>
<tr>
<td>
0.0249
</td>
<pre><code><td>
McGrath RentCorp
</td>
</code></pre>
</tr>
<tr>
<td>
0.0249
</td>
<pre><code><td>
A.M. Castle & Co.
</td>
</code></pre>
</tr>
<tr>
<td>
0.0248
</td>
<pre><code><td>
Delta Natural Gas Co. Inc.
</td>
</code></pre>
</tr>
<tr>
<td>
0.0247
</td>
<pre><code><td>
Pervasive Software Inc.
</td>
</code></pre>
</tr>
<tr>
<td>
0.0247
</td>
<pre><code><td>
Senomyx
</td>
</code></pre>
</tr>
<tr>
<td>
0.0247
</td>
<pre><code><td>
ManTech International Corp.
</td>
</code></pre>
</tr>
<tr>
<td>
0.0246
</td>
<pre><code><td>
Ross Stores Inc.
</td>
</code></pre>
</tr>
<tr>
<td>
0.0245
</td>
<pre><code><td>
Bancorp Of New Jersey, Inc.
</td>
</code></pre>
</tr>
<tr>
<td>
0.0245
</td>
<pre><code><td>
Werner Enterprises
</td>
</code></pre>
</tr>
<tr>
<td>
0.0244
</td>
<pre><code><td>
Dillards Inc.
</td>
</code></pre>
</tr>
<tr>
<td>
0.0244
</td>
<pre><code><td>
Sparton Corp.
</td>
</code></pre>
</tr>
<tr>
<td>
0.0243
</td>
<pre><code><td>
Rudolph Technologies Inc.
</td>
</code></pre>
</tr>
<tr>
<td>
0.0243
</td>
<pre><code><td>
CyberOptics Corp.
</td>
</code></pre>
</tr>
<tr>
<td>
0.0240
</td>
<pre><code><td>
Hallador Energy Company
</td>
</code></pre>
</tr>
<tr>
<td>
0.0238
</td>
<pre><code><td>
DARA BioSciences, Inc
</td>
</code></pre>
</tr>
<tr>
<td>
0.0238
</td>
<pre><code><td>
Chico's FAS Inc.
</td>
</code></pre>
</tr>
<tr>
<td>
0.0237
</td>
<pre><code><td>
Delcath Systems Inc.
</td>
</code></pre>
</tr>
<tr>
<td>
0.0236
</td>
<pre><code><td>
Pure Cycle Corp.
</td>
</code></pre>
</tr>
<tr>
<td>
0.0235
</td>
<pre><code><td>
Cytori Therapeutics
</td>
</code></pre>
</tr>
<tr>
<td>
0.0235
</td>
<pre><code><td>
Vonage Holdings Corporation
</td>
</code></pre>
</tr>
<tr>
<td>
0.0235
</td>
<pre><code><td>
Spectranetics Corporation
</td>
</code></pre>
</tr>
<tr>
<td>
0.0235
</td>
<pre><code><td>
Regal-Beloit Corporation
</td>
</code></pre>
</tr>
<tr>
<td>
0.0234
</td>
<pre><code><td>
ScanSource, Inc.
</td>
</code></pre>
</tr>
<tr>
<td>
0.0234
</td>
<pre><code><td>
Weyco Group Inc
</td>
</code></pre>
</tr>
<tr>
<td>
0.0232
</td>
<pre><code><td>
Ambassadors Group Inc.
</td>
</code></pre>
</tr>
<tr>
<td>
0.0232
</td>
<pre><code><td>
Rent-A-Center Inc.
</td>
</code></pre>
</tr>
<tr>
<td>
0.0232
</td>
<pre><code><td>
Accenture plc
</td>
</code></pre>
</tr>
<tr>
<td>
0.0231
</td>
<pre><code><td>
Idenix Pharmaceuticals
</td>
</code></pre>
</tr>
<tr>
<td>
0.0231
</td>
<pre><code><td>
KAR Auction Services, Inc.
</td>
</code></pre>
</tr>
<tr>
<td>
0.0230
</td>
<pre><code><td>
Progressive
</td>
</code></pre>
</tr>
<tr>
<td>
0.0230
</td>
<pre><code><td>
BCSB Bankcorp Inc.
</td>
</code></pre>
</tr>
<tr>
<td>
0.0229
</td>
<pre><code><td>
PCTEL, Inc.
</td>
</code></pre>
</tr>
<tr>
<td>
0.0229
</td>
<pre><code><td>
Cincinnati Financial Corp.
</td>
</code></pre>
</tr>
</table>
<p>Again, a bunch of disclaimers: this is just a silly application, don't take it seriously, elevator inspection certificate available in the building manager's office, etc.</p>
Running Theano on EC22014-08-19T00:00:00Zhttps://erikbern.com/2014/08/19/running-theano-on-ec2.html<p>Inspired by <a href="http://benanne.github.io/2014/08/05/spotify-cnns.html">Sander Dieleman's internship</a> at Spotify, I've been playing around with deep learning using <a href="http://deeplearning.net/software/theano/">Theano</a>. Theano is this Python package that lets you define symbolic expressions (cool), does automatic differentiation (really cool), and compiles it down into bytecode to run on a CPU/GPU (super cool). It's built by Yoshua Bengio's deep learning team up in Montreal.</p>
<p>This isn't going to be a long blog post – I just wanted to share two pro tips:</p>
<ol>
<li>I was messing around for <em>hours</em> trying to get Theano running on the GPU instances in EC2. Turns out <a href="https://twitter.com/ndreasa/">Andreas Jansson</a>, a coworker at Spotify, has already built an ready-to-use AMI. When you start an EC2 instance, search for the <em>gpu_theano</em> AMI. (AMI's are Amazon's virtual images that you boot your system from). The gpu_theano AMI runs Ubuntu 14.04 and comes with a bunch of stuff pre-installed. Andreas also has <a href="https://github.com/andreasjansson/simple-aws-gpu-setup">this tool</a> to spin it up from the command line, but I couldn't get it working (somehow the instances it created weren't accessible over SSH) so I ended up just booting machines from the AWS Management Console.</li>
<li>The <a href="http://aws.amazon.com/ec2/pricing/">list price</a> for the <em>g2.2xlarge</em> instances (the ones with GPU's) are $0.65/h. If you end up running something for a week then that's just above $100. The <a href="http://aws.amazon.com/ec2/purchasing-options/spot-instances/">spot instance price</a>, however, is (currently) only $0.0641/h – less than 10%. The downside with spot instances is that your using excess capacity of EC2, so there's a small likelihood your machine will be taken down at any point. But so far supply generally seems to outstrip demand. The price looks fairly stable, and you can always checkpoint data to S3 to persist it.</li>
</ol>
<div>
<a href="/assets/2014/08/Screen-Shot-2014-08-19-at-9.18.15-AM.png">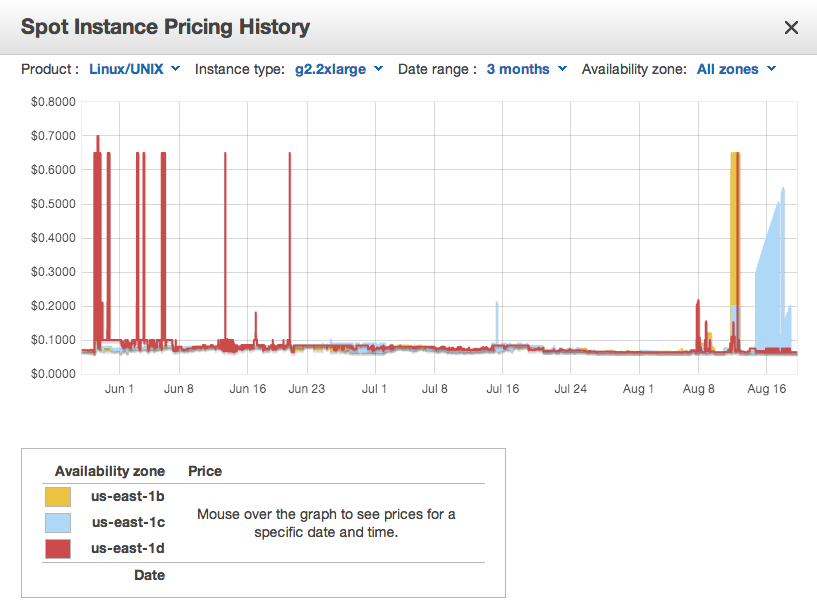</a>
</div>
<div>
</div>
<div>
My deep learning model is about 50x faster on a <em>g2.2xlarge </em>(which has 1,536 GPU cores) compared to a <em>c3.4xlarge </em>(which has 16 CPU cores) so the speedup is pretty substantial.
</div>
<p> </p>
<p> </p>
In defense of false positives (why you can't fail with A/B tests)2014-07-30T00:00:00Zhttps://erikbern.com/2014/07/30/in-defense-of-false-positives-why-you-cant-fail-with-ab-tests.html<p>Many years ago, I used to think that A/B tests were foolproof and all you need to do is compare the metrics for the two groups. The group with the highest conversion rate wins, right?</p>
<p>Then, for a long period, I ran a lot of tests. I started using confidence intervals, and learned about all the pitfalls of A/B testing. What to <a href="http://en.wikipedia.org/wiki/Bonferroni_correction">think about</a> when <a href="http://xkcd.com/882/">running many A/B tests</a>, why you <a href="http://www.evanmiller.org/how-not-to-run-an-ab-test.html">shouldn't check your metrics every day</a>, why you shouldn't optimize for a local maximum, and so on. I started becoming paranoid.</p>
<p>There's about a million blog posts out there saying how everyone's doing A/B testing wrong and how you should do it instead. It's like there's some secret society of people and the only way to join this club is to sacrifice a limb. <em>You clearly have no idea what you're doing… why are you even thinking about A/B testing? Go back and hack on your cousin's webshop, or else pick up this 1,500 page book about Bayesian statistics and come back in two years.</em></p>
<p>The other side of this is about half a gazillion people who argue that A/B testing is inherently flawed. What I <em>used</em> to say was: <em>Don't throw out the baby with the bathwater. As long as you're aware of the pitfalls, it's a great tool.</em> I thought for many years that running A/B test without a thorough understanding of all its shortcomings was dangerous.</p>
<p>But then I changed. Here's the thing: <strong>Even if you're doing A/B testing completely wrong, you are probably benefitting from it.</strong> Even if you don't care about confidence intervals, multiple comparison corrections, or if you are basically too impatient to wait, you probably are still doing the right thing. The reason is that <strong>user metrics optimization is not a drug trial.</strong></p>
<p>What do I mean with this? There's just a few things that govern the success of an A/B test</p>
<ol>
<li><em>The impact of a true positive.</em> Assuming you end up deploying the right thing, what's the business impact?</li>
<li><em>The cost of a false positive</em>. Assuming you end up deploying the wrong thing, what's the business impact?</li>
<li><em>The prior probability of success.</em> Before you start running the test, what's the probability of success? In the long run, what's the success rate of testing?</li>
</ol>
<p>For a drug trial, the impact of a true positive is huge. You found a cure for baldness! But the cost of a false positive is even bigger: it turns out your drug doesn't work, and it's also causing hallucinations. Finally, if you're a drug company, you probably evaluated 100 different drugs before finding one that seems to work, meaning the success rate of any specific drug is minimal.</p>
<p>This is why drug trials are subject to such intense scrutiny by government agencies. It's also <a href="http://www.plosmedicine.org/article/info%3Adoi%2F10.1371%2Fjournal.pmed.0020124">why most published research findings are false</a>.</p>
<p>But you're not a drug company, nor are you trying to find the <a href="http://en.wikipedia.org/wiki/Higgs_boson">Higgs boson</a>. You're basically evaluating whether a bigger “sign up” button leads to more conversions. In fact, most of your tests are driven by strong hypotheses with a large prior belief. You have a clever idea of how to impact users and historically few A/B tests show negative results.</p>
<p>The cost of deploying the wrong thing (false positives) is also low. You might end up with the wrong color button or some extra code that adds small tech debt. But not more than that. After all, a feature can't be horrible if metrics aren't tanking.</p>
<p>The other thing people argue a lot about is what success metric matters. In my experience, <em>it usually never matters</em>. I've very rarely seen statistically significant impacts going in two directions (one metric going up, the other going down) as long as you pick metrics in a sensible way (eg. avoid <a href="/2014/01/23/ratio-metrics.html">ratio metrics</a>). But what I have seen is insignificant tests. Lots of them. So if you have to pick a metric, the most important thing is <em>you should just pick the one with the largest signal to noise.</em> Just don't cherry-pick metric after the test is run.</p>
<p>Conclusion: Don't listen to all the haters. Do more A/B testing.</p>
Recurrent Neural Networks for Collaborative Filtering2014-06-28T00:00:00Zhttps://erikbern.com/2014/06/28/recurrent-neural-networks-for-collaborative-filtering.html<p>I’ve been spending quite some time lately playing around with RNN’s for collaborative filtering. RNN’s are models that predict a <em>sequence</em> of something. The beauty is that this something can be anything really – as long as you can design an output gate with a proper loss function, you can model essentially anything.</p>
<p>In the case of collaborative filtering, we will predict the next item given the previous items. More specifically, we will predict the next artist, album, or track, given the history of streams. Without loss of generalization, let’s assume we want to predict tracks only.</p>
<p>Note that we’re not trying to predict ratings or any explicit information – just what track the user chose to play.</p>
<p><strong>The data</strong></p>
<p>We use playlist data or session data, because it has an inherent sequence to it. Removing consecutive duplicates improves performance a lot, since otherwise the network just learns to predict the same item as it just predicted.</p>
<p>In our case we use a few billion playlist/sessions and in total about ten to a hundred billion “words”.</p>
<p><strong>The model</strong></p>
<p>Recurrent neural networks have a simple model that tries to predict the next item given all previous ones. After predicting the item, the network gets to “know” what item it was, and incorporates this.</p>
<p>More formally, let’s assume we have time steps $$ 0 \ldots t-1 $$ . The model has a “hidden” internal state $$ h_0 \ldots h_{t-1} $$ . These are generally vectors of some dimension $$ k $$ . Every time step, we have two things going on</p>
<ul>
<li>Predict the output given the hidden state. We need to model a $$ P(y_i \mid h_i) $$ for this.</li>
<li>Observe the output $$ y_t $$ and feed it back into the next hidden state $$ h_{i+1} $$ . In the most general form, $$ h_{i+1} = f(a(h_i) + b(y_i)) $$ . In practice, $$ f $$ is generally some nonlinear function like sigmoid or tanh, whereas $$ a $$ , and $$ b $$ are usually a simple linear transform. It depends a bit on the structure of the output.</li>
</ul>
<p><img src="https://erikbern.com/assets/2014/06/RNN-1.png" alt="image"></p>
<p>Now, all we need to do is write down the total likelihood and optimize for it!</p>
<p><strong>Wait a minute?</strong></p>
<p>Sorry about the extremely superficial introduction without much detail. Here's a more specific example:</p>
<p>Let's say we want to predict a sequence of daily stock returns. In that case, $$ y_i $$ is a vector of stock returns – maybe containing three values with the daily return for Apple, Google, and Microsoft. To get from the hidden state $$ h_i $$ to $$ y_i $$ let's just use a simple matrix multiplication: $$ y_i = W h_i $$</p>
<p>We can assume $$ P(y_i \mid h_i) $$ is a normal distribution because then the log-likelihood of the loss is just the (negative) L2 loss: $$ -(y_t - h_t)^2 $$</p>
<p>We can specify that $$ h_{i+1} = \tanh(Uy_i + Vh_i) $$ and that $$ h_0 = 0 $$ (remember it's still a vector). If we want to be more fancy we could add bias terms and stuff but let's ignore that for the purpose of this example. Our model is now completely specified and we have $$ 3k^2 $$ unknown parameters: $$ U $$ , $$ V $$ , and $$ W $$ .</p>
<p><strong>What are we optimizing?</strong></p>
<p>We want to find $$ U $$ , $$ V $$ , and $$ W $$ that maximizes the log-likelihood over all examples:</p>
<p>$$ \log L = \sum \limits_{\mbox{all examples}} \left( \sum \limits_{i=0}^{t-1} -(y_i - h_i)^2 \right) $$</p>
<p> </p>
<p><strong>Backprop</strong></p>
<p>The way to maximize the log-likelihood is through <a href="http://en.wikipedia.org/wiki/Backpropagation">back-propagation</a>. This is a well-known method and there's so much resources on line that I'll be a bit superficial about the details.</p>
<p>Anyway, we need to do two passes through each sequence. First propagation. For $$ i=0 \ldots t-1 $$ : Calculate all hidden states $$ h_i $$ . Nothing magic going on here, we're just applying our rule.</p>
<p>Now it's time for backprop. This is essentially just the chain rule taken to the extreme. Remember that the total log-likelihood is the sum of all the individual log-probabilities of observing each output:</p>
<p>$$ L = \sum \limits_{i=0}^{t-1} \log P(y_i \mid h_i) $$</p>
<p> </p>
<p>We define the derivatives $$ \delta_i $$ as the partial derivatives of the log-likelihood with respect to the hidden state:</p>
<p>$$ \delta_i = \frac{\partial \log L}{\partial h_i} $$</p>
<p> </p>
<p>Since each hidden state only influences later hidden states, the $$ \delta $$'s are just a function of all future $$ \delta_j, j = i \ldots t-1 $$ .</p>
<p>$$ \delta_i = \sum \limits_{j=i}^{t-1}\frac{\partial \log P(y_j \mid h_j)}{\partial h_i} $$</p>
<p>We can now rewrite $$ \delta_i $$ as a function of $$ \delta_{i+1} $$ and use some chain rule magic:</p>
<p>$$ \frac{\partial \log L}{\partial h_i} = \delta_i = \frac{\partial}{\partial h_i} \log P(y_i \mid h_i) + \frac{\partial h_{i+1}}{\partial h_{i}} \delta_{i+1} $$</p>
<p>We can evaluate this backwards from $$ t-1 \ldots 0 $$ . Both $$ P(y_i \mid h_i) $$ and $$ \frac{\partial h_{i+1}}{\partial h_{i}} $$ are specified by our model, so we just need to plug in the expressions.</p>
<p>For the stock price example, we have the unknown parameters $$ U, V, W $$ where we can derive the gradients like this:</p>
<ul>
<li>$$ \frac{\partial \log L}{\partial U} = \frac{\partial L}{\partial h_{i+1}}\frac{\partial h_{i+1}}{\partial U} = \delta_{i+1} \frac{\partial}{\partial U} \tanh(Uy_i + Vh_i) = \delta_{i+1} \tanh’(Uy_i + Vh_i) y_i^T $$</li>
</ul>
<p>This looks intimidating but it's really just a lot of chain rule applications and fairly straightforward math. You get similar gradients for $$ V, W $$ . Now that we have the gradients, we can optimize using stochastic gradient descent over lots of example.</p>
<p><strong>How does this relate to <a href="http://en.wikipedia.org/wiki/Hidden_Markov_models">Hidden Markov Models</a>?</strong></p>
<p>The nice thing about RNN's is that the relation between $$ h_{t+1} $$ and $$ h_t $$ is _exact_ rather than being some probabilistic relationship. This means that the $$ h $$ ‘s are not parameters in themselves, so we don't have to solve for them at all. This is usually the slow part of HMM's since figuring out the hidden values takes some slow iterative process like the <a href="http://en.wikipedia.org/wiki/Baum-Welch_algorithm">Baum-Welch algorithm</a>. For RNN's, we only need _two passes_ through each sequence rather than iterating lots of times until the hidden states converge.</p>
<p>The other thing is that RNN's need some kind of nonlinearity or else they magnitude of the hidden states will explode. This nonlinearity is usually taken to be sigmoid or tanh. I guess in theory HMM's could also use nonlinearities, but I've never heard of this.</p>
<p><strong>Predicting other things</strong></p>
<p>Let's focus on the collaborative filtering example. Given a sequence of watched movies, or tracks that the user has listened to, predict what the next one is going to be. Now $$ y_i $$ is not a scalar, but one out of many items. We need some kind of distribution $$ P(y_i \mid h_i) $$ . The one I've seen being used is the <a href="http://en.wikipedia.org/wiki/Softmax_function">Softmax distribution</a> over all possible outputs. This means we have to learn a vector $$ a_j $$ for each item. The probability $$ P(y_i \mid h_i) $$ is now proportional to $$ \exp(h_t^Ta_j) $$ :</p>
<p>$$ P(y_i \mid h_i) = \frac{\exp(h_t^Ta_j)}{\sum_k \exp(h_t^Ta_k)} $$</p>
<p> </p>
<p>Notice that the summation part in the denominator is over <em>all</em> items – something that is pretty slow to compute. I'll get back to that.</p>
<p>We also need something linking back the output to the next hidden state. In fact, we will learn another set of vectors $$ b_j $$ – one for each item. With slight abuse of notation, here is how it looks like:</p>
<p><img src="https://erikbern.com/assets/2014/06/RNN-2.png" alt="image"></p>
<p>Since we are learning a bunch of vectors, we don't need the matrices $$ U $$ and $$ V $$ . Our model now becomes:</p>
<p>$$ h_{i+1} = \tanh(W h_i + b_i) $$</p>
<p> </p>
<p>with some slight abuse of notation since the $$ b $$ ‘s are shared for each item $$ y_i $$ . Again, we want to maximize the total log-likelihood</p>
<p>$$ \sum \sum_{i=0}^t \log P(y_i \mid h_i) $$</p>
<p> </p>
<p>We now end up with a ton of parameters because we have the unknowns $$ a_j $$ ‘s and $$ b_j $$ ‘s for each item.</p>
<p>Let's just pause here and reflect a bit: so far this is essentially a model that works for any sequence of items. There's been some research on how to use this for natural language processing. In particular, check out Tomas Mikolov's work on <a href="http://rnnlm.org/">RNN's</a> (this is the same guy that invented <a href="https://code.google.com/p/word2vec/">word2vec</a>, so it's pretty cool.</p>
<p><strong>The gnarly details</strong></p>
<p>If you have 10 different items, you can evaluate $$ P(y_i \mid h_i) $$ easily, but not if you have five million items. But do not despair! There's a lot of ways you can attack this:</p>
<ul>
<li>Take the right output and sample some random items from the entire “vocabulary”. Train the model to classify which one is the right output. This is sort of like a police lineup: one is the right suspect, the remaining people just some random sample.</li>
<li><a href="http://www.iro.umontreal.ca/~lisa/pointeurs/hierarchical-nnlm-aistats05.pdf">Hierarchical softmax</a>: Put all items in a binary tree, and break it up into roughly $$ \log m $$ binary classification problems (where m is the size of the vocabulary).</li>
</ul>
<p>Instead of messing around with Hamming trees and things recommended in literature, I ended up implementing a much more simple version of hierarchical softmax. Internally, all item are described as integers, so I build the tree implicitly. The root node is a binary classifier for the last bit of the item. The next level classifies the second last bit, and so on.</p>
<p><img src="https://erikbern.com/assets/2014/06/hierarchical-softmax3.png" alt="image"></p>
<p>The idea is that you can calculate $$ P(y_i \mid h_i) $$ as the product of all the probabilities for each individual node on the path from the root to the leaf.</p>
<p>Instead of learning an $$ a_j $$ for every item, we just have to learn one for every node in the tree, in total $$ 2^{\lceil{log_2 m}\rceil -1} $$ vectors. It doesn't really matter that much how we build the tree – we don't need to enforce that similar items are close to each other in the tree (however that would probably improve performance a bit).</p>
<p>But in general, this problem pops up in a lot of places and here's some other crazy ideas I've thought about:</p>
<ul>
<li>If generating random “negative” samples, one way to better mine random examples would be to sample some items from the $$ y_i $$ ‘s themselves. Since those values are probably pretty similar, that would force the model to discriminate between more “hard” cases.</li>
<li>Assume the $$ a_j $$ ‘s have some kind of distribution like a Normal distribution, and calculate an expectation. This is just a bunch of integrals. We've had some success using this method in other cases.</li>
<li>Don't use softmax but instead use L2 loss on $$ m $$ binary classification problems. All entries would be $$ 0 $$ except the right one which is $$ 1 $$ . You can put more weight on the right one to address the class imbalance. The cool thing is that with L2 loss, everything becomes linear, and you can compute the sum over all items in constant time. This is essentially how <a href="http://dl.acm.org/citation.cfm?id=1511352">Yehuda Koren's 2008 paper</a> on implicit collaborative filtering works</li>
</ul>
<p><strong>Implementing it</strong></p>
<p>I ended up building everything in C++ because it's fast and I'm pretty comfortable with it. It reads about 10k words per second on a single thread. A multi-threaded version I've built can handle 10x that amount and we can parse 10B “words” in about a day.</p>
<p><strong>Hyperparameters</strong></p>
<p>A beautiful thing with this model is that <em>there's basically no hyperparameters.</em> The larger number of factors is better – we typically use 40-200. With dropout (see below) overfitting is not a concern. It takes a little trial and error to get the step sizes right though.</p>
<p><strong>Initialization</strong></p>
<p>As with most latent factor models, you need to initialize your parameter to random noise. Typically small Gaussian noise like $$ \mathcal{N}(0, 0.1^2) $$ works well.</p>
<p><strong>Nonlinearity</strong></p>
<p>I tried both sigmoid and tanh. Tanh makes more sense to me, because it's symmetric around 0, so you don't have to think too much about the bias term. Looking at some offline benchmarks, it seemed like tanh was slightly better than sigmoid.</p>
<p><strong>Dropout</strong></p>
<p>I also added <a href="http://arxiv.org/abs/1207.0580">dropout</a> to the hidden values since it seemed to help improve the predictions of the model. After the each $$ h_i $$ is calculated, I set half of them to zero. This also seems to help with exploding gradients. What happens is that the $$ W $$ matrix will essentially learn how to recombine the features</p>
<p><strong>Gradient clipping</strong></p>
<p>Actually gradient clipping wasn't needed for sigmoid, but for tanh I had to add it. Basically during the backprop I cap the magnitude of the gradient to 1. This also helps equalizing the impact of different examples since otherwise for longer sequences you get bigger gradients.</p>
<p><strong>Adagrad</strong></p>
<p>I use Adagrad on the item vectors but simple learning rate on the shared parameters $$ W $$ and the bias terms. Adagrad is fairly simple: in addition to each vector $$ a_j $$ and $$ b_j $$ you just store a single scalar with the sum of the squared magnitudes of the gradients. You then use that to normalize the gradient.</p>
<p>For a vector $$ x $$ with gradient $$ d $$ , Adagrad can be written as:</p>
<p>$$ x^{(n+1)} = x^{(n)} + \eta \frac{d^{(n)}}{\sqrt{\sum \limits_{i=1 \ldots n} \left( d^{(i)} \right)^2}} $$</p>
<p> </p>
<p>$$ \eta $$ is a hyperparameter that should be set to about half the final magnitude these vectors will have. I usually have had success just setting $$ \eta = 1 $$ .</p>
<p><strong>Results</strong></p>
<p>Offline results show that the RNN is one of the best performing algorithms for collaborative filtering and A/B tests confirm this.</p>
<p><strong>More resources</strong></p>
<p>I can recommend <a href="http://minds.jacobs-university.de/sites/default/files/uploads/papers/ESNTutorialRev.pdf">A tutorial on training recurrent neural networks</a> as another starting point to read more about recurrent neural networks.</p>
<p>(Edit: fixed some minor errors in the math and a wrong reference to Baum-Welch)</p>
Where do locals go in NYC?2014-06-17T00:00:00Zhttps://erikbern.com/2014/06/17/where-do-locals-go-in-nyc.html<p>One obvious thing to anyone living in NYC is how tourists cluster in certain areas. I was curious about the larger patterns around this, so I spent some time looking at data. The thing I wanted to understand is: what areas are dominated by tourists? Or conversely, what areas are dominated by locals?</p>
<p>After some looking around, I found this <a href="http://www.public.asu.edu/~hgao16/dataset.html">Foursquare data dump</a> and analyzed about 200,000 check-ins in NYC. Time to crunch some data…</p>
<p>First of all, I split up check ins into those done by (a) people living within 10,000 feet of the check in (b) people living further away. As the next step I broke up the check-ins by <a href="https://gist.github.com/MonsieurCactus/7387071">2,166 census areas</a> of New York and calculated the ratio of locals. I color-coded each census area from green (100% locals) to purple (0% locals). Here is the result, for the five boroughs:</p>
<p><img src="https://erikbern.com/assets/2014/06/locals1.png" alt="image"></p>
<p>Some obvious ones stand out, like the airports: JFK and LaGuardia, which are completely dominated by “non-locals” . Interestingly, Red Hook in Brooklyn also is dominated by non-locals (maybe because of IKEA?), as well as Prospect Park and some other areas in downtown Brooklyn. In Bronx, the area surrounding Yankee Stadium is also nearly 100% non-locals.</p>
<p>Maybe not surprisingly, there seems to be some truth to the joke that real New Yorkers do not go above 14th Street. Zooming into lower Manhattan, you can clearly see a sharp dividing line cutting across Manhattan:</p>
<p><img src="https://erikbern.com/assets/2014/06/locals-zoomed-in1.png" alt="image"></p>
<p>Another thing that stands out is how North Williamsburg is completely dominated by non-locals, maybe because of the huge influx of people on weekends going out partying.</p>
<p>I then split up into (a) people who live in the five boroughs (b) tourists, and color-coded into blue (0% tourists) and red (100% tourists):</p>
<p><img src="https://erikbern.com/assets/2014/06/tourism1.png" alt="image"></p>
<p>Airports are slightly biased towards tourists. Interestingly Red Hook now becomes a New York affair.</p>
<p>Zooming in on Lower Manhattan again:</p>
<p><img src="https://erikbern.com/assets/2014/06/tourism-zoomed-in2.png" alt="image"></p>
<p>Another thing that stands out is how North Williamsburg is dominated by New Yorkers, meaning that even though most people are not local, they are still from the city.</p>
<p>In contrast, most of Lower Manhattan (East Village, West Village, etc) isn't just dominated by locals, it's also very low ratio of tourists to New Yorkers.</p>
<p>The areas most dominated by tourists are, maybe not surprisingly</p>
<ul>
<li>Central Park</li>
<li>Times Square and parts of Midtown</li>
<li>Financial district</li>
<li>Liberty Island and Ellis Island</li>
</ul>
<p>I did this in Python, mostly using <a href="http://geopandas.org/">geopandas</a>, Matplotlib, and a bunch of open source data sets. It was a fun weekend project and it ended up taking way too much time. And since I live in Lower East Side myself, I'm probably pretty biased…</p>
How to build up a data team (everything I ever learned about recruiting)2014-06-08T00:00:00Zhttps://erikbern.com/2014/06/08/how-to-build-up-a-data-team-everything-i-ever-learned-about-recruiting.html<p>During my time at Spotify, I've reviewed thousands of resumes and interviewed hundreds of people. Lots of them were rejected but lots of them also got offers. Finally, I've also had my share of offers rejected by the candidate.</p>
<p>Recruiting is one of those things where the <a href="http://en.wikipedia.org/wiki/Dunning%E2%80%93Kruger_effect">Dunning-Kruger effect</a> is the most pronounced: the more you do it, the more you realize how bad you are at it. Every time I look back a year, I realize 10 things I did wrong. Extrapolating this, I know in another year I'll realize all the stupid mistakes I'm doing right now. Anyway, that being said, here are some things I learned from recruiting.</p>
<p><strong>Getting the word out</strong></p>
<p>Depending on where you work, people might have no clue about your company. Why would they work for something they have never heard of? Or alternatively – something they know of, but doesn't necessarily associate with cutting edge tech? There's a million companies out there doing cool stuff, so make sure that people know your company stands out. Blog, talk at meetups, <a href="https://github.com/spotify/luigi">open source stuff</a>, <a href="http://www.slideshare.net/erikbern/music-recommendations-mlconf-2014">go to conferences</a>. I honestly don't know what works – I don't have any numbers. But you need to hedge your bets by attacking on all angles at the same time.</p>
<p>I think developers have a hard time justifying this just because success is not easily quantifiable – this is a branding exercise, and it's super hard to find out if you're doing the right thing. But over time if you do this right, you will get anecdotal feedback from candidates coming in saying they saw your presentation or read this cool story on Hacker News, or what not.</p>
<p><strong>Finding the people</strong></p>
<p>I don't think there's anything magic about this – just go through external recruiters, internal recruiters, job postings, connections, whatever.</p>
<p><strong>Presenting the opportunity</strong></p>
<p>I think most people in the industry are fed up with bad bulk messages over email/LinkedIn. Ideally, the hiring manager should introduce themselves, or for more senior roles having more senior people reaching out (all the way up to the CTO). If a recruiter is reaching out, it's super important to make sure the recruiter can reach out to people with a quick note on what's interesting about the team and why it's a good fit.</p>
<p><strong>Finding the right candidates</strong></p>
<p>Recruiting is some crazy type of <a href="http://en.wikipedia.org/wiki/Active_learning">active learning</a> problem with this observation bias where you only see how well the people you hire are doing. In particular there was a lot of discussion a while back when <a href="https://www.linkedin.com/today/post/article/20130620142512-35894743-on-gpas-and-brain-teasers-new-insights-from-google-on-recruiting-and-hiring">Google claimed there was no correlation between test scores and GPA</a>. I think there totally are really strong correlations on a macro scale, but if you are already filtering out people based on those criteria, obviously you will reduce the strength, or even reverse it. Not that I claim to have found any magic criteria. I do however thing the two most successful traits that I've observed are (with the risk of sounding cheesy):</p>
<ol>
<li>Programming fluency (<a href="http://en.wikipedia.org/wiki/Outliers_(book)">10,000 hour rule</a> or whatever) – you need to be able to visualize large codebases, and understand how things fit together. I strongly believe that data engineers need to understand the full stack from idea, to machine learning algorithm, to code running in production. I've seen other companies having a “throw it over the fence” attitude, with one team brainstorming algorithms, another team in another city implementing them. I think that's a flawed way to have a tight learning cycle. In particular, I'm hesitant to hire candidates who are strong on the theoretical side, but with little experience writing code. That's why I really avoid the “data science” label – most people within this group are generally lacking on the core programming side. I don't think this necessarily means candidates has to have a solid understanding of the <a href="http://en.wikipedia.org/wiki/CAP_theorem">CAP theorem</a> and the linux <a href="http://en.wikipedia.org/wiki/Page_cache">page cache</a>. The most important thing is they have written a lot of code, can work with nontrivial code bases, and can write clean, maintainable code. There is nothing magic to this – but a person who only has written Matlab scripts probably will have a harder time adjusting.</li>
<li>Understand the big picture – go from a vision to a set of tasks, to a bunch of code being written. People have to be able to go from an idea (“analyze this data set and build an algorithm that uses it as a signal for the recommender system”) to code, without having to hand hold them throughout every single step. People who need to be given small tasks rather than the underlying problem will never understand why we're working on things, and will inevitably end up doing the wrong thing.</li>
</ol>
<div>
</div>
<div>
<strong>Attracting the right candidates</strong>
</div>
<div>
</div>
<div>
Even if you find awesome candidates, your interview process, or your lack of selling might destroy your prospects of hiring the right people. Here's some things I've learned
</div>
<div>
</div>
<div>
<ul>
<li>
Smart people are actually really impressed by good interview process. If some smart ML genius comes in and walks them through a super hard problem, the candidate will feel like they can learn from that interviewer. Conversely, giving interview problems that are not well structured, without any follow up questions, or discussion notes, will give a really bad impression. The best type of interview problems have a (b), (c) and (d) version that you can pull up in case the candidate nails (a) directly.
</li>
<li>
Understand the level of selling you need to do. If you get a super senior person in, spend the bare minimum to establish that this person actually lives up to their rumor. Then, spend the rest of the time explaining the role and why you are so excited about it.
</li>
<li>
Explaining the role and why it's a good fit is everything. But obviously not superficial stuff. These are engineers and you need to impress them with the stuff they will learn. Talk about why your company is working on, what challenges you have, what technologies you are using.
</li>
<li>
It's often much easier to start by listening to the candidate. Let them ask questions and talk more than you. Try to understand what they are looking for. Then, explain how this position meets or does not meet those criteria.
</li>
<li>
Everyone has an angle. Someone coming from finance is probably more excited to hear about your product vision. Someone from a small failed startup is probably more excited to hear about your benefits.
</li>
<li>
Make the candidate meet the team they will be working with. There's so many companies failing this. I remember going through a series of ten Google interviews many years ago and then the recruiter wouldn't tell me what team I would work on. I immediately turned down the offer. I think on the other side of the spectrum, the best thing you can do is to bring the candidate out on a team lunch to meet as many as possible.
</li>
<li>
Make them understand you take this role seriously. Set up a quick chat with the CTO or some senior people.
</li>
</ul>
</div>
<div>
</div>
<div>
<strong>Hiring the right candidate</strong>
</div>
<div>
</div>
<div>
<ul>
<li>
If it's a senior person, and everyone is super impressed, hire the person. If it's a senior person, and people are on the fence, you shouldn't hire the person.
</li>
<li>
If it's a junior person, it's sometimes hard to know. One thing I've learned is that excitement really counts. For instance the candidate kicks ass during the ML interview, and clearly has solid programming fluency, but doesn't necessarily know much about scalability and version control, then I really think it boils down to how excited this person is.
</li>
<li>
At the end of the day, if you realize this candidate is brilliant, but not necessarily the right fit for your role, find something else. It's a sign of a great organization that you can always find a place for smart people.
</li>
</ul>
<div>
<strong>Building the right team</strong>
</div>
<div>
</div>
<ul>
<li>
Candidates will be on a spectrum between “theoretical” (more ML stuff) or “applied” (more scalability, backend, data processing). But just for the purpose of the argument, let's assume people are on each side of the spectrum. For a high performing machine learning team, I think a ratio of 1:2 is good. But everyone should be able to work on every part of the system, if needed.
</li>
<li>
If you're a small company, you will end up hiring lots of people who are similar to yourself. I don't mean necessarily people of the same gender or origin, but people who will all go out to the same bar getting the same beer. This might good for cohesion early on, but as soon as you grow beyond the early stage, you might end up with a destructive monoculture that is super hard to break out of.
</li>
<li>
On the same note: if you're a big company and your team still skews a certain way, then it means you have prejudice problems you need to work on. Seriously. For instance, with the number of female software engineers <a href="http://www.techrepublic.com/blog/software-engineer/it-gender-gap-where-are-the-female-programmers/">being 20.2%</a>, you <a href="http://docs.scipy.org/doc/scipy-0.13.0/reference/generated/scipy.stats.binom.html">can derive</a> that 95% of all 50 people team should contain at least five women, and 70% of all teams should contain at least eight women. It's just plain math.
</li>
</ul>
<p>
For more reading on the subject, I just came across this interesting blog post by Cheng-Tao Chu: <a href="http://www.codecademy.com/blog/142-why-building-a-data-science-team-is-deceptively-hard">Why building a data science team is deceptively hard</a>.
</p>
</div>The power of ensembles2014-04-24T00:00:00Zhttps://erikbern.com/2014/04/24/the-power-of-ensembles.html<p>From my presentation at MLConf, one of the points I think is worth stressing again is how extremely well combining different algorithms works.</p>
<p><img src="https://erikbern.com/assets/2014/04/ensembles.png" alt="image"></p>
<p>In this case, we're training machine learning algorithms on different data sets (playlists, play counts, sessions) and different objectives (least squares, max likelihood). Then we combine all the models using gradient boosted decision trees training on a smaller but higher quality data set. Finally, we validate on a third data set, in this case looking at recall for a ground truth data set of related artists.</p>
<p>The ensemble was common knowledge throughout the Netflix prize, and the winner ended up <a href="http://www.netflixprize.com/assets/GrandPrize2009_BPC_BellKor.pdf">having many hundreds of models</a> in the ensemble. But measured in pure RMSE score the results weren't mind blowing – the best models weren't far from the best ensemble.</p>
<p>I think in a real world setting, chances are bigger that you have lots of models working on different data sets optimizing for different things. The bias of each model will be much larger, so the gains from combining all models are even larger.</p>
<p>Another difference in our case is we basically <em>don't know what to optimize for.</em> There's no single golden metric such as RMSE. Instead, we train things on different data sets. Eg individual models may be trained on playlists data, and the ensemble on thumbs. We then have a bunch of offline metrics as well as A/B test metrics we use to determine success.</p>
<p>Some people have suggested that these large ensembles are not practical and have tried to find a single good algorithm. I think this is a bad idea. Ensembles scale really well because you can parallelize all the work, and building a good framework it's easy to add or remove new models. Data changes all the time and a good ensemble with a bunch of models makes recommendations robust and less sensitive to shift in the underlying data.</p>
<p>Our ensemble looks quite different (and much bigger) than the picture above. We are thinking a lot about adding diversified signals from various machine learning algorithms applied to different data sets. These signals can be anything from collaborative filtering to dummy things, content-based, or editorial data. Pretty much anything that can be converted into a numerical signal can be used.</p>
MLConf 20142014-04-12T00:00:00Zhttps://erikbern.com/2014/04/12/mlconf-2014.html<p>Just spent a day at <a href="http://mlconf.com/">MLConf</a> where I was talking about how we do music recommendations. There was a whole range of great speakers (actually almost 2/3 women which was pretty cool in itself).</p>
<p>Here are my slides:</p>
<p><a href="https://twitter.com/JustinBasilico">Justin Basilico</a> from Netflix talked about how they deliver a personalized start page using lots of ranking</p>
<p><a href="https://sites.google.com/site/claudiaperlich/home">Claudia Perlich</a> also had a great presentation about ad targeting. A few things were really interesting: (a) using transfer learning to learn from web site visiting and apply it to add targeting (b) causality tests to figure out if a campaign actually made an impact (c) how they intentionally introduce bias in their classifiers by skewing subsampling. I think she also mentioned throwing in artificial negative data, which is something we do too.</p>
<p><a href="https://twitter.com/josh_wills">Josh Wills</a> had a hilarious slide about “ML as a tool” companies. His analogy was waiting two hours in a line for a roller coaster ride, and then someone jumps in front of you, rides the roller coaster, and gives you a video of the ride. His point was that ML is the 1% fun part, and 99% plumbing is the boring part. If you want to start a company, focus on the boring stuff no one else wants to deal with.</p>
Music recommendations using cover images (part 1)2014-04-01T00:00:00Zhttps://erikbern.com/2014/04/01/music-recommendations-using-cover-images-part-1.html<p>Scrolling through the <a href="https://play.spotify.com/discover">Discover page</a> on Spotify the other day it occurred to me that the album is in fact a fairly strong visual proxy for what kind of content you can expect from it. I started wondering if the album cover can in fact be used for recommendations. For many obvious reasons this is a kind of ridiculous idea, but still interesting enough that I just had to explore it a bit. So, I embarked on a journey to see how far I could get in a few hours.</p>
<p>First thing I did was to scrape all album covers. We have a few million of them (I don't think I could give you the exact number, or I would have to kill you). A full set of 64x64px images is 10 GB roughly, so not an insane amount.<figure id="attachment_481" style="width: 512px;" class="wp-caption alignnone"></p>
<p><img src="https://erikbern.com/assets/2014/04/covers.jpg" alt="image"><em>1024 random cover images in 16×16 px</em></p>
<p>My first attempt at defining “similarity” was simply to resize all images to 16×16, convert to grayscale, subtract the mean and normalize by the variance. Each cover image is then essentially a 256-vector in Euclidean space. Load those vectors into <a href="https://github.com/spotify/annoy">Annoy</a> and Bob's your uncle! Nice!</p>
<p>These recommendations turn out to be pretty horrible, at best.<figure id="attachment_484" style="width: 494px;" class="wp-caption alignnone"></p>
<p><img src="https://erikbern.com/assets/2014/04/thumbs-auc-grayscale-16x161.png" alt="image"><em>Classification score on predicting thumbs, measured by Area Under Curve (AUC). Random algorithm = 50%, higher numbers are better.</em></p>
<p>In the chart above, “covers” is the image-based method. “rnn” <a href="http://en.wikipedia.org/wiki/Recurrent_neural_network">is recurrent neural networks</a>, “koren” is <a href="http://labs.yahoo.com/files/HuKorenVolinsky-ICDM08.pdf">this paper</a> and “vector_exp” is a model <a href="/?p=396">I've described before</a>.</p>
<p>This image similarity algorithm gave some fun results, like finding out that the most similar album to the left one was the right one:</p>
<p><img src="https://erikbern.com/assets/2014/04/similar-albums-maurizio.png" alt="image"></p>
<p>In general, the only type of music I could reliably see this working on was minimal techno. Pretty much all minimal techno albums have a completely identical layout: a white (or light) circle on a black background:<figure id="attachment_490" style="width: 512px;" class="wp-caption alignnone"></p>
<p><img src="https://erikbern.com/assets/2014/04/covers2.jpg" alt="image"><em>Most similar covers for Kassem Mosse – Workshop 12: <a href="http://open.spotify.com/album/0NQvm5y6CLtjtbyJNZltFg">http://open.spotify.com/album/0NQvm5y6CLtjtbyJNZltFg</a></em></p>
<p>This wasn't enough to resolve the question, so I kept searching for the answer. I stumbled across <a href="https://pypi.python.org/pypi/pyleargist/2.0.5">pyleargist</a> by <a href="http://ogrisel.com/">Oliver Grisel</a> and to my delight it was trivial to install. Essentially pyleargist is a wrapper around a C library that takes any image and generates an image descriptor, which is a vector with 960 elements. Evaluating it using the same metric actually yields some fairly decent results:<figure id="attachment_486" style="width: 509px;" class="wp-caption alignnone"></p>
<p><img src="https://erikbern.com/assets/2014/04/thumbs-auc-pyleargist.png" alt="image"><em>Classification score on predicting thumbs, measured by Area Under Curve (AUC). Random algorithm = 50%, higher numbers are better.</em></p>
<p>The results are already not that horrible (although with a very biased and quite unreliable metric). At least it's definitely better than pure random.<figure id="attachment_495" style="width: 512px;" class="wp-caption alignnone"></p>
<p><img src="https://erikbern.com/assets/2014/04/output4.jpg" alt="image"><em>Most similar album covers to Daft Punk's – Random Access Memories</em></p>
<p>At this point I decided the next step on this journey of overengineering would be either, or possibly both out of</p>
<ol>
<li>Learning a mapping from image space to collaborative filtering space. That way we learn which features in the picture are relevant for the music. This is a similar idea to <a href="http://papers.nips.cc/paper/5004-deep-content-based-music-recommendation.pdf">this paper</a>.</li>
<li>Venture into the realms of <em>deep learning</em>. I went to <a href="https://twitter.com/bernhardsson/status/448888021828763648">the Twitters</a> for some assistance and got a ton of response back.</li>
</ol>
<p>This is an ongoing project (and an ongoing source of frustrations) so I'll defer the updates to a second part. Stay tuned!</p>
<p>Edit: Was linking to the wrong paper by Sander Dieleman's paper!</p>
Luigi success2014-03-22T00:00:00Zhttps://erikbern.com/2014/03/22/luigi-party.html<p>So <a href="https://github.com/spotify/luigi">Luigi</a>, our open sourced workflow engine in Python, just recently passed 1,000 stars on Github, then shortly after passed <a href="https://github.com/yelp/mrjob">mrjob</a> as (I think) the most popular Python package to do Hadoop stuff. This is exciting!</p>
<p><img src="https://erikbern.com/assets/2014/03/luigi-toy.jpg" alt="image"></p>
<p>A fun anecdote from last week: we accidentally deleted roughly 10TB of data on HDFS, and the output of 1,000s of jobs. This could have been a disaster, but luckily most of the data was intermediate, and luckily everything we do is powered by Luigi meaning it's encoded as a big huge dependency graph in Python. Some of it is Hadoop jobs, some of it inserts data in Cassandra, some of it trains machine learning models, and much more. The Hadoop jobs are a happy mixture between inline Python jobs and jobs using <a href="https://github.com/twitter/scalding">Scalding</a>.</p>
<p>So anyway, Luigi happily picked up that a bunch of data was missing, traversed the dependency graph backwards, and scheduled everything it needed. A few hours (and a heavly loaded cluster) later, everything was recreated.</p>
<p><img src="https://erikbern.com/assets/2014/03/luigi-recovery.png" alt="image"></p>
Welcome Echo Nest!2014-03-22T00:00:00Zhttps://erikbern.com/2014/03/22/welcome-echo-nest.html<p>In case you missed it, we just acquired a company called <a href="http://echonest.com">Echo Nest</a> in Boston. These people have been obsessed with understanding music for the past 8 years since it was founded by <a href="https://twitter.com/bwhitman">Brian Whitman</a> and <a href="https://twitter.com/tjehan">Tristan Jehan</a> out of MIT Medialab.</p>
<p>We think this is such a great fit in a lot of ways. In particular, they have focused on very complementary things to what we have. While we have spent a lot of time on things like collaborative filtering, A/B testing, learning from user feedback, and scalability, they have spent time on audio analysis, cultural understanding through web scraping, playlisting, and building a <a href="http://developer.echonest.com/docs/v4">kick ass API</a>.</p>
<p><img src="https://erikbern.com/assets/2014/03/Screen-Shot-2014-03-22-at-11.29.42-AM.png" alt="image"></p>
<p>For some info about what Echo Nest has been up to, check out Paul Lamere's <a href="http://musicmachinery.com/">Music Machinery blog</a> as well as <a href="http://notes.variogr.am/">Brian Whitman's blog.</a></p>
<p>We're super excited on starting to incorporate Echo Nest's technology into our own product and we already have a couple of things in the pipe we might launch shortly. Stay tuned!</p>
Momentum strategies2014-03-03T00:00:00Zhttps://erikbern.com/2014/03/03/momentum-strategies.html<p>Haven't posted anything in ages, so here's a quick hack I threw together in Python on a Sunday night. Basically I wanted to know whether momentum strategies work well for international stock indexes. I spent a bit of time putting together a strategy that buys the stock index if the return during the previous n days was positive, otherwise doesn't do anything. I ran this strategy for a basket of approximately 20 stock markets.</p>
<p>Anyway, disregarding transaction costs, yada yada, historical returns are not a guarantee for future returns, blah blah, here are the results. It doesn't matter which window size we use, we still make a little bit more money from a momentum strategy:<figure id="attachment_457" style="width: 800px;" class="wp-caption alignnone"></p>
<p><img src="https://erikbern.com/assets/2014/03/indices.png" alt="image"><em>Returns for each strategy. Click picture to see source code</em></p>
<p>Minor note: the returns above ignore volatility, actually understating the impact. Looking at <a href="http://en.wikipedia.org/wiki/Sharpe_ratio">Sharpe ratios</a> instead, the momentum strategies have ratios between 1.08-1.40, whereas the “Buy and Hold” strategy has a Sharpe ratio of 0.49.</p>
<p>This whole exercise was mostly for fun, but it was a delight how easy it was. I just installed <a href="https://pypi.python.org/pypi/ystockquote">ystockquote</a> and was able to put everything together within an hour. I've worked in finance, where this was almost harder to do. With such a low barrier, I almost consider it a duty for any hacker with a trading account to spend some time hacking on their finances. I will certainly spend more time analyzing my trades. Not necessarily engaging in anything crazy though, and I certainly discourage anyone from doing so.</p>
Ratio metrics2014-01-23T00:00:00Zhttps://erikbern.com/2014/01/23/ratio-metrics.html<p>We run a ton of A/B tests at Spotify and we look at a ton of metrics. Defining metrics is a little bit of an art form. Ideally you want to define success metrics before you run a test to avoid cherry picking metrics. You also want to define a metric that has as high signal to noise ratio. And of course, most importantly, your metric should ideally correlate to high level business impact as much as possible.</p>
<p>One pet peeve I have is metrics <em>defined as ratios.</em> While some of them are useful, there are usually severe caveats that you can spot by just thinking about what goes in the numerator and what goes into the denominator.</p>
<p><strong>Example 1: Average session length</strong></p>
<p>Bad metric. What happens if you add a couple of short-term sessions on top of your existing numbers without changing anything else? Eg. you could improve the number of sessions by 10% but the total session time by 5%. This is a good thing, but your metric would tell another story.</p>
<p><strong>Example 2: Number of clicks per user</strong></p>
<p>What if you launch a feature that sucks and you churn out a bunch of low-intent users? You might end up with high-intent users who drive this up, going against what you mean by “success”.</p>
<p><strong>Example 3: Repeat consumption (or bounce rate)</strong></p>
<p>If you encourage content discovery, you might hope that people enjoy new content so much they come back to it. But you might also improve superficial discovery even more so, meaning this metric goes down.</p>
<p><strong>Example 4: Skip rate</strong></p>
<p>Imagine Spotify Radio. Same thing as 2: churning out a bunch of low-intent users may actually improve the skip rate, although this is a bad thing. Conversely, building a better product might paradoxically <em>increase</em> skip rate, because an influx of low-intent users who dig the feature.</p>
<p><strong>So what metric should you use?</strong></p>
<p>In general, unless you have a really good reason for it, avoid metrics that look at the <em>ratio between two quantities.</em> Instead, I prefer metrics such as total time, number of daily active users, total number of clicks. These metrics are pretty uninteresting in themselves (what does it tell you that the user base spent 10,000 years listening to playlists yesterday?) but they <em>let you draw conclusions about the differences.</em> Eg. if the total number of clicks went up by +5%, then that's a good thing.</p>
<p>For A/B tests where you have uneven proportions between groups, you can simply extrapolate to the whole population by dividing by the ratios. Eg. if 1% of the users are in test group A, and 2% in group B, multiply the metrics by 100x and 50x, respectively. Alternatively, just divide them by the total number of registered users in each bucket. That's a static denominator, so it's totally cool to do so.</p>
<p>There's of a million pitfalls with A/B testing and using metrics. This is not an argument against any of it <em>per se</em>. Don't throw out the baby with the bathwater, just stay cool and make sure you <a href="http://www.imdb.com/title/tt0097216/">do the right thing</a> :)</p>
Benchmarking nearest neighbor libraries in Python2014-01-12T00:00:00Zhttps://erikbern.com/2014/01/12/benchmarking-nearest-neighbor-libraries-in-python.html<p><a href="https://twitter.com/RadimRehurek">Radim Rehurek</a> has put together an excellent summary of approximate nearest neighbor libraries in Python. This is exciting, because one of the libraries he's covering, <a href="https://github.com/spotify/annoy">annoy</a>, was built by me.</p>
<p>After <a href="http://radimrehurek.com/2013/11/performance-shootout-of-nearest-neighbours-intro/">introducing the problem</a>, he goes <a href="http://radimrehurek.com/2013/12/performance-shootout-of-nearest-neighbours-contestants">through the list of contestants</a> and sticks with five remaining ones. Finally, <a href="http://radimrehurek.com/2014/01/performance-shootout-of-nearest-neighbours-querying/">the benchmarks</a> pits annoy against <a href="https://github.com/mariusmuja/flann">FLANN</a>. Although FLANN seems to have roughly 4x better performance, somewhat surprisingly, Radim concludes annoy is the “winner”. Yay!<figure id="attachment_443" style="width: 1213px;" class="wp-caption alignnone"></p>
<p><img src="https://erikbern.com/assets/2014/01/flann_annoy1000.png" alt="image"><em>1000 nearest neighbors, performance vs accuracy, stolen from Radim's blog</em></p>
<p>I'm not surprised that FLANN is a bit faster. Annoy was mainly built having other goals in mind, primarily being able to use a file based memory range and mmap this quickly. I also think the current algorithm (random hyperplanes) works better with at most a hundred dimensions or so. That being said, at some point I think there's a lot of optimizations to do to Annoy some day when the urge to <a href="https://github.com/spotify/annoy/blob/master/src/annoylib.cc">write messy C++</a> comes back.</p>
<p>Radim does give some fair criticism of the state of these libraries (including annoy). It can be a pain to install any of them, and in annoy's case there seems to be some problems with certain architectures where it basically returns bogus data. Given that this is such a fundamental problem, it's a little depressing how hard it is to use. Hoping this can change soon with more and more competing libraries out there.</p>
More recommender algorithms2013-12-20T00:00:00Zhttps://erikbern.com/2013/12/20/more-insight-into-recommender-algorithms.html<p>I wanted to share some more insight into the algorithms we use at Spotify. One matrix factorization algorithm we have used for a while assumes that we have user vectors $$ bf{a}_u $$ and item vectors $$ bf{b}_i $$ . The next track $$ i $$ for a user is now given by the relation</p>
<p>$$ P(i \mid u) = exp(bf{a}_u^T bf{b}_i) / Z_u $$</p>
<p> </p>
<p>Where $$ Z_u $$ is a normalization constant to make sure the probabilities add up to one. This essentially means we treat the tracks choices as outputs of a <a href="http://en.wikipedia.org/wiki/Softmax_activation_function">softmax</a>. You can think of it as a series of $$ n_u $$ choices for each user, where $$ n_u $$ is the number of tracks they played. Every track is a choice where the probability of each track is given by a softmax distribution. We don't care about the order of these choices, but we assume each choice is independent of the other.</p>
<p>Assuming we have a ton of historical data where user $$ u $$ listened $$ n_{ui} $$ times to track $$ i $$ , we get a total log-likelihood (after simplifying a bit).</p>
<p>$$ log L = sum_{u, i} n_{ui}left(bf{a}_u^T bf{b}_i - log Z_uright) = left(sum_{u, i} n_{ui}bf{a}_u^T bf{b}_iright) - left( sum_u n_u log Z_uright) $$</p>
<p> </p>
<p>Note that $$ Z_u $$ only has to be calculated once for every user. Although it's a sum over all tracks, in practice we can estimate it by sampling random tracks and extrapolating.</p>
<p>Turns out you can implement this as a Hadoop job (<a href="http://wwwconference.org/www2007/papers/paper570.pdf">this paper</a> is quite helpful) doing alternate gradient ascent. Convergence isn't super fast, but the results look qualitatively better than other methods like <a href="http://en.wikipedia.org/wiki/Probabilistic_latent_semantic_analysis">PLSA</a> and <a href="http://www2.research.att.com/~yifanhu/PUB/cf.pdf">the algorithm by Koren et al</a> that seems to be pretty popular.</p>
<p>Measured as a pure predictive model, the model described above doesn't perform super well. In the graph above, we look at how well the algorithm ranks future items in a validation set, including items the user didn't play. We use the Gini coefficient, the higher, the better. The model described above is “User MF beta=1.0, f=40″ (I'll follow up and explain beta in a later post). <em>HKV</em> refers to the model by Koren et al (because the authors of that paper were Hu, Koren, and Volinsky).</p>
<p><img src="https://erikbern.com/assets/2013/12/giniall-convergence.png" alt="image"></p>
<p>In the plot above, the x axis represents the number of iterations, whereas the y-axis gives the value of the Gini coefficient.</p>
<p>However, turns out if we look only at <em>items that the user played at least once</em>, the algorithm kicks ass (especially if try different values for beta, which I'll get back to at some point). It also makes sense that this is a more useful metric to look at, since if a user plays a track zero times, it's probably likely they didn't actually know about the track in the first place.</p>
<p><img src="https://erikbern.com/assets/2013/12/ginipos-convergence.png" alt="image"></p>
<p>We also have a lot of other internal metrics that show that this model outperforms pretty much anything else. It is substantially better at predicting radio skips and thumbs, it's much better at ranking related artists, etc.</p>
<p>Here are some examples of related artists as ranked by the cosine between the vectors:</p>
<table>
<tr>
<th>
Artist
</th>
<pre><code><th>
Most related artists by this algo
</th>
<th>
Most related artists by Koren et al's algo
</th>
</code></pre>
</tr>
<tr>
<th>
Daft Punk
</th>
<pre><code><td>
Justice<br /> Gorillaz<br /> Deadmau5<br /> The Chemical Brothers<br /> Fatboy Slim
</td>
<td>
Florence + The Machine<br /> Red Hot Chili Peppers<br /> Kings of Leon<br /> Muse<br /> Lana Del Rey
</td>
</code></pre>
</tr>
<tr>
<th>
Beach Boys
</th>
<pre><code><td>
Simon & Garfunkel<br /> The Rolling Stones<br /> The Mamas & The Papas<br /> The Monkees<br /> Elton John
</td>
<td>
Simon & Garfunkel<br /> Bob Dylan<br /> David Bowie<br /> Billy Joel<br /> Fleetwood Mac
</td>
</code></pre>
</tr>
<tr>
<th>
Eminem
</th>
<pre><code><td>
Dr. Dre<br /> 50 Cent<br /> B.o.B<br /> Ludacris<br /> The Black Eyed Peas
</td>
<td>
Rihanna<br /> David Guetta<br /> Maroon 5<br /> Katy Perry<br /> Beyoncé
</td>
</code></pre>
</tr>
<tr>
<th>
Beyoncé
</th>
<pre><code><td>
Rihanna<br /> Alicia Keys<br /> Christina Aguilera<br /> Usher<br /> Bruno Mars
</td>
<td>
Rihanna<br /> Katy Perry<br /> David Guetta<br /> Maroon 5<br /> The Black Eyed Peas
</td>
</code></pre>
</tr>
</table>Microsoft's new marketing strategy: give up2013-12-12T00:00:00Zhttps://erikbern.com/2013/12/12/microsofts-new-marketing-strategy-give-up.html<p>I think it's funny how MS at some point realized they are not the cool kids and there's no reason to appeal to that target audience. Their new marketing strategy finally admits what's been long known: the correlation between “business casual” and using Microsoft products:</p>
<p><img src="https://erikbern.com/assets/2013/12/honestly_34.png" alt="image"></p>
<p>Apparently it's also for people in ties:</p>
<p><img src="https://erikbern.com/assets/2013/12/honestly_2.png" alt="image"></p>
<p>And let's add a (beige?) cardigan on top of that:</p>
<p><img src="https://erikbern.com/assets/2013/12/honestly_1.png" alt="image"></p>
<p>On top of that, let's be sexists and add a woman to the campaign who doesn't care about work but likes to take photos!</p>
<p><img src="https://erikbern.com/assets/2013/12/honestly_4.png" alt="image"></p>
<p>Yay forward thinking company!</p>
Bagging as a regularizer2013-12-06T00:00:00Zhttps://erikbern.com/2013/12/06/bagging-as-a-regularizer.html<p>One thing I encountered today was a trick using <a href="http://en.wikipedia.org/wiki/Bootstrap_aggregating">bagging</a> as a way to go beyond a point estimate and get an approximation for the full distribution. This can then be used to penalize predictions with larger uncertainty, which helps reducing false positives.</p>
<p>To me it sounds like a useful trick that I found roughly <em>0 hits on Google</em> for, so I thought I'd share it. Of course, it might be that I've completely gotten something backwards (my ML skills have some notable gaps), so let me know if that's the case.</p>
<p>Here's a little toy model to illustrate the idea. Let's assume we have observations $$ x_i $$ which are $$ mathcal{N}(0, 1) $$ . We also have $$ y_i = 0.2 + 0.3 / (1 + x_i^2) $$ and labels $$ z_i $$ sampled from the Bernoulli distribution given by $$ P(z_i=1) = y_i $$ (i.e. just flipping a weighted coin where the odds are determined by $$ y_i $$ .</p>
<p><a href="http://en.wikipedia.org/wiki/Gradient_boosting#Gradient_tree_boosting">Gradient Boosted Decision Trees</a> are among the state of the art in regression and classification and can have amazing performance. <a href="http://scikit-learn.org/stable/modules/generated/sklearn.ensemble.GradientBoostingRegressor.html">They are available in scikit-learn</a> and easy to plug into an existing script.</p>
<p>Let's say we want to find the best choices for $$ x $$ that gives large values of $$ y $$ . For instance, maybe we have click data and we want to find what items will get most clicks. We fit a GBDT to the $$ (x_i, z_i) $$ observations to train a model that predicts whether an item is going to get clicked or not based on the value of $$ x $$ .</p>
<p><img src="https://erikbern.com/assets/2013/12/plot5.png" alt="image"></p>
<p>Unfortunately, we might end up getting wild predictions. In this particular case, a single noisy point in the training data around $$ x_i=-4 $$ makes the model believe that large negative values of $$ x $$ are good for maximizing $$ y $$ .</p>
<p>Here's the trick. Instead of training a single GBDT, we train 100 smaller GBDT's on strongly subsampled data (instead of 1000 data points, we sample 100 with replacement). Now, we can use all the predicted values of each GBDT to give us an idea of the uncertainty of of $$ y $$ . This is awesome, because (among other things) we can penalize uncertain estimates. In this case, I just picked the value at the 20th percentile. I have to confess I'm still a little unsure whether the distribution of $$ y $$ represents a probability distribution, but I think this is just an example of <a href="http://en.wikipedia.org/wiki/Bootstrapping_(statistics)">bootrapping</a> and you could also Bayes rule with a prior to derive a posterior distribution.</p>
<p><img src="https://erikbern.com/assets/2013/12/plot41.png" alt="image"></p>
<p>Why could this be useful? For instance, when we recommend music at Spotify, it's much more important to err on the safe side and remove false positives at the cost of false negatives. If we can explicitly penalize uncertainty, then we can focus on recommendations that are safe bets and have more support in historical data.</p>
<p> </p>
Model benchmarks2013-11-02T00:00:00Zhttps://erikbern.com/2013/11/02/model-benchmarks.html<p>A lot of people have asked me what models we use for recommendations at Spotify so I wanted to share some insights. Here's benchmarks for some models. Note that we don't use all of them in production.<figure id="attachment_341" style="width: 495px;" class="wp-caption alignnone"></p>
<p><img src="https://erikbern.com/assets/2013/11/algo-performance.png" alt="image"><em>Performance for recommender models</em></p>
<p>This particular benchmark looks at how well we are able to rank “related artists”. More info about models:</p>
<ul>
<li>vector_exp: Our own method, a latent factor method trained on all log data using Hadoop (50B+ events).</li>
<li>word2vec: Google's open sourced <a href="https://code.google.com/p/word2vec/">word2vec</a>. We train a model on subsampled (5%) playlist data using skip-grams and 40 factors.</li>
<li>rnn: <a href="http://minds.jacobs-university.de/sites/default/files/uploads/papers/ESNTutorialRev.pdf">Recurrent Neural Networks</a> trained on session data (users playing tracks in a sequence). With 40 nodes in each layer, using <a href="http://www.iro.umontreal.ca/~lisa/pointeurs/hierarchical-nnlm-aistats05.pdf">Hierarchical Softmax</a> for the output layer and <a href="http://arxiv.org/pdf/1207.0580.pdf">dropout</a> for regularization.</li>
<li>koren: <a href="http://www2.research.att.com/~yifanhu/PUB/cf.pdf">Collaborative Filtering for Implicit Feedback Datasets</a>. Trained on same data as vector_exp. Running in Hadoop, 40 factors.</li>
<li>lda: <a href="http://en.wikipedia.org/wiki/Latent_Dirichlet_allocation">Latent Dirichlet Allocation</a> using 400 topics, same dataset as above, also running in Hadoop.</li>
<li>freebase: Training a latent factor model on artist entities in the <a href="http://www.freebase.com/">Freebase</a> dump.</li>
<li>plsa: <a href="http://en.wikipedia.org/wiki/Probabilistic_latent_semantic_analysis">Probabilistic Latent Semantic Analysis</a>, using 40 factors and same dataset/framework as above. More factors give significantly better results, but still nothing that can compete with the other models.</li>
</ul>
<p>Again, not all of these models are in production, and conversely, we have other algorithms not included above that are in production. This is just a selections of things we've experimented with. In particular, I think it's interesting to note that neither PLSA nor LDA perform very well. Taking sequence into account (rnn, word2vec) seems to add a lot of value, but our best model (vector_exp) is a pure <a href="http://en.wikipedia.org/wiki/Bag-of-words_model">bag-of-words</a> model.</p>
statself.com2013-10-18T00:00:00Zhttps://erikbern.com/2013/10/18/statself-com.html<p>Btw I just put something up online that I spent a couple of evenings in my couch putting together: it's a website where you can track any numerical data on the web. Want to know how many <a href="http://statself.com/series/3acd40e5">Twitter followers</a> you have? <a href="http://statself.com/series/5b46b219">Temperature in NYC</a>? Go to <a href="http://statself.com">statself.com</a> and start tracking it.</p>
<p>Actually statself.com was just a domain name I had lying around for something else, but it turned out to fit pretty well.</p>
<p>I'm not a web developer but sometimes it's nice to see how easy doing complex web apps has become. I put together something in a few afternoons using Tornado, Bootstrap, etc – something that would have taken weeks a few years ago.</p>
Implicit data and collaborative filtering2013-09-16T00:00:00Zhttps://erikbern.com/2013/09/16/implicit-data-and-collaborative-filtering.html<p>A lot of people these days know about collaborative filtering. It's that Netflix Prize thing, right? People rate things 1-5 stars and then you have to predict missing ratings.</p>
<p>While there's no doubt that the Netflix Prize was successful, I think it created an illusion that all recommender systems care about explicit 1-5 ratings and RMSE as the objective. Some people even distrust me when I talk about the approach we take at Spotify.</p>
<p><strong>Misconception 1: Recommender systems are about predicting missing ratings.</strong></p>
<p>This is not true. In our case at Spotify, we have a huge matrix with users and items and each element containing the number of times user <em>u</em> played track <em>i</em>. Note that <em>all of the matrix entries are known</em>. Zero is a zero, and it means that user <em>u</em> actually played track <em>i</em> exactly 0 times.</p>
<p>Actually, even Netflix themselves <a href="http://www.wired.com/underwire/2013/08/qq_netflix-algorithm/">have stated</a> that there's much more information in the implicit data than the explicit. Using implicit data has received a lot less attention, probably because the Netflix Prize was so successful.</p>
<p><strong>Misconception 2: Recommender systems use squared loss.</strong></p>
<p>This is one of my biggest pet peeves. Think about it – what does squared loss mean, from a Bayesian perspective? It means you assume that the errors are all from a normal distribution. This is a reasonable approximation for 1-5 star rating (although questionable even there), but it's definitely a horrible way to fit play count data (a reasonable approximation would be Poisson). Some people's reaction to this is to transform the data to a more reasonable scale before taking the squared difference, but then your model gets even more complicated to interpret.</p>
<p>If there's one lesson here, it's definitely that <em>every loss function is an assumption about how data is generated.</em> That's why I prefer generative models in the first place, such as <a href="http://en.wikipedia.org/wiki/Probabilistic_latent_semantic_analysis">PLSA</a> or <a href="http://en.wikipedia.org/wiki/Latent_Dirichlet_allocation">LDA</a>. These methods were originally developed for text classification, but the <a href="http://en.wikipedia.org/wiki/Bag-of-words_model">“bag of words”</a> approach turns out to work great for implicit collaborative filtering. Note that there are <a href="http://www2.research.att.com/~yifanhu/PUB/cf.pdf">some algorithms</a> that use squared loss even for <em>implicit</em> collaborative filtering, but I'm not sure what they assume about the data really.</p>
<p><strong>Misconception 3: Recommender systems are predictive models.</strong></p>
<p>This is a subtle one. You can look at the Netflix Prize as a challenge to predict unknown values, and in the same way you can look at implicit collaborative filtering as essentially a predictive model where you are trying to predict what the user is going to do in the future. But just because you can predict that user <em>u</em> is going to play track <em>i</em>, does that mean it's a good recommendation? After all, there might be some super obscure track <em>j</em> that user <em>u</em> would love if they actually had found it. Just recommending most likely track <em>i</em> introduces a strong popularity bias.</p>
<p>This relates to the previous question. Even if we found a loss function that relates to the generative model, it doesn't mean we have a way of optimizing recommendation quality by minimizing some loss function. So what should we do? Luckily, it turns out there's some tricks you can do, like normalizing for popularity, that work reasonably well in practice.</p>
<p><strong>Misconception 4: Recommender systems are all about recommending items to users.</strong></p>
<p>I would actually argue that detecting item similarity using collaborative filtering is more important. This is another thing where I've hardly seen any research, and I don't really have a lot of good ideas, although for some reason item-item cosine works really well in latent factor models.</p>
Vote for our SXSW panel!2013-09-04T00:00:00Zhttps://erikbern.com/2013/09/04/vote-for-our-sxsw-panel.html<p>If you have a few minutes, you should check out mine and <a href="https://twitter.com/mrchrisjohnson">Chris Johnson</a>‘s panel proposal. Go here and vote: <a href="http://panelpicker.sxsw.com/vote/24504">http://panelpicker.sxsw.com/vote/24504</a></p>
<p><strong>Algorithmic Music Discovery at Spotify</strong></p>
<p>****Spotify crunches hundreds of billions of streams to analyze user's music taste and provide music recommendations for its users. We will discuss how the algorithms work, how they fit in within the products, what the problems are and where we think music discovery is going. The talk will be quite technical with a focus on the concepts and methods, mainly how we use large scale machine learning, but we will also some aspects of music discovery from a user perspective that greatly influenced the design decisions.</p>
What's up with music recommendations?2013-08-17T00:00:00Zhttps://erikbern.com/2013/08/17/306.html<p>I just answered a Quora question about <a href="http://www.quora.com/Machine-Learning/What-if-any-are-the-differences-in-the-algorithms-that-are-behind-recommendations-for-music-and-movies/answer/Erik-Bernhardsson?__snids__=163790174&__nsrc__=1">what, if any, are the differences in the algorithms that are behind recommendations for music and movies</a>.</p>
<p>Of course, every media type is different. For instance, there's fundamental reasons why latent factor models works really well for music and movies, as opposed to <a href="http://www.scribd.com/doc/86498718/Machine-Learning-with-Large-Networks-of-People-and-Places">location recommendations</a> where I suspect graph based models are more powerful. <a href="http://www.stanford.edu/~rezab/papers/wtf_overview.pdf">People recommendations</a> is another animal and I'm sure <a href="http://homepages.cae.wisc.edu/~jamieson/me/BeerMapper.html">beer recommendations</a> has its own domain-specific quirks.</p>
<p> </p>
3D2013-08-12T00:00:00Zhttps://erikbern.com/2013/08/12/3d.html<p><a href="http://www.a1k0n.net">Andy Sloane</a> decided to call my 2D visualization and <a href="http://www.a1k0n.net/spotify/artist-viz/">raise it to 3D</a>.</p>
<p>(Looks a little weird in the iframe but check out the link). It's based on a <a href="https://en.wikipedia.org/wiki/Latent_Dirichlet_allocation">LDA</a> model with 200 topics, so the artists tend to stick to clusters where each cluster is a topic. The embedding also uses <a href="http://homepage.tudelft.nl/19j49/t-SNE.html">t-SNE</a> but in three dimensions (obviously).</p>
2D embedding of 5k artists = WIN2013-08-11T00:00:00Zhttps://erikbern.com/2013/08/11/2d-embedding-of-5k-artists-win.html<p>I'm at <a href="http://www.kdd.org/kdd2013/">KDD</a> in Chicago for a few days. We have a Spotify booth tomorrow, and I wanted to put together some cool graphics to show. I've been thinking about doing a 2D embedding of the top artists forever since I read about <a href="http://homepage.tudelft.nl/19j49/t-SNE.html">t-SNE</a> and other papers so this was a perfect opportunity to spend some time on it.</p>
<p>So – I spent a couple of hours taking the lower dimensionality representation of all artists, plugging it into the C++ implementation they provide, then using <a href="http://matplotlib.org/">matplotlib</a> to render something cool. Like all good visualizations, it took me roughly 30 minutes to get something up, but then I spent another 3 hours tweaking the font, colors, sizes, all that stuff.</p>
<p><a href="http://www.erikbern.com/tsne/artists.pdf">Here</a> is the result, and I'm pretty happy with it. Check it out, and zoom in/out and scroll around. Here's some random screen shots:<figure id="attachment_286" style="width: 576px;" class="wp-caption alignnone"></p>
<p><img src="https://erikbern.com/assets/2013/08/overview.png" alt="image"><em>High-level overview</em></p>
<p>Zooming in reveals a lot of distinct clusters, mainly by genre but there's also big islands of Swedish/Dutch/Spanish artists. Here's a close up of the hip hop cluster:<figure id="attachment_287" style="width: 603px;" class="wp-caption alignnone"></p>
<p><img src="https://erikbern.com/assets/2013/08/hiphop.png" alt="image"><em>Hip hop cluster</em></p>
<p>Anyway, cool thing #2: I took the entire PDF to FedEx downstairs and had them print it on a 24” x 24” poster. Win!<figure id="attachment_291" style="width: 400px;" class="wp-caption alignnone"></p>
<p><img src="https://erikbern.com/assets/2013/08/poster.png" alt="image"><em>Printed poster</em></p>
<p>Btw, I also had to include the view from my room at the 34th floor #humblebrag</p>
<p>And since you're asking, I generate the colors by a separate t-SNE embedding. What I do is I run two separate 2D embeddings, one to get the coordinates, and one to get the colors. The “color coordinates” are then mapped to coordinates in the <a href="http://en.wikipedia.org/wiki/HSL_and_HSV">HSV space</a> which is then <a href="http://docs.python.org/2/library/colorsys.html">transformed to RGB</a>.</p>
Delivering Music Recommendations2013-08-09T00:00:00Zhttps://erikbern.com/2013/08/09/delivering-music-recommendations.html<p>I've turned into a lazy bastard and I'm just posting presentations on this blog, but here's one from <a href="http://rohanradio.com">Rohan Singh</a> at Spotify talking about the backend infrastructure of the <a href="http://play.spotify.com/discover">Discover</a> page.</p>
ML+Hadoop at NYC Predictive Analytics2013-08-03T00:00:00Zhttps://erikbern.com/2013/08/03/mlhadoop-at-nyc-predictive-analytics.html<p>I was just at the <a href="http://www.meetup.com/NYC-Predictive-Analytics/events/129778152/">NYC Predictive Analytics meetup</a> talking about how we build machine learning algorithms using Hadoop to power music recommendations.</p>
<p>Great meetup, where we had two speakers, me and <a href="http://www.metablake.com">Blake Shaw</a> from Foursquare. Blake talked about how they use machine learning at Foursquare, using Hadoop (and Luigi), and he uploaded his slides <a href="https://www.dropbox.com/s/tn4f81is4p1a5ds/HadoopML.pdf">here</a>!</p>
<p>Here's the full video for the talk (both mine and Blake's)</p>
HubSpot's Picture Shows how to Maintain Monocultures in the 21st Century2013-07-28T00:00:00Zhttps://erikbern.com/2013/07/28/hubspots-creepy-picture-shows-how-to-maintain-monocultures-in-the-21st-century.html<p>I thought <a href="http://www.businessinsider.com/hubspot-slidedeck-on-company-culture-2013-3">this article</a> about the company culture at HubSpot is kind of funny. “HubSpot's Awesome Presentation Shows how to Create a 21st Century Culture”.</p>
<p><img src="https://erikbern.com/assets/2013/07/Screen-Shot-2013-07-28-at-1.40.44-PM.png" alt="image"></p>
<p>Just FYI: You're not different. You're a bunch of white hipsters aged 25-30 dressed up in the same theme. That's not being different.</p>
<p>On a more serious note, this represents one of the most challenging aspects of scaling a company culture. You start with a bunch of friends with the same background. Nothing strange about this – friends hire friends. The fact that people have friends that are similar to them isn't great, but it reflects society. Spotify started off as a bunch of like-minded mostly male Swedish university dropouts, for instance. Anyway, at some point, you need to start hiring different people to avoid groupthink and to get access to a much bigger talent pool. Not saying it's easy.</p>
More Luigi: Presentation from OSCON2013-07-27T00:00:00Zhttps://erikbern.com/2013/07/27/more-luigi-presentation-from-oscon.html<p>I was in Portland, OR for a few days hanging out at <a href="https://www.oscon.com">OSCON</a>. Was fun. I also talked a bit about <a href="https://github.com/spotify/luigi">Luigi</a>:</p>
<p>Next week I'm presenting at the <a href="http://www.meetup.com/NYC-Predictive-Analytics/events/129778152/">NYC Predictive Analytics meetup</a> together with Blake Shaw from Foursquare. The topic is ML + Hadoop. Will be fun!</p>
Optimizing over multinomial distributions2013-07-24T00:00:00Zhttps://erikbern.com/2013/07/24/normalizing-multinomial-distributions.html<p>Sometimes you have to maximize some function $$ f(w_1, w_2, ldots, w_n) $$ where $$ w_1 + w_2 + ldots + w_n = 1 $$ and $$ 0 le w_i le 1 $$ . Usually, $$ f $$ is concave and differentiable, so there's one unique global maximum and you can solve it by applying <a href="http://en.wikipedia.org/wiki/Gradient_descent">gradient ascent</a>. The presence of the constraint makes it a little tricky, but we can solve it using the method of <a href="http://en.wikipedia.org/wiki/Lagrange_multiplier">Lagrange multipliers</a>. In particular, since the surface $$ w_1 + w_2 + ldots + w_n $$ has the normal $$ (1, 1, ldots, 1) $$ , the following optimization procedure works:</p>
<ol>
<li>Go one step in the direction of the gradient</li>
<li>Normalize the new point by projecting it orthogonally back onto the surface</li>
</ol>
<p>Note that we can't just normalize by dividing with the sum of the new vector. What we want to do is to project it <em>orthogonally</em> back onto the surface. However, we need to do this without ending up with negative numbers. This turns out to be surprisingly difficult to implement, but let me spare you the agony and present one implementation in Python:</p>
<pre>def project(v):
excess = sum(v) - 1.0
for i, elm in enumerate(sorted(v)):
sub = excess / (len(v) - i)
excess -= min(elm, sub)
return [max(w - sub, 0) for w in v]
</pre><blockquote>
</blockquote>
More Luigi!2013-06-26T00:00:00Zhttps://erikbern.com/2013/06/26/more-luigi.html<p>Continuing in the same spirit of shameless self-promotion, here's some recent <a href="https://github.com/spotify/luigi">Luigi</a> press:</p>
<ul>
<li><a href="http://www.reddit.com/r/Python/comments/1h1won/luigi_is_a_python_module_that_helps_you_build/">Reddit thread</a></li>
<li><a href="https://qconnewyork.com/sites/default/files/QConNY2013_UriLaserson_Python_Hadoop.pdf">A Guide to Python Frameworks for Hadoop</a> (slides from the <a href="http://www.meetup.com/Hadoop-NYC/events/118226212/">NYC Hadoop User Group</a>)</li>
<li>This presentation from the <a href="http://www.meetup.com/Open-Analytics-NYC/">Open Analytics NYC meetup</a> about how Foursquare uses Luigi</li>
</ul>
<p> </p>
<p>Luigi is in the middle of a pretty massive refactoring of the visualizer. David Whiting at Spotify just ripped out the old visualizer (based on Graphviz) and <a href="https://github.com/spotify/luigi/commit/63c07b8ca9f3b1510c7b3b82d0fe91115aa5afe0">replaced it</a> with one based on <a href="http://d3js.org/">D3</a>. Some features were sacrificed, but I'm convinced the new visualizer has a lot more potential to grow into a full fledged monitoring page. There's a ton of new visualization commits sitting in <a href="https://github.com/visualdna/luigi">VisualDNA's repo</a> that I'm really excited to merge back into the main repo soon.</p>
<p>Over and out.</p>
hdfs2cass2013-06-19T00:00:00Zhttps://erikbern.com/2013/06/19/hdfs2cass.html<p>Just open sourced <a href="https://github.com/spotify/hdfs2cass">hdfs2cass</a> which is a Hadoop job (written in Java) to do efficient Cassandra bulkloading. The nice thing is that it queries Cassandra for its topology and uses that to partition the data so that each reducer can upload data directly to a Cassandra node. It also builds SSTables locally etc. Not an expert at Cassandra so I'll stop describing those parts before I embarrass myself.</p>
<p>The way we use it, Cassandra almost becomes some kind of a CDN. All we want to do is to push out large amounts of semi-static data, with no random writes at all. Cassandra is pretty good at high write loads so it's a pretty good fit for the job.</p>
<p>Anyway, the reason why I think this is cool is that all of our previous bulk loading tool has had a single-machine bottleneck. Suddenly we can do many-to-many bulk loading. This means we now have a solution that <em>scales horizontally</em>. This starts to matter when you transfer lots of data. In contrast, for smaller files (< 50GB), we typically scp or even torrent files. This is pretty fast, but you are still constrained by the pipe of the source machine.</p>
<p>Another thing I like is that shows how Hadoop (I'm talking mapreduce now) is great at sharding up things, dealing with failures, retries, etc. It's awesome to rely on that framework when you are pushing a terabyte and you expect some fraction of failed reduce tasks.</p>
NoDoc2013-06-16T00:00:00Zhttps://erikbern.com/2013/06/16/nodoc.html<p>We had an <a href="http://en.wikipedia.org/wiki/Unconference">unconference</a> at <a href="http://spotify.com/">Spotify</a> last Thursday and I added a semi-trolling semi-serious topic about abolishing documentation. Or <em>NoDoc</em>, as I'm going to call this movement. This was meant to be mostly a thought experiment, but I don't see it as complete madness.</p>
<p>To be clear, I'm not talking about comments in the code here. I think those are great, and you should probably do more than you are already doing. Explaining non-obvious things and edge cases are great things to do. Including a link to a Stack Overflow thread discussing a bug and a workaround – awesome. What I'm referring to and what I want to remove is long introductions about class hierarchy, technical stuff about the code, or maybe even architecture. These can all be put in comments and sometimes even in the symbol names.</p>
<p>Here's my point: Everybody says they like documentation. Nobody writes it. Even if there is, I hardly read it. Everyone feels bad about the lack of documentation. Someone starts a workgroup about it every few months. They come up with guidelines. Then people write more docs in a new formats, put it in some obscure place like a wiki, and the documentation grows outdated a few months later. Looking back, maybe documentation is an investment that has negative net return.</p>
<p>Here's the assumptions</p>
<ul>
<li>Outdated documentation is worse than no documentation</li>
<li>Any documentation outside the repo will get lost and outdated</li>
<li>Talking to people and asking them questions is 100x more efficient than trying to figure something out from documentation</li>
<li>To find people to talk to, look at the git log</li>
<li>Examples are better than API docs</li>
<li>Ideally examples are a part of the unit tests so they are guaranteed to stay up to date</li>
<li>If you need API docs for a method, consider renaming/rewriting/refactoring the method. It should be obvious from the function name and arguments what's going on</li>
<li>In dynamically typed languages, type assertions are the best way to specify expected type</li>
<li>Having a “deployment book” (with detailed instructions on how to put the system in production) should be discouraged. If you need something like that, you haven't fully automated it</li>
<li>What is the audience? If it's just three people, don't waste your time.</li>
</ul>
<p>Obviously documentation is nice. Luigi has a <a href="https://github.com/spotify/luigi">long overview</a> at the GitHub page, for instance. It's about finding a balance, that's why we're discussing this in the first place. I'm arguing that there's no need to feel bad about advocating slightly <em>less</em> documentation overall. For internal projects, unless you are planning to leave, you probably don't need to exaggerate. And it's probably a good idea not to encourage documenting manual steps you need to deploy something.</p>
Wikiphilia2013-06-02T00:00:00Zhttps://erikbern.com/2013/06/02/wikiphilia.html<p>I've been obsessed with Wikipedia for the past ten years. Occasionally I find some good articles worth sharing and that's why I created the <a href="http://twitter.com/wikiphilia">wikiphilia</a> Twitter handle. Just a long stream of stuff that for one reason or another may be interesting.</p>
<p>It's also a bunch of friends posting links. Anyway, the tragedy is that there's 800 tweets but only 70 followers, so you should follow it now.</p>
<p>On a related note, <a href="http://en.wikipedia.org/w/index.php?title=Regulate_(song)&oldid=385860234">this version of Wikipedia article for Warren G's Regulate</a> was hilarious until someone removed it in 2010.</p>
Spotify's Discovery page2013-05-31T00:00:00Zhttps://erikbern.com/2013/05/31/spotifys-discovery-page.html<p>The Discovery page, the new start page in Spotify, is finally out to a fairly significant percentage of all users. Really happy since we have worked on it for the past six months. Here's a screen shot:</p>
<p><img src="https://erikbern.com/assets/2013/05/discovery.png" alt="image"></p>
<p>Some cool features</p>
<ul>
<li>Artist/album/track recommendations based on stuff you've listened to before</li>
<li>New releases recommendations</li>
<li>Concert recommendations</li>
<li>Third party news stories</li>
</ul>
<p>There's a ton of reviews out there: <a href="http://howto.cnet.com/8301-11310_39-57586690-285/getting-started-with-spotify-discover/">cnet</a>, <a href="http://mashable.com/2013/05/29/spotify-discover-now-available-to-everyone/">mashable</a>. Some super positive, some kind of negative. Here's a super positive one that I'm mainly pointing out because I'm obviously biased:<a href="http://www.pcworld.com/article/2040066/awesome-new-discover-feed-adds-personalized-music-recommendations-to-spotify.html"> Awesome new Discover feed adds personalized music recommendations to Spotify</a>.</p>
<p>How does it work? A ton of matrix factorization algorithms powers the collaborative filtering part, then a bunch of Hadoop jobs to generate recommendations. Looking forward to talk more about this in detail at some point! Meanwhile, the Discover page will definitely improve over time as we keep tweaking algorithms and content.</p>
<p> </p>
<p> </p>
Fermat's principle2013-05-21T00:00:00Zhttps://erikbern.com/2013/05/21/fermats-principle.html<p>I was browsing around on the Internet and the physics geek in me started reading about <a href="http://en.wikipedia.org/wiki/Fermat's_principle">Fermat's principle</a>. And suddenly something came back to me that I've been trying to suppress for many years – how I never understood why there's anything fundamental about the <strong>principal of least time.</strong></p>
<p>The principle of least time states that the light will travel from A to B in such a way that <em>the time is minimized.</em> Using this principle you can derive a whole bunch of optics laws. But to me that doesn't make any sense.</p>
<p>Reading a dozen articles online about it, they all seem to do the following thing</p>
<ol>
<li>Fermat's principle works for reflections</li>
<li>So let's solve it for the case when light enters another medium</li>
<li>Yay we just derived <a href="http://en.wikipedia.org/wiki/Snell%27s_law#Derivations_and_formula">Snell's law</a>!</li>
</ol>
<p>Problem is that they never derived Fermat's principle for anything else than reflection. And it hardly works for reflections: why doesn't the beam just travel straight from A to B without reflecting in the mirror.</p>
<p><img src="https://erikbern.com/assets/fermats-principle/mountain-reflected.jpeg" alt="image"></p>
<p>I suspect that Snell's law in itself actually “proves” the principle of least time, but that's the way causation works, not the other way around. Of course there's absolutely no way nature can “know” what path is the shortest. Fermat's principle <em>is true</em>, but the derivation in Wikipedia seems like bogus to me.</p>
<p><img src="https://erikbern.com/assets/fermats-principle/refraction-reflection.png" alt="image"></p>
<p>The main problem with just saying that the nature “chooses” the shortest path, is that the light never travelled along all possible paths in the first place. Consider a laser beam fired from some point into glass: it obviously already has an angle. You can take any two points on the incoming and the outgoing beam and verify that Fermat's principle is true, but that seems like the result of Snell's law. Causation is tricky sometimes.</p>
<p><img src="https://erikbern.com/assets/fermats-principle/snells-law.gif" alt="image"></p>
<p>Consider the same laser beam fired from air into glass at a tilted angle. <em>The light only goes in one direction in the first place</em> so you can't talk about constructive inference until the beam actually hits the surface. At that point, Wikipedia mentions that Snell's law can be derived using the <a href="http://en.wikipedia.org/wiki/Huygens%27_principle">Huygens-Fresnel principle</a>, which seems totally legit to me.</p>
<p><img src="https://erikbern.com/assets/fermats-principle/huygens-fresnel-principle.png" alt="image"></p>
<p>If I'm not mistaken, Fermat's principle follows from that, but that's the way the causation goes, not the other way around. Unless I'm smoking crack here, this is something most standard physics textbooks probably do not understand.</p>
Snakebite2013-05-07T00:00:00Zhttps://erikbern.com/2013/05/07/snakebite.html<p>Just promoting Spotify stuff here: check out the <a href="https://github.com/spotify/snakebite">Snakebite</a> repo on Github, written by Wouter de Bie. It's a super fast tool to access HDFS over CLI/Python, by accessing the namenode directly over sockets/protobuf.</p>
<p>Spotify's developer blog features a <a href="http://labs.spotify.com/2013/05/07/snakebite/">nice blog</a> post outlining what it's useful for. I think this kicks ass and there will definitely be some kind of <a href="https://github.com/spotify/luigi">Luigi</a> integration coming up at some point</p>
<p> </p>
Stuff that bothers me: “100x faster than Hadoop”2013-04-27T00:00:00Zhttps://erikbern.com/2013/04/27/stuff-that-bothers-me-100x-faster-than-hadoop.html<p>The simple way to get featured on big data blog these days seem to be</p>
<ol>
<li>Build something that does 1 thing super well but nothing else</li>
<li>Benchmark it against Hadoop</li>
<li>Publish stats showing that it's 100x faster than Hadoop</li>
<li>$$$</li>
</ol>
<p>Spark claims their <a href="http://spark-project.org/">100x faster than Hadoop</a> and there's a lot of stats showing <a href="http://www.hapyrus.com/blog/posts/behind-amazon-redshift-is-10x-faster-and-cheaper-than-hadoop-hive-slides">Redshift is 10x faster than Hadoop</a>. There's a bunch of papers with <a href="http://database.cs.brown.edu/sigmod09/benchmarks-sigmod09.pdf">similar claims</a>. I spent five minutes Googling “Xx faster than Hadoop” and found a ton of <a href="http://blog.cloudera.com/blog/2012/10/cloudera-impala-real-time-queries-in-apache-hadoop-for-real/">other stats</a>.</p>
<p>(Btw, when people say this, I generally take it to mean that Z is y times faster than Hadoop <em>Mapreduce</em>. Just nitpicking.)</p>
<p>Anyway, these stats bother me a lot because everyone knows that</p>
<ul>
<li>Horizontal scalability comes at a very high price, because things get I/O bound. That's fine, because you can always throw more hardware at the problem.</li>
<li>Flexibility comes at a price, and that's totally fine for most people. Hadoop supports pretty much anything that can be reduced to a series of Mapreduce jobs, which in practice turns out to me most stuff.</li>
<li>Ease of use comes at a price, and that's fine. There's a reason a lot of people choose Python over C++, after all. Ok, writing mapreduce jobs in Java sucks, but there's a lot of nice tools out there to make it simple (subtle product placement: check out <a href="https://github.com/spotify/luigi">Luigi</a>)</li>
</ul>
<p>I think Spark is a really cool piece of technology, so don't get me wrong. I just think it's stupid to compare things between Hadoop and Spark when clearly they are two very different products with different use cases. Just as you wouldn't compare a Tokyo Cabinet to MySQL or whatever. So please never ever say that something is X times faster than Hadoop again.</p>
Presentation about Luigi2013-04-26T00:00:00Zhttps://erikbern.com/2013/04/26/presentation-about-luigi.html<p>I like the editing!</p>
Being data driven2013-04-13T00:00:00Zhttps://erikbern.com/2013/04/13/being-data-driven.html<p>I picked up an issue of <em>Foreign Affairs</em> while flying back to NYC from SFO. It features <a href="http://www.foreignaffairs.com/discussions/interviews/generation-kill">this long interview with U.S. General Stanley McChrystal</a> and I thought it was pretty interesting how striking some of the similarities are between fighting in a war and developing software.</p>
<p>On cycle time and how it's important to learn and integrate quickly:</p>
<p><em>In 2003, in many cases we'd go after someone, we might locate them and capture or kill them, and it would be weeks until we took the intelligence we learned from that and were able to turn it into another operation. Within about two years, we could turn that cycle three times in a night. We could capture someone, gain intelligence from the experience, go after someone else, and do three of those in a row, the second two involving people we didn't even know existed at the beginning of the night.</em></p>
<div>
<em> </em>
</div>Annoy2013-04-12T00:00:00Zhttps://erikbern.com/2013/04/12/annoy.html<p><a href="https://github.com/spotify/annoy">Annoy</a> is a simple package to find approximate nearest neighbors (ANN) that I just put on Github. I'm not trying to compete with existing packages, but Annoy has a couple of features that makes it pretty useful. Most importantly, it uses very little memory and can put everything in a contiguous blob that you can mmap from disk. This way multiple processes can share the same index.</p>
<p>We use it at Spotify to put a couple of million tracks in 40-dimensional space and then query for the most similar tracks. Using floats, 5M * 40 * 4 is already 800MB, so sharing memory across multiple processes makes sense.</p>
<p>I hate when people talk about the “multicore revolution”, but it kind of makes sense here. An interesting side effect of it is that memory capacity doesn't seem to grow as fast as the number of cores. Static file-based mmapped indexes are actually really useful for a wide range of features. We also use <a href="http://fallabs.com/tokyocabinet/">Tokyo Cabinet</a> a lot at Spotify, whenever data is at least a few hundred megs, at which point it does make sense to share the data across processes.</p>
<p> </p>
More Luigi!2013-03-22T00:00:00Zhttps://erikbern.com/2013/03/22/more-luigi-pres.html<p>Elias Freider just talked about Luigi at PyData 2013:</p>
<div style="margin-bottom: 5px;">
The presentation above is much better than one I put together a few weeks ago. In case anyone is interested I'll include it too:
</div>ML at Twitter2013-02-27T00:00:00Zhttps://erikbern.com/2013/02/27/ml-at-twitter.html<p>I recently came across <a href="http://www.umiacs.umd.edu/~jimmylin/publications/Lin_Kolcz_SIGMOD2012.pdf">this paper describing how they do ML at Twitter</a>.</p>
<p>TL;DR Their approach is pretty interesting. Everything is a <a href="http://pig.apache.org/">Pig</a> workflow and then they do everything as <a href="http://pig.apache.org/docs/r0.9.1/udf.html">UDF's</a>.</p>
<p>This approach seems pretty interesting. As long as your data can be expressed as small atomic machine learning functions, I'm sure it works great. But there's so much more than that. All small slicing, transforming etc is so much easier to express in a language like Python. I'm still not really comfortable with Pig as a language to power these data flows.</p>
<p>John Cook wrote about <a href="http://www.johndcook.com/blog/2012/10/24/python-for-data-analysis/">math stuff in Python</a> a few months ago: <em>I find doing mathematical programming in a general-purpose language is easier than doing general-purpose programming in a mathematical language.</em> I could not agree more and I want to generalize it further: <em>I rather do domain specific programming in a general-purpose language than the other way around.</em></p>
<p>Pig definitely comes with a set of cool features. It handles joining automatically (not a trivial task), gives you trivial ways to transform your data, and does the query planning for you.</p>
<p>It's not a full fledged workflow management tool though. At Spotify, we use <a href="https://github.com/spotify/luigi">Luigi</a> to define the workflows and the dependencies. Luigi gives you a way to write everything in 100% Python, including how different computational tasks are related and what is dependent on what. It comes with Hadoop support, but the abstraction layer is lower than Pig, and you have to implement your mapper and reducer yourself. For skewed joins this could involve some engineering around things that Pig does automatically for you.</p>
<p>I'm quite curious how this works out for Twitter. Do they find that the abstraction makes it easy for them to focus on ML and not care about the execution details? Or does it add complexity because it enforces the ML to be written as UDF primitives? Will try to find out more.</p>
I'm featured in Mashable2013-02-06T00:00:00Zhttps://erikbern.com/2013/02/06/im-featured-in-mashable.html<p><a href="http://mashable.com/2013/02/05/10-awesome-stem-jobs/">This article</a> from today in Mashable describes some of the fun stuff I get to work with:</p>
<p><em><a href="http://www.linkedin.com/profile/view?id=12890189&locale=en_US&trk=tyah" target="_blank">Erik Bernhardsson</a> is technical lead at Spotify, where he helped to build a music recommendation system based on large-scale machine learning algorithms, mainly matrix factorization of big matrices using <a href="http://hadoop.apache.org/" target="_blank">Hadoop</a>. He moved into this role after heading the Business Intelligence team, where he collected, aggregated and made sense of all the data at Spotify, whether that's ad-hoc insights, A/B testing, visualization or ad optimization.</em></p>
<p><em>Bernhardsson's roots at Spotify date back to 2008, when he interned for the company while writing his master's thesis on systems for automatic music recommendations (he was awarded master's thesis of the year by Naturvetarna, and we all know where that led).</em></p>
<div>
</div>Slides from NYC Machine Learning talk2013-01-27T00:00:00Zhttps://erikbern.com/2013/01/27/slides-from-nyc-machine-learning-talk.html<p>Slides from the talk. Slightly edited because (a) some of the slides make little sense taken out of context (b) Slideshare seem to have problem converting some of the stuff.</p>
<div style="margin-bottom: 5px;">
<strong> <a title="Collaborative filtering at Spotify" href="http://www.slideshare.net/erikbern/collaborative-filtering-at-spotify-16182818" target="_blank">Collaborative filtering at Spotify</a> </strong> from <strong><a href="http://www.slideshare.net/erikbern" target="_blank">Erik Bernhardsson</a></strong>
</div>NYC Machine Learning meetup2013-01-22T00:00:00Zhttps://erikbern.com/2013/01/22/nyc-machine-learning-meetup.html<p>From the <a href="http://www.meetup.com/NYC-Machine-Learning/">NYC Machine Learning</a> talk I had last week:</p>
<p>Haven't looked at it yet except briefly. Unfortunately the quality isn't the best.</p>
Momentum and mean reversion might just be volatility bias2013-01-13T00:00:00Zhttps://erikbern.com/2013/01/13/momentum-and-mean-reversion-might-just-be-volatility-bias.html<p>The Economist just published an article called <a href="http://www.economist.com/news/finance-and-economics/21569397-art-picking-mutual-funds-best-worst-and-ugly">The best, the worst and the ugly</a>. By looking at historical performance for mutual funds, they find strong support for momentum and mean reversion. Picking the <em>best</em> or the <em>worst</em> fund over the previous five years gives great returns over the next five years.</p>
<p>I think this is just confusion around what risk reward is. Selecting the worst and best performing mutual funds is basically a way of selecting funds with high volatility. Any risky asset with higher volatility will give a slightly higher return. This is predicted by the <a href="http://en.wikipedia.org/wiki/Capital_asset_pricing_model">Capital asset pricing model</a>, which AFAIK is a reasonable approximation of reality.</p>
<p> </p>
Calculating cosine similarities using dimensionality reduction2012-12-05T00:00:00Zhttps://erikbern.com/2012/12/05/calculating-cosine-similarities-using-dimensionality-reduction.html<p>This was posted on the Twitter Engineering blog a few days ago: <a href="http://engineering.twitter.com/2012/11/dimension-independent-similarity.html">Dimension Independent Similarity Computation (DISCO)</a></p>
<p>I just glanced at the paper, and there's some cool stuff going on from a theoretical perspective. What I'm curious about is why they didn't decide to use dimensionality reduction to solve such a big problem. The benefit of this approach is that it scales much better (linear in input data size) and produces much better results. The drawback is that it's much harder to implement.</p>
<p>Dimensionality reduction is a lot messier to implement, but basically it works like this: You take your matrix $$ M $$ and factor it into matrices $$ A $$ and $$ B $$ so that $$ M = A^TB $$ . Denoting each row as $$ bf{a_u} $$ (user vectors) and $$ bf{b_i} $$ (item vectors), respectively, the idea is that $$ M_{ui} approx bf{a_i}^Tbf{b_i} $$ . Furthermore, cosine between user can be approximated by their low-dimensionality counterpart pretty well.</p>
<p>This is great for two reasons. First of all, you generally use only a handful of dimensions so all you have to deal with now is super trivial calculations. Taking the cosine of two users or items is $$ O(f) $$ where f is a small number denoting the number of dimensions. You can also calculate user-item score by just taking dot products, also in $$ O(f) $$ .</p>
<p>Second of all, forcing everything down onto a few dimensions is a great way to reduce noise. An intuitive way to see this is that in the original matrix, if user A had a lot of items in common with user B and C, but B and C didn't have any items (or very few) in common, we would draw the conclusion that $$ cos(B, C) = 0 $$ . Working in a reduced dimensionality we would probably still assign a pretty high value of similarity between B and C.</p>
<p>Now, you just reduced the problem to a much lower dimensionality and you still need to apply hashing techniques to find similar pairs. But if we can bring it down to something like 10 or 50 dimensions this is <em>much</em> easier to implement. One way to do it is to <a href="http://en.wikipedia.org/wiki/Locality-sensitive_hashing#Random_projection">cut through the space using random hyperplanes and hash by that.</a></p>
<p>Dimensionality reduction (aka matrix factorization) is no easy task in itself. <a href="http://mahout.apache.org/">Mahout</a> provides some tools to do this, but they don't scale super well to the scale that Spotify or Twitter has. Instead, you are probably stuck having to build something from scratch. Be warned my friend, but at least I'd recommend these two papers:</p>
<p><a href="http://www.stat.osu.edu/~dmsl/Das_2007.pdf">Google News Personalization: Scalable Online Collaborative Filtering</a> – describes how to scale PLSA (a factorization method) to large data sets</p>
<p><a href="http://www2.research.att.com/~yifanhu/PUB/cf.pdf">Collaborative Filtering for Implicit Feedback Datasets</a> – describes another factorization algorithm that converges very fast in practice</p>
Tumblr's awesome project names2012-11-18T00:00:00Zhttps://erikbern.com/2012/11/18/tumblrs-awesome-project-names.html<p><img src="https://erikbern.com/assets/2012/11/ad_2_13_7.jpg" alt="image"></p>
<p>Not sure how I managed to miss this, but I'm watching this <a href="http://www.infoq.com/presentations/Concurrency-Tumblr">Tumblr presentation</a> and they talk about their projects named after <a href="http://en.wikipedia.org/wiki/Arrested_Development_(TV_series)">Arrested Development</a> topics: Gob, Parmesan, Buster, <a href="https://github.com/tumblr/jetpants">Jetpants</a>, Oscar, George and Motherboy.</p>
<p>Still, the best software project name is probably still Apple's <a href="http://en.wikipedia.org/wiki/Apple_Inc._litigation#Libel_dispute_with_Carl_Sagan">BHA</a>.</p>
A neat little trick with time decay2012-10-29T00:00:00Zhttps://erikbern.com/2012/10/29/a-neat-little-trick-with-time-decay.html<p>Something that pops up pretty frequently is to implement time decay, especially where you have recursive chains of jobs. For instance, say you want to keep track of a popularity score. You calculate today's output by reading yesterday's output, discounting it by $$ exp(-lambda Delta T) $$ and then adding some hit count for today. Typically you choose $$ lambda $$ so that $$ exp(-lambda Delta T) = 0.95 $$ for a day or something like that. We do this to generate popularity scores for every track at Spotify.</p>
<p>There is another approach that doesn't require you to do the discounting and gives you a bit more flexibility. If you think about it, essentially what you want to calculate is $$ sum exp(-lambda(T - t_i)) $$ where $$ T $$ is the current time and the sum is over all hits since we started keeping track of the popularity. This is a single score that takes time decay into account. You can add new hits by just discounting the existing sum and adding $$ 1 $$ .</p>
<p>The problem is that you have to keep track of the timestamps together with the scores, or else you can't do proper discounting when you add numbers that were calculated at different points in the time. There is a trick to get around this. Notice that the current time only introduces a constant factor $$ exp(-lambda T) $$ so let's just factor it out. You get $$ exp(-lambda T)sum exp(lambda t_i) $$ which means you don't have to keep track of what time it is. You can just apply the discount factor when you need it! In practice this means that you don't have to keep track of any timestamp or anything.</p>
<p>Now, you need to keep track of the following thing instead: $$ S = sum exp(lambda t_i) $$ . This is a ****<em>ridiculously</em> large number, so in principle you need to store the logarithm $$ s = log S $$ of it instead.</p>
<p>But if you store the logarithm of it, how do you add a new term? You basically want to calculate something like $$ log(exp(s) + exp(u)) $$ where $$ u = log U = lambda t_i $$ represents a new term. This isn't possible by the naive method because the intermediate sum will overflow, but it turns out that there is a simple trick to calculate this that makes the computer happy. This identity can be derived by some simple substitution and some logarithm identities: $$ log(exp(s) + exp(u)) = max(s, u) + log (1 + exp(min(s, u) - max(s, u))) $$</p>
<div>
Furthermore, say you want to evaluate the score at some point in $$ T $$ in time later. This is equivalent to $$ Sexp(-lambda T) = exp(s - lambda T) $$ and it can be evaluated without any overflow problems.
</div>Luigi: complex pipelines of tasks in Python2012-10-21T00:00:00Zhttps://erikbern.com/2012/10/21/luigi-build-complex-pipelines-of-tasks.html<p><a href="https://github.com/spotify/luigi"><img src="https://erikbern.com/assets/luigi.png" alt=""></a></p>
<p>I'm shamelessly promoting my first major open source project. Luigi is a Python module that helps you build complex pipelines of batch jobs, handle dependency resolution, and create visualizations to help manage multiple workflows. It also comes with <a href="http://hadoop.apache.org/">Hadoop</a> support built in (because that's where really where its strength becomes clear).</p>
<p>We use Luigi internally at Spotify to run thousands of tasks every day, organized in complex dependency graphs. Luigi provides an infrastructure that powers several Spotify features including recommendations, top lists, A/B test analysis, external reports, internal dashboards, and many more.</p>
<p>Conceptually, Luigi is similar to <a href="http://www.gnu.org/software/make/">GNU Make</a> where you have certain tasks and these tasks in turn may have dependencies on other tasks.</p>
<p>Read more about it on Github: <a href="https://github.com/spotify/luigi">https://github.com/spotify/luigi</a>.</p>