2D embedding of 5k artists = WIN
I’m at KDD in Chicago for a few days. We have a Spotify booth tomorrow, and I wanted to put together some cool graphics to show. I’ve been thinking about doing a 2D embedding of the top artists forever since I read about t-SNE and other papers so this was a perfect opportunity to spend some time on it.
So – I spent a couple of hours taking the lower dimensionality representation of all artists, plugging it into the C++ implementation they provide, then using matplotlib to render something cool. Like all good visualizations, it took me roughly 30 minutes to get something up, but then I spent another 3 hours tweaking the font, colors, sizes, all that stuff.
Here is the result, and I’m pretty happy with it. Check it out, and zoom in/out and scroll around. Here’s some random screen shots:
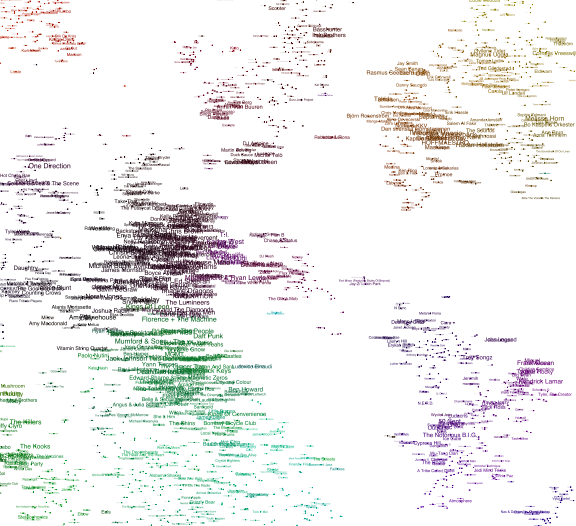 High-level overview
Zooming in reveals a lot of distinct clusters, mainly by genre but there’s also big islands of Swedish/Dutch/Spanish artists. Here’s a close up of the hip hop cluster:
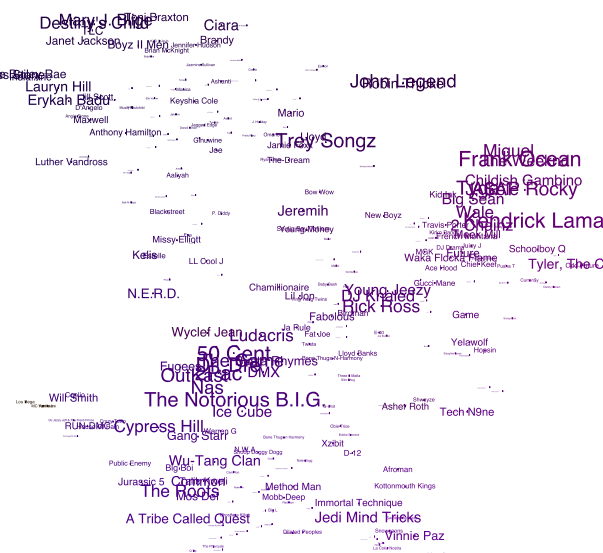 Hip hop cluster
Anyway, cool thing #2: I took the entire PDF to FedEx downstairs and had them print it on a 24” x 24” poster. Win!
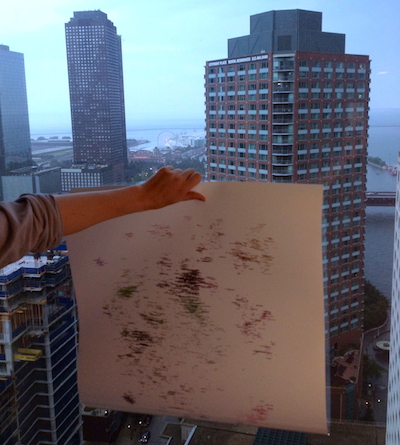 Printed poster
Btw, I also had to include the view from my room at the 34th floor #humblebrag
And since you’re asking, I generate the colors by a separate t-SNE embedding. What I do is I run two separate 2D embeddings, one to get the coordinates, and one to get the colors. The “color coordinates” are then mapped to coordinates in the HSV space which is then transformed to RGB.