Subway waiting math
Why does it suck to wait for things? In a previous post I analyzed a NYC subway dataset and found that at some point, quite early, it’s worth just giving up.
This isn’t a proof that the subway doesn’t run on time – in fact it might actually proves that the subway runs really well. The numbers indicate that it’s not worth waiting after 10 minutes, but it’s a rare event and usually involves something extraordinary like a multi-hour delay. You should roughly give up after some point related to the normal train frequency, and 10 minutes is not a lot at all. Conversely if the trains ran hourly, it probably would had been worth waiting an hour or more. My analysis gave me a lot of respect for the job MTA is doing.
But there’s another effects that greatly impacts waiting time. The variance. It turns out that the the statistics of waiting makes it very sensitive to variance.
How variance destroys your waiting time
Let’s consider this toy model. Let’s say the time between subways is drawn from the set of elements $$ T_1, \ldots, T_n $$. So the average time between subways is just $$ \frac{1}{n} \left( T_1 + T_2 + \ldots + T_n \right) $$.
Now let’s say we arrive at a random point in time. With probability $$ T_j / \left( T_1 + T_2 + \ldots + T_n \right) $$, the next time to the subway is $$ T_j $$ from the previous one. I think of it as the following schematic:
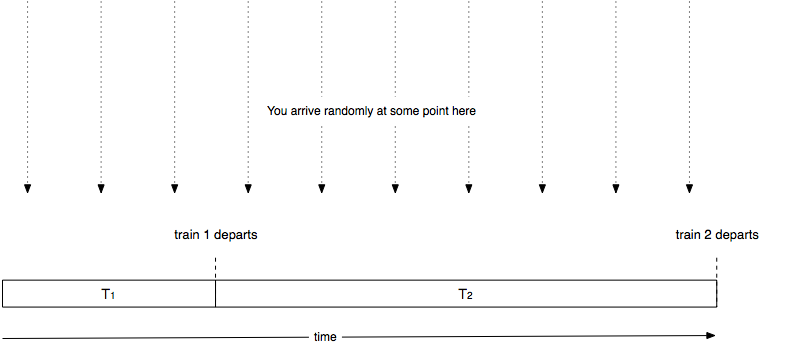
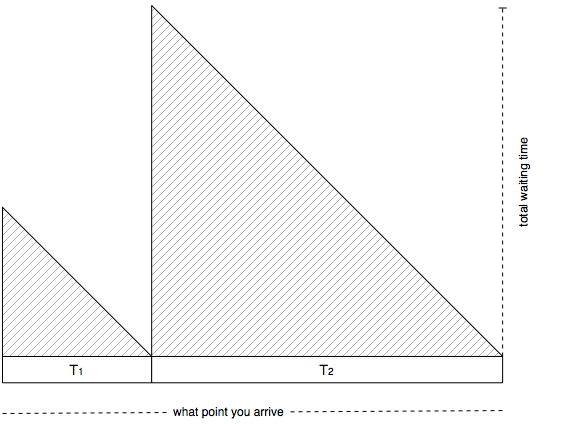
Let’s think about how long you have to wait given that you arrive at some random point in time. If the next train is train $$ j $$ then you end up having to wait some random amount of time distributed uniformly between $$ 0 \ldots T_j $$, the average of which is $$ T_j / 2 $$.
Multiplying the probabilities with the averages, you can see that the average time will be
$$ \frac{1}{2} \frac{T_1^2 + T_2^2 + \ldots + T_n^2}{T_1 + T_2 + \ldots + T_n} $$
It’s basically the average value of the following graph:
Digging into the statistics we can actually rewrite the quantity as:
$$ \frac{1}{2} \frac{E[T^2]}{E[T]} = \frac{1}{2} \frac{E[T]^2 + Var(T)}{E[T]} = \frac{1}{2}E[T] \left(1 + c_v^2\right)$$
Here $$ c_v $$ denotes the relative standard deviation – the standard deviation divided by the average. This makes it a bit more clear what happens. The average waiting time is scales with the variance of time between subway trains. If there is absolutely no dispersion, then all subways arrive by the exact same rate, and the the average waiting time would be exactly half the time between subway trains.
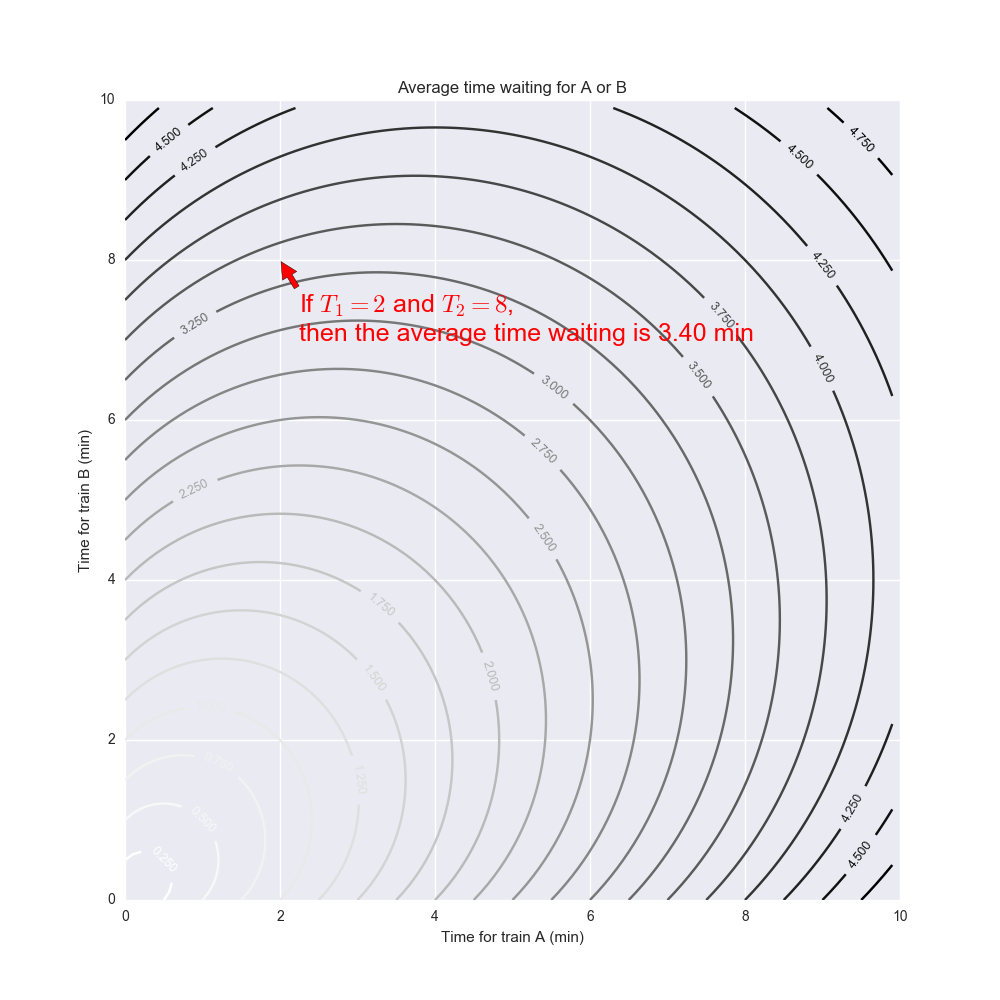
The key thing here is to note that we have squares in the numerator. A single large value of $$ T_j $$ can have an outsized impact on the average time you have waited. For instance if $$ n = 2 $$ then the average waiting time behaves almost as $$ 1 / 2 \max(T_1, T_2) $$:
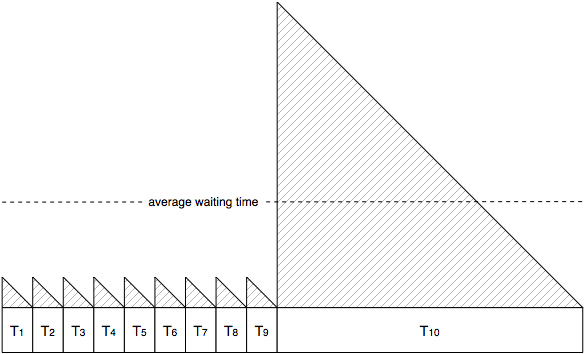
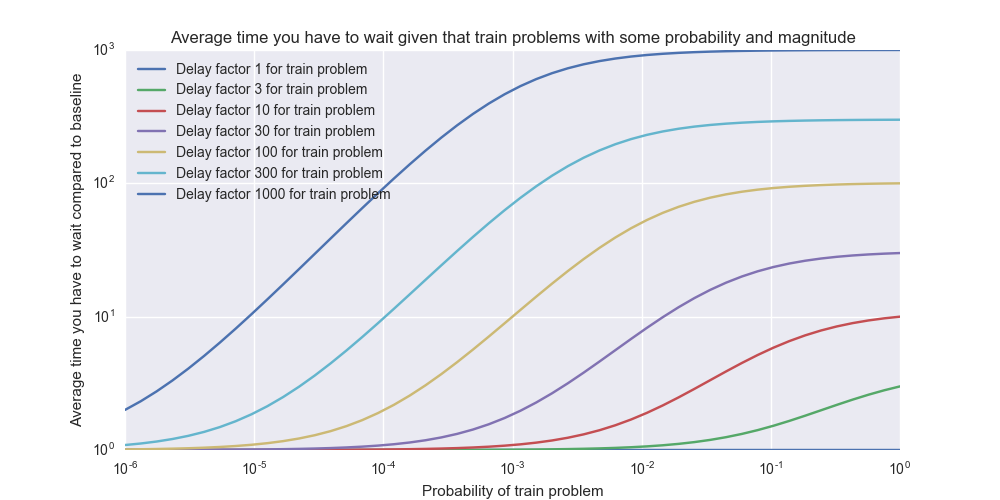
If $$ n = 10 $$ and all $$ T_i = 1 $$ minute then the average waiting time is 30 seconds. But let’s say we have a single $$ T_{10} = 10 $$ minutes – then the average waiting time is 2 minutes 52 seconds. So by adding a single 10x train delay with 10% probability, the average waiting time goes up by a factor of 5.7x! This illustrates how a single bad egg can destroy the average performance of the system and create a kind of “bottleneck” effect.
Even a 1% risk of a 10x delay pushes up the average waiting time by a whopping 1.83x – this is still while running 99% of the trains on time.
These charts above were artificial toy datasets with only two different outcomes, but we can generalize it to any probability distribution.
How much does the variance matter in reality?
I crunched the MTA dataset and ended up with the following numbers:
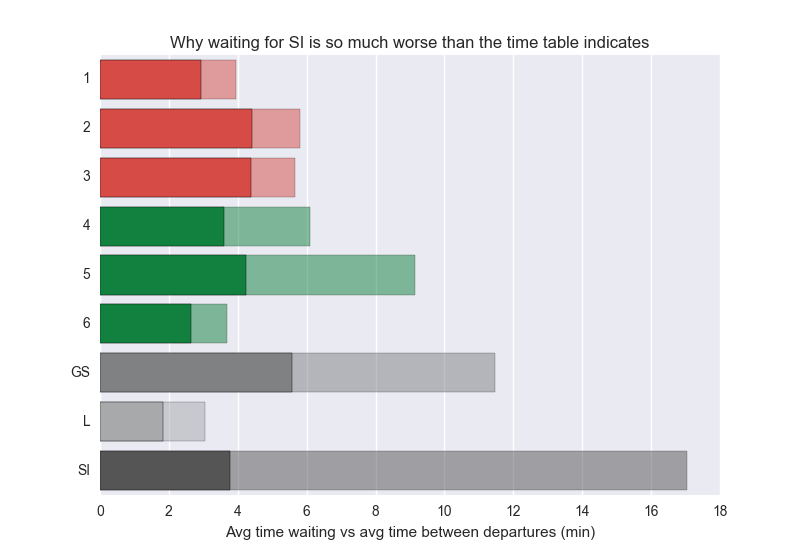
In most cases it makes the average waiting time longer by about 2x – poor Staten Islanders however are experiencing some really bad waiting time caused by the SI’s variance. This data is only during the day. The interesting conclusion here is that average time waiting could be cut in half by just making the subway trains run more evenly. You wouldn’t have to add a single train to the system or drive them faster. Just make sure they are more evenly spaced out.
I was hoping L maybe would exhibit terrible stats here, finally proving the popular belief that L sucks. Unfortunately I’m still not able to see any quantitative evidence supporting this. Does L really deserve its terrible reputation? I’m starting to think it’s really one of the best run subway lines in NYC.
- Note 1: I published an version of this blog post earlier this week but it contained a few errors that have been fixed.
- Note 2: This post contains a bunch of math that isn’t rendered properly in RSS. Sorry about that!