Language pitch
Here’s a fun analysis that I did of the pitch (aka. frequency) of various languages. Certain languages are simply pronounced with lower or higher pitch. Whether this is a feature of the language or more a cultural thing is a good question, but there are some substantial differences between languages.
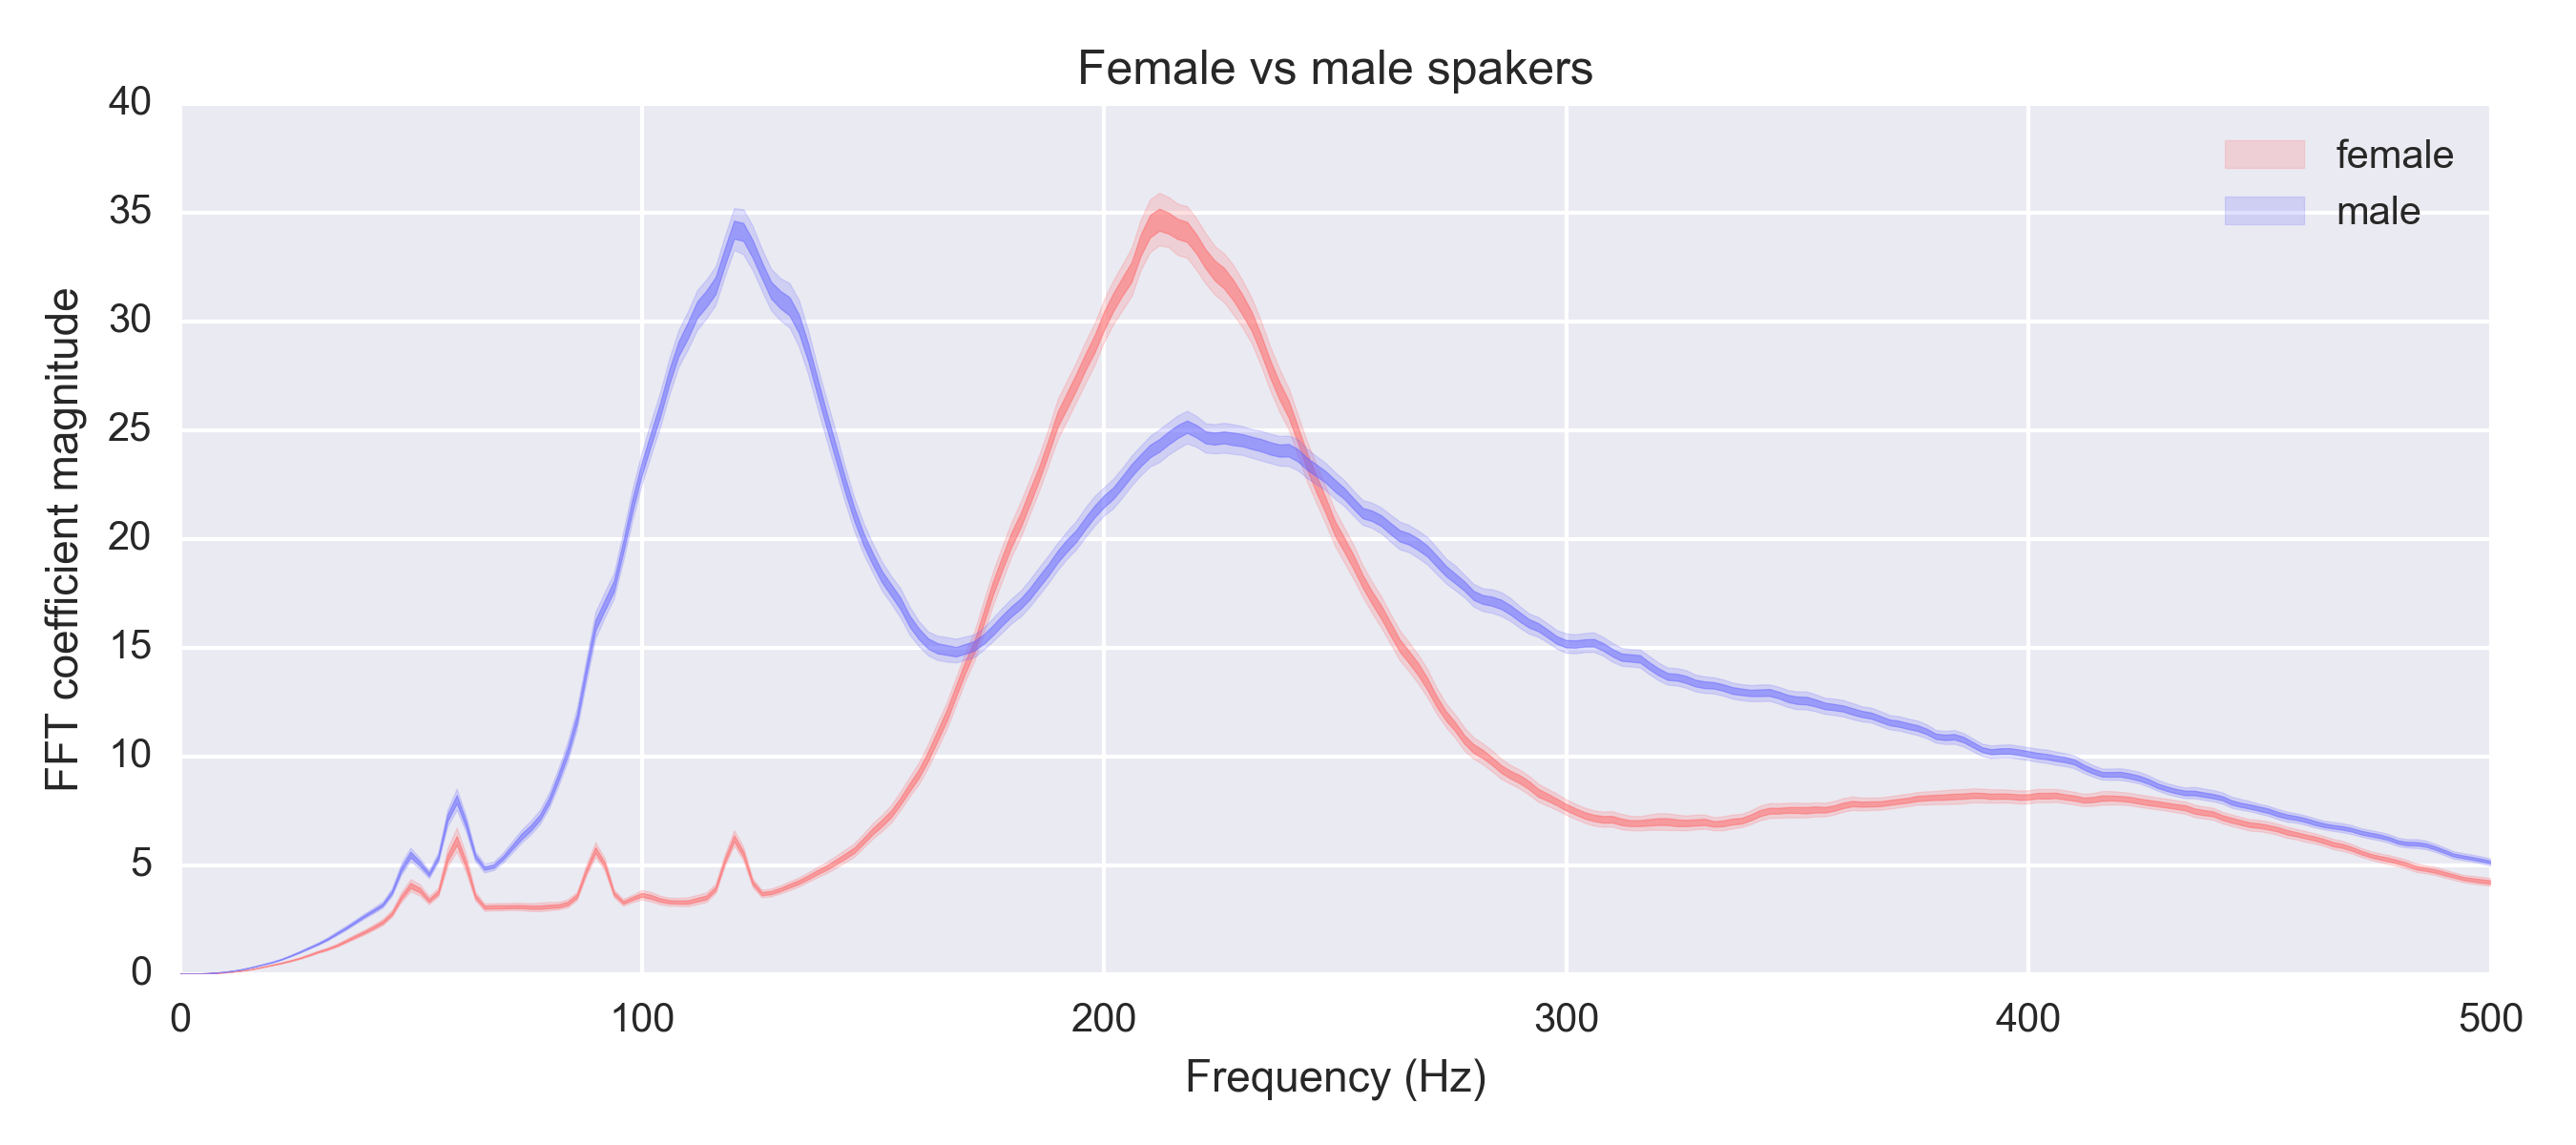
Hertz (or Hz, or $$ s^{-1} $$), is the standard way to measure audio frequency. Typical human speech ranges between 50 Hz and 300 Hz. Most men typically range between 85-180Hz, and most women between 165-255Hz. If we look at a spectrum of audio for English speakers, we get a pretty substantial difference between the genders. This is of course not super surprising to anyone with a pair of ears.
Comparing languages
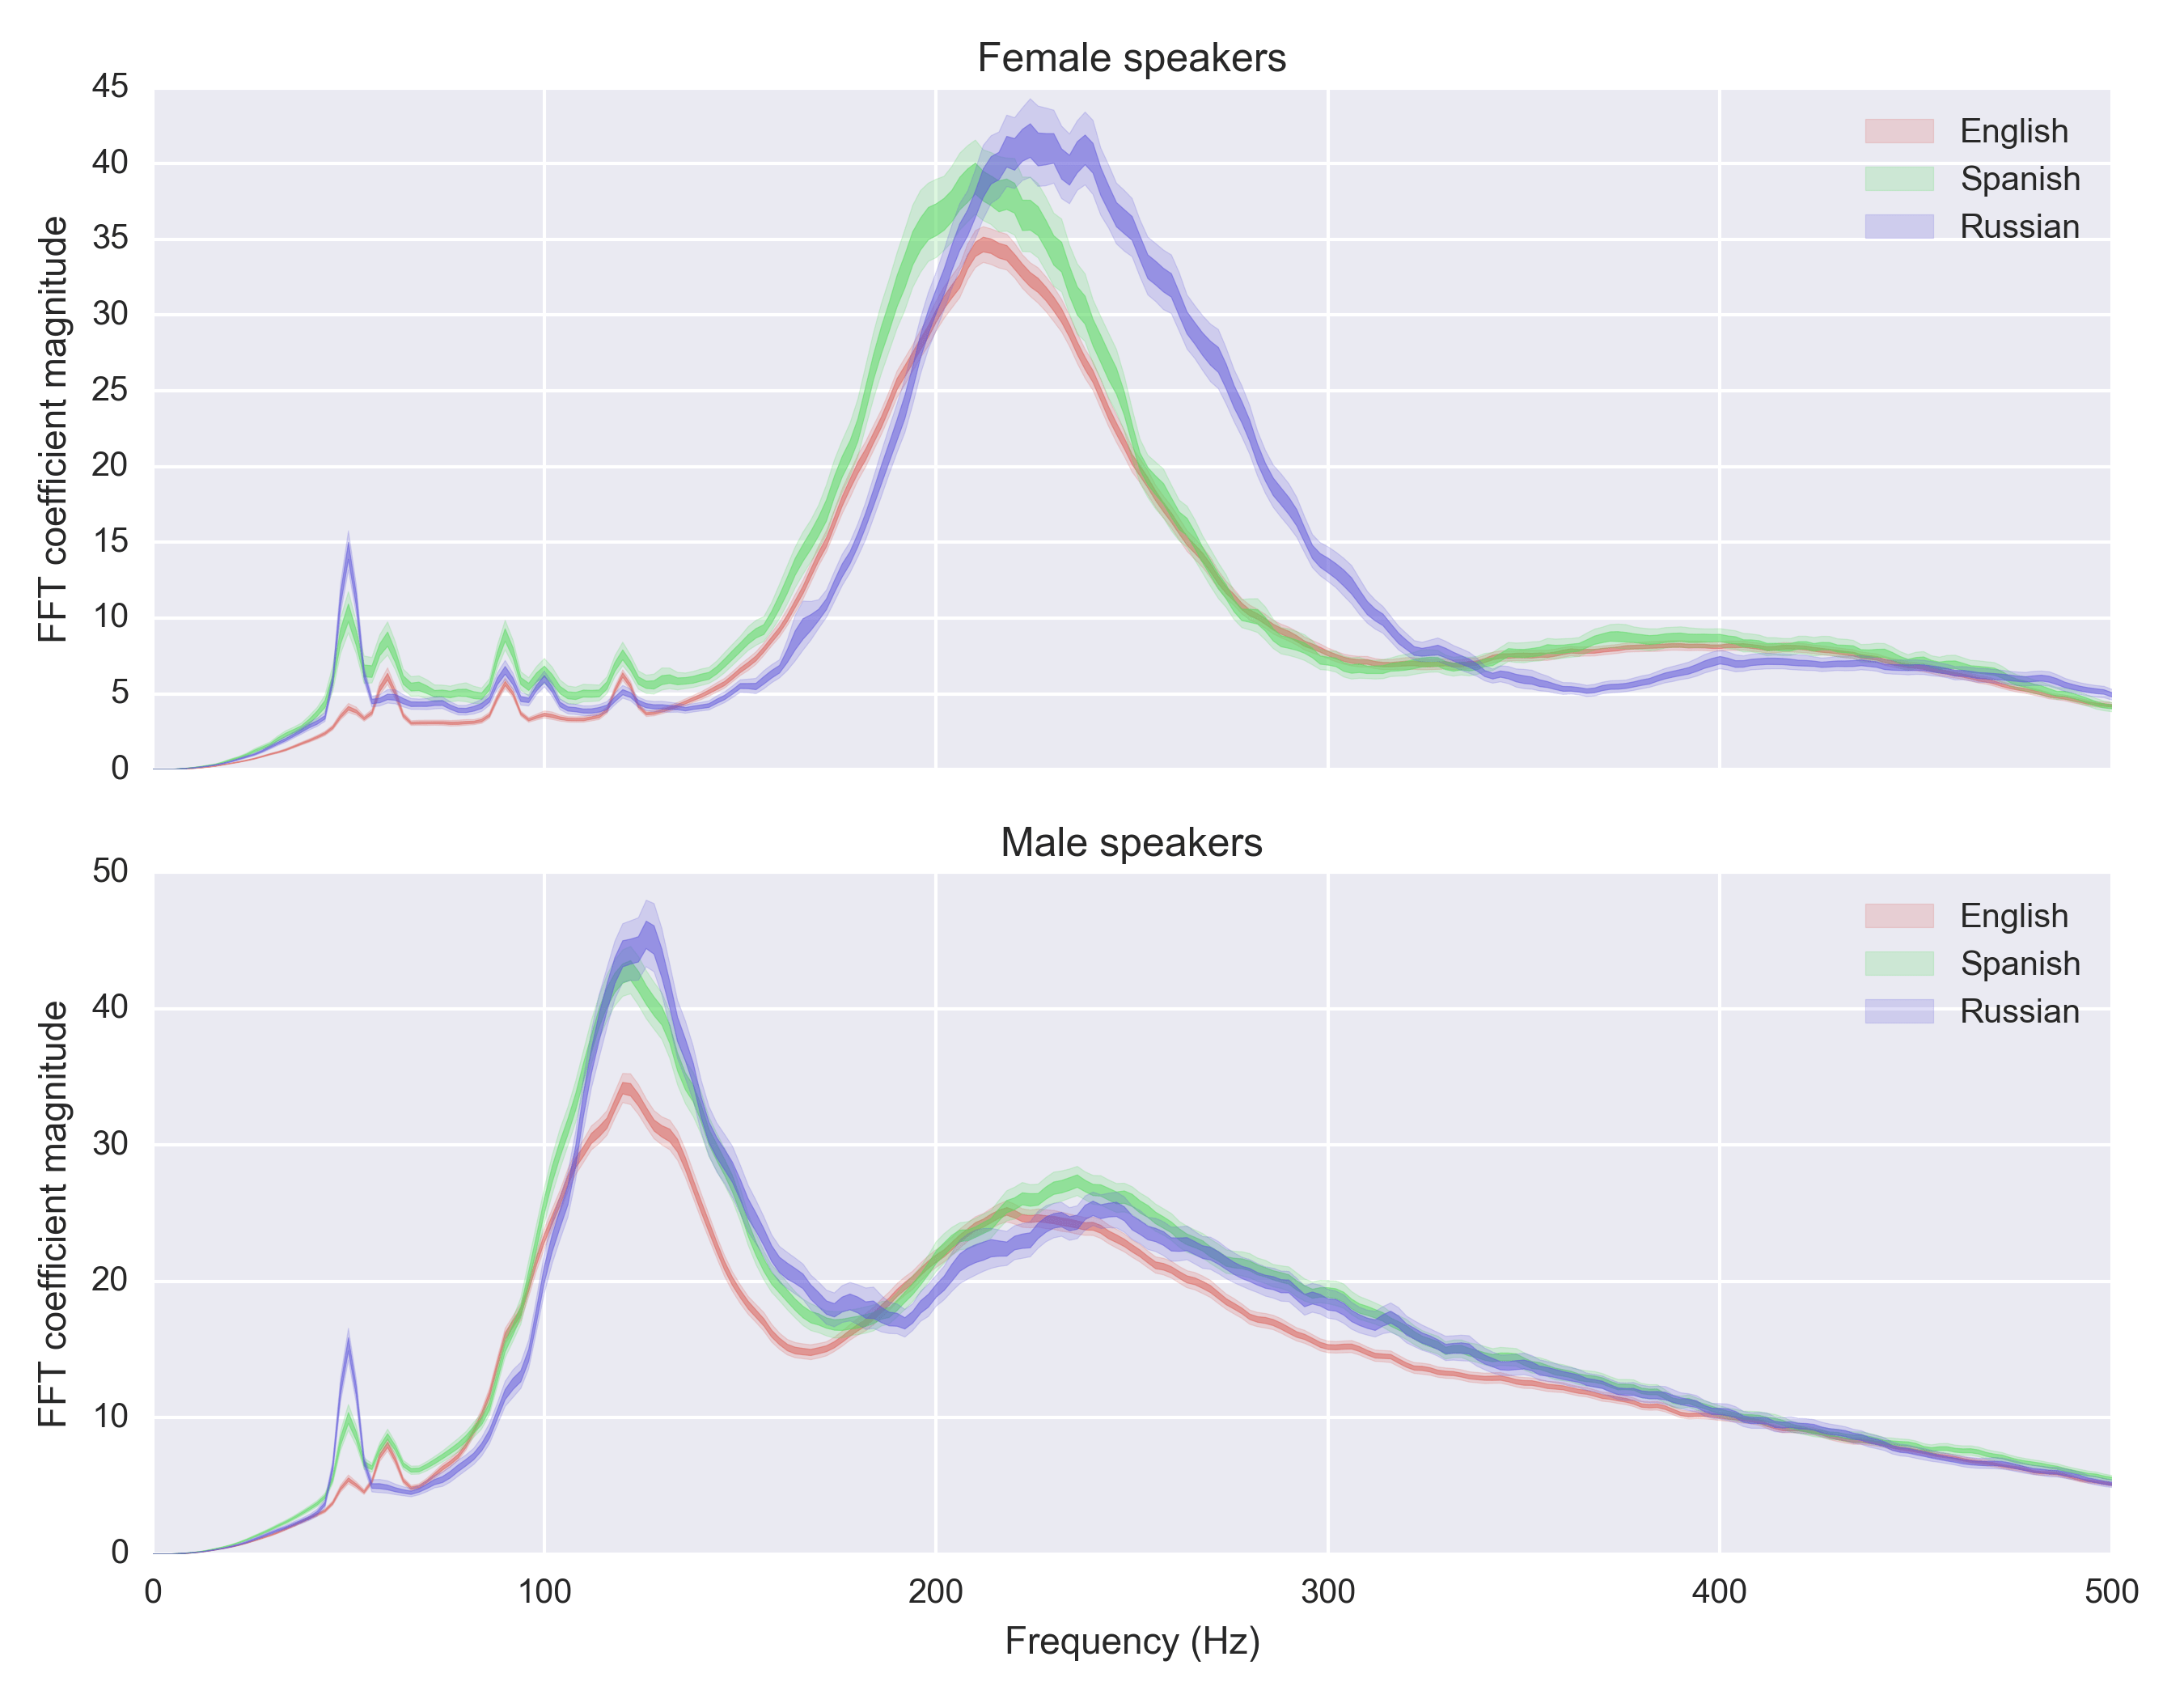
Let’s look at the top three languages in the data set:
Estimating the peak frequency by language lets us compare all languages:
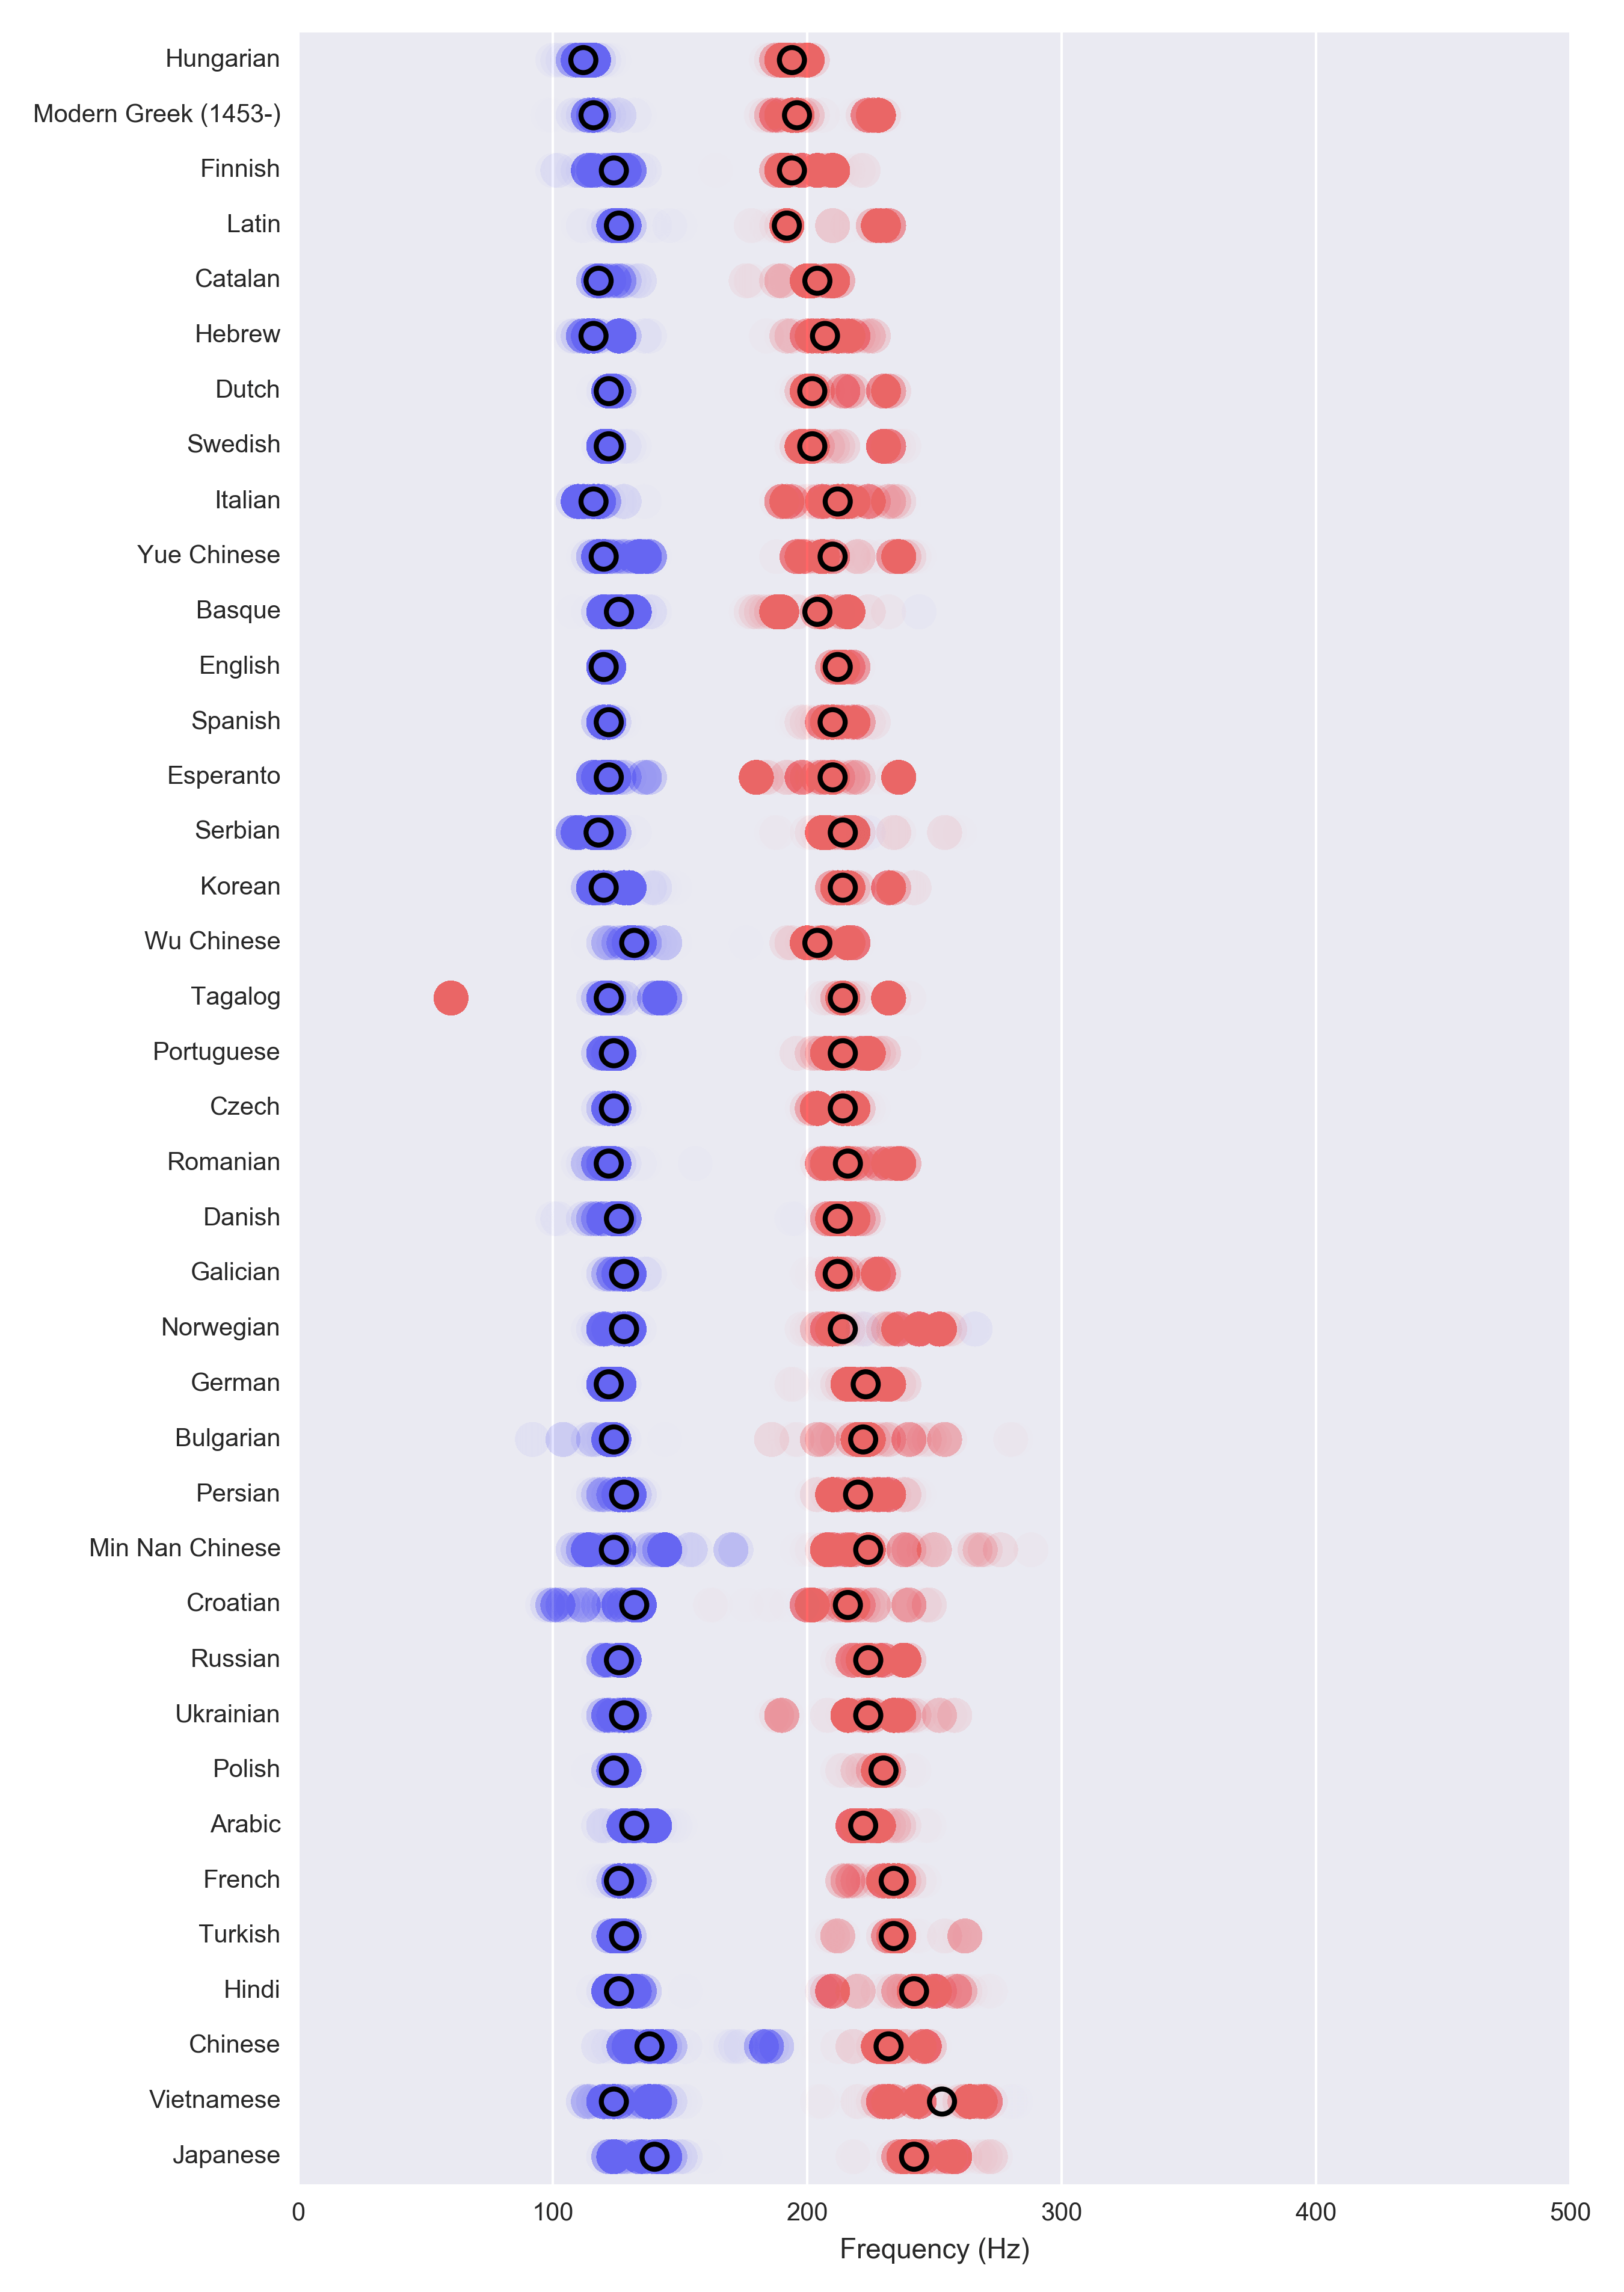
Cool! Basically Hungarian has a very low pitch and Chinese has a very high one. The difference isn’t actually super big, it’s about half an octave on a piano. Still, it’s something that’s very noticeable to a human. Just to give you an idea of how much half an octave is, I altered the pitch of Ronald Reagan’s famous “tear down this wall” speech by $$ 2^{\pm 1 / 4} $$ so that the difference between the two variants is half an octave. (One octave is always the double frequency, so half an octave is $$ 2^{1 / 2} $$ frequency.
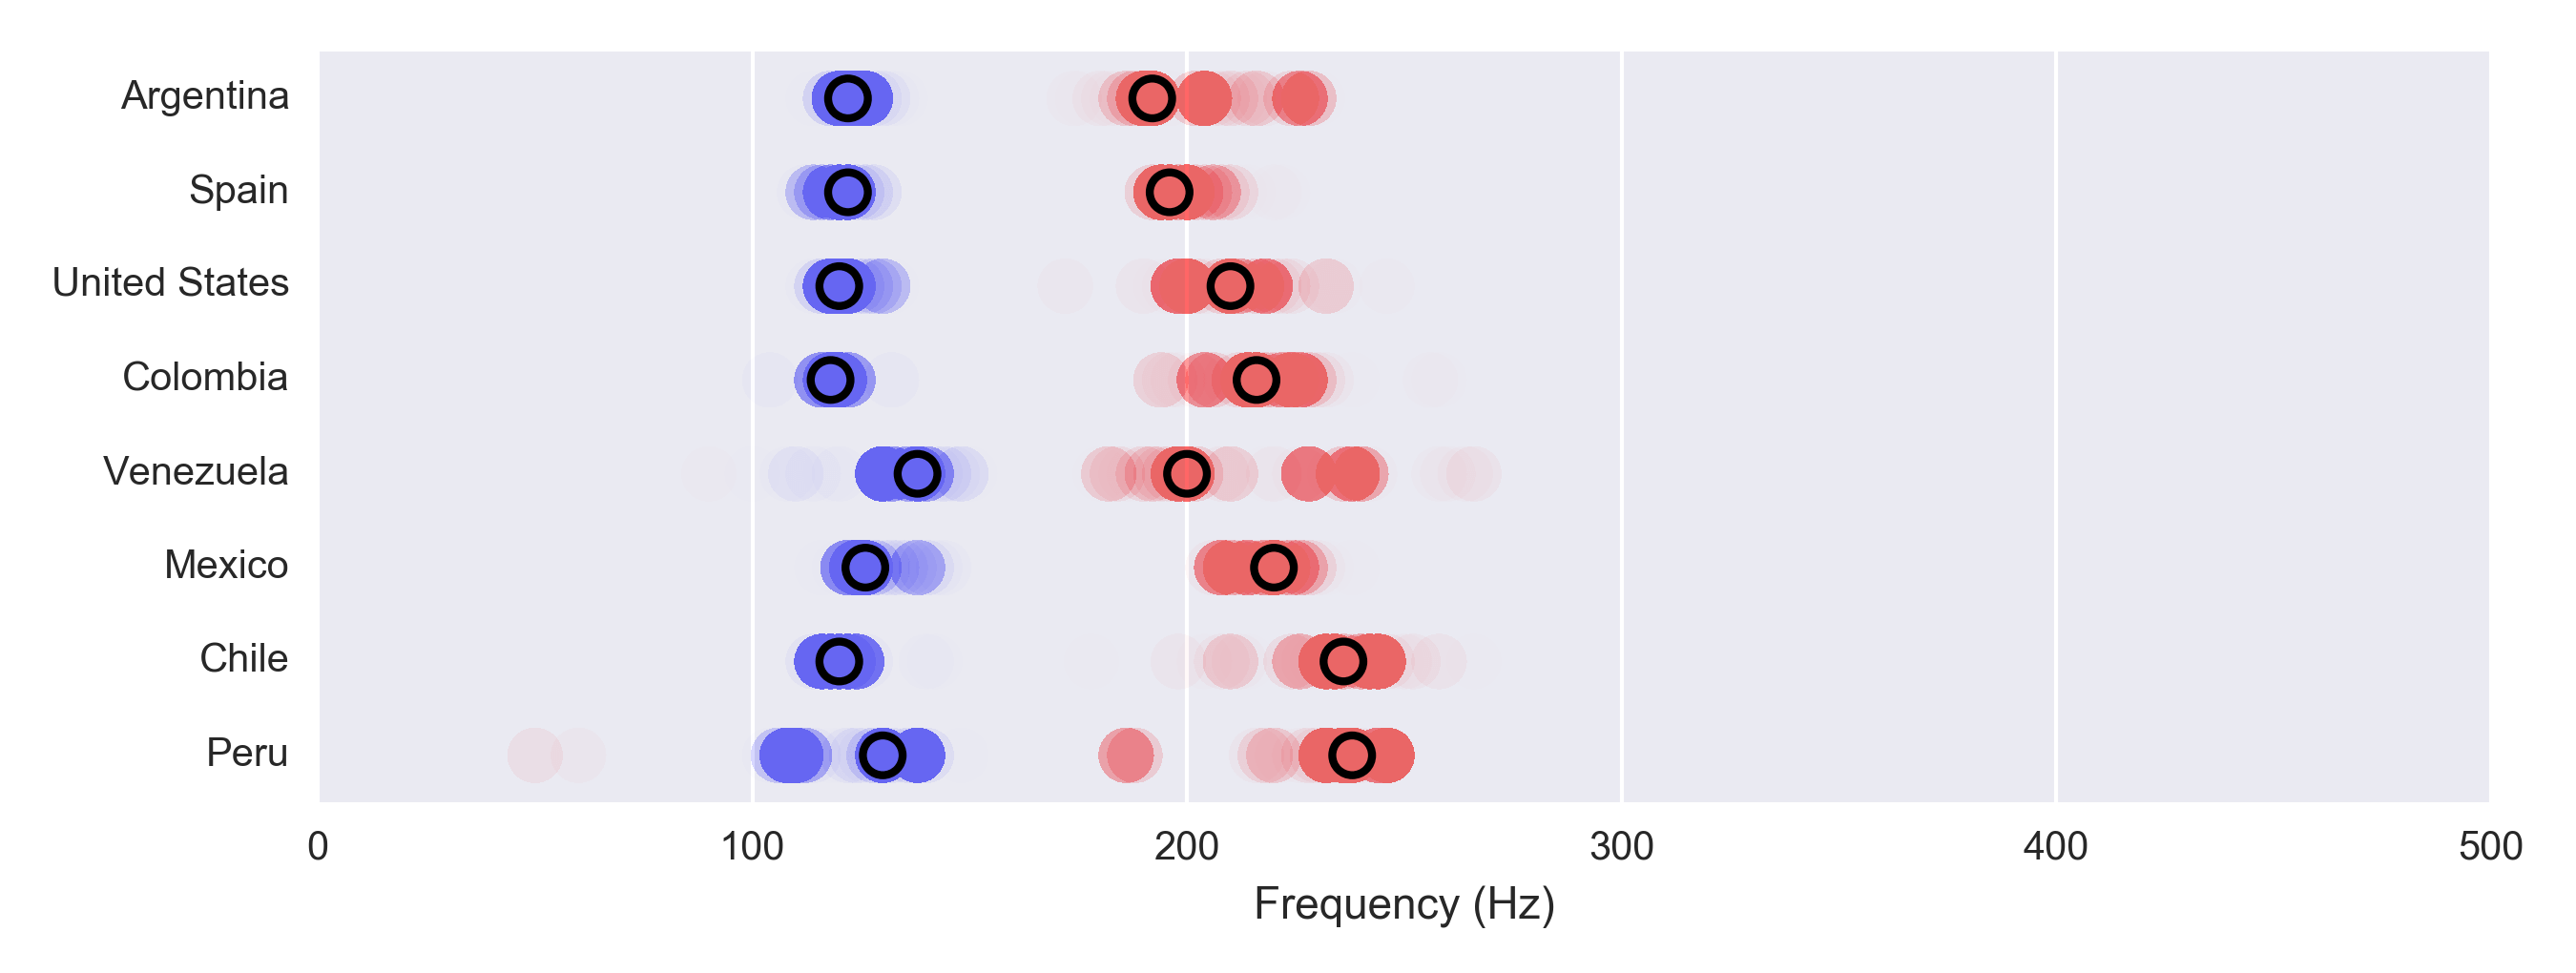
Just to clarify the graph you are seeing above: each circle represents the peak frequency from a bootstrapped aggregate. The dark circles represent the median of those – arguably the most representative frequency. The purpose is to get an idea of the uncertainty in this esimates, and I stole this idea from 538. Note that the individual colored circles do not represent individual speakers – it’s really just various bootstrap estimates of the peak frequency.
Within languages
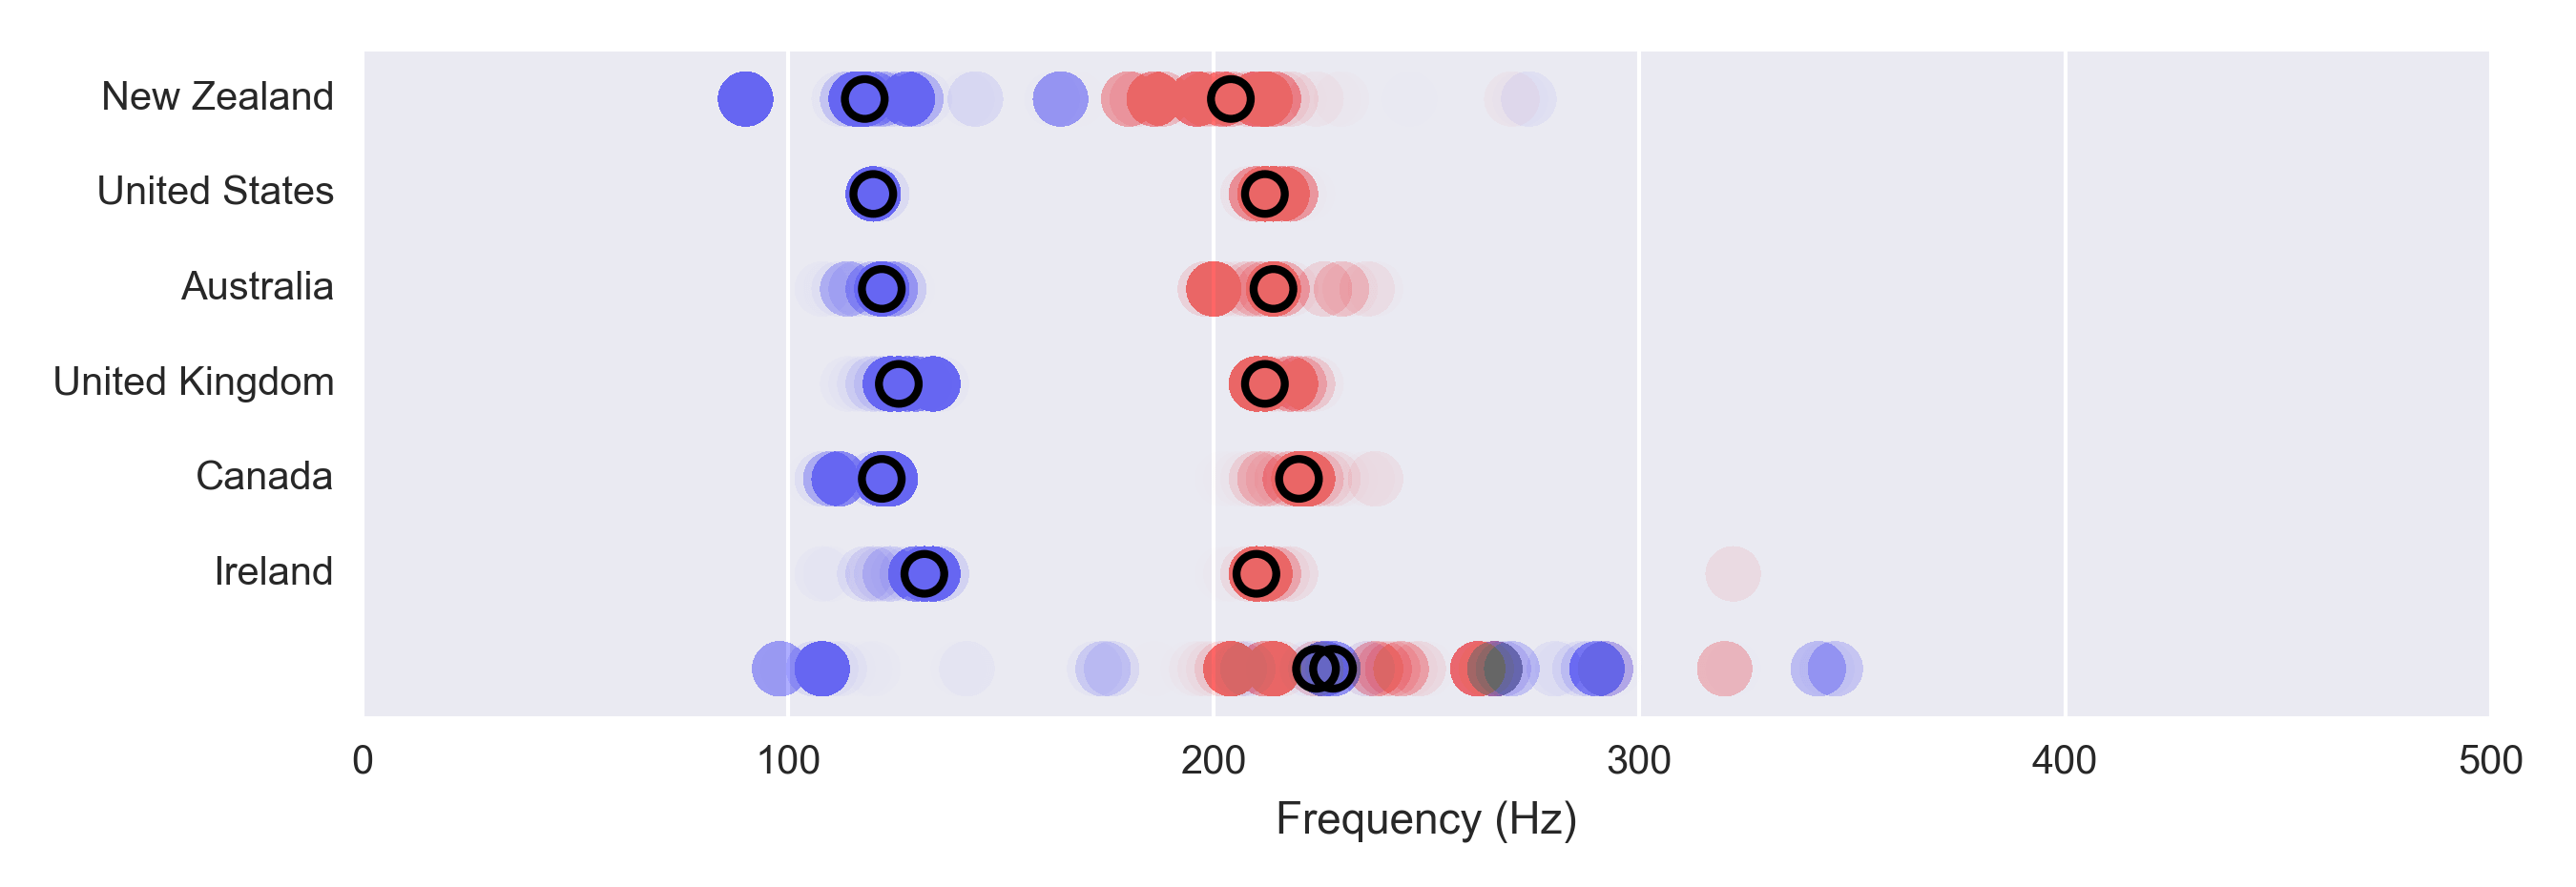
We can also look at the origin of the speaker and see how it differs. For English speakers, it turns out that the difference is quite small:
However Spanish speakers exhibit pretty substantial differences depending on the location, with Spain having a very low pitch (this seems right to me) and Peruvian women the highest (I have no idea whether this confirms any stereotype). Interestingly, the difference is tiny for males and huge for females.
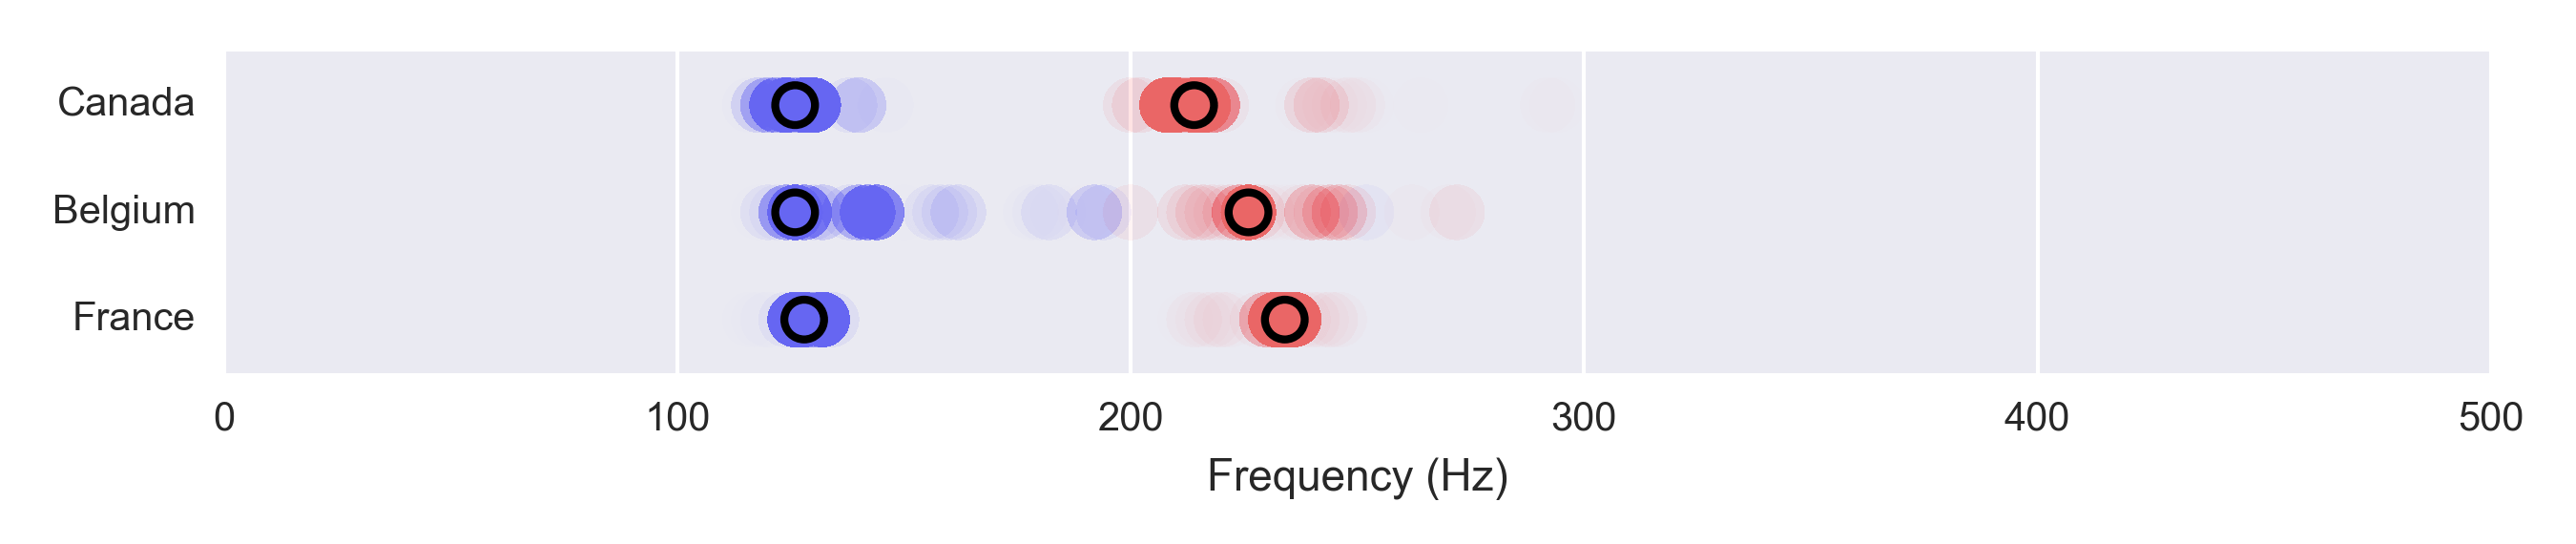
There wasn’t a ton of audio featuring the Francophones unfortunately:
There are some other global languages that would have been interesting to look at – Arabic comes to mind. Unfortunately the data I had was a bit limited, and there just wasn’t enough data to compare those languages across countries.
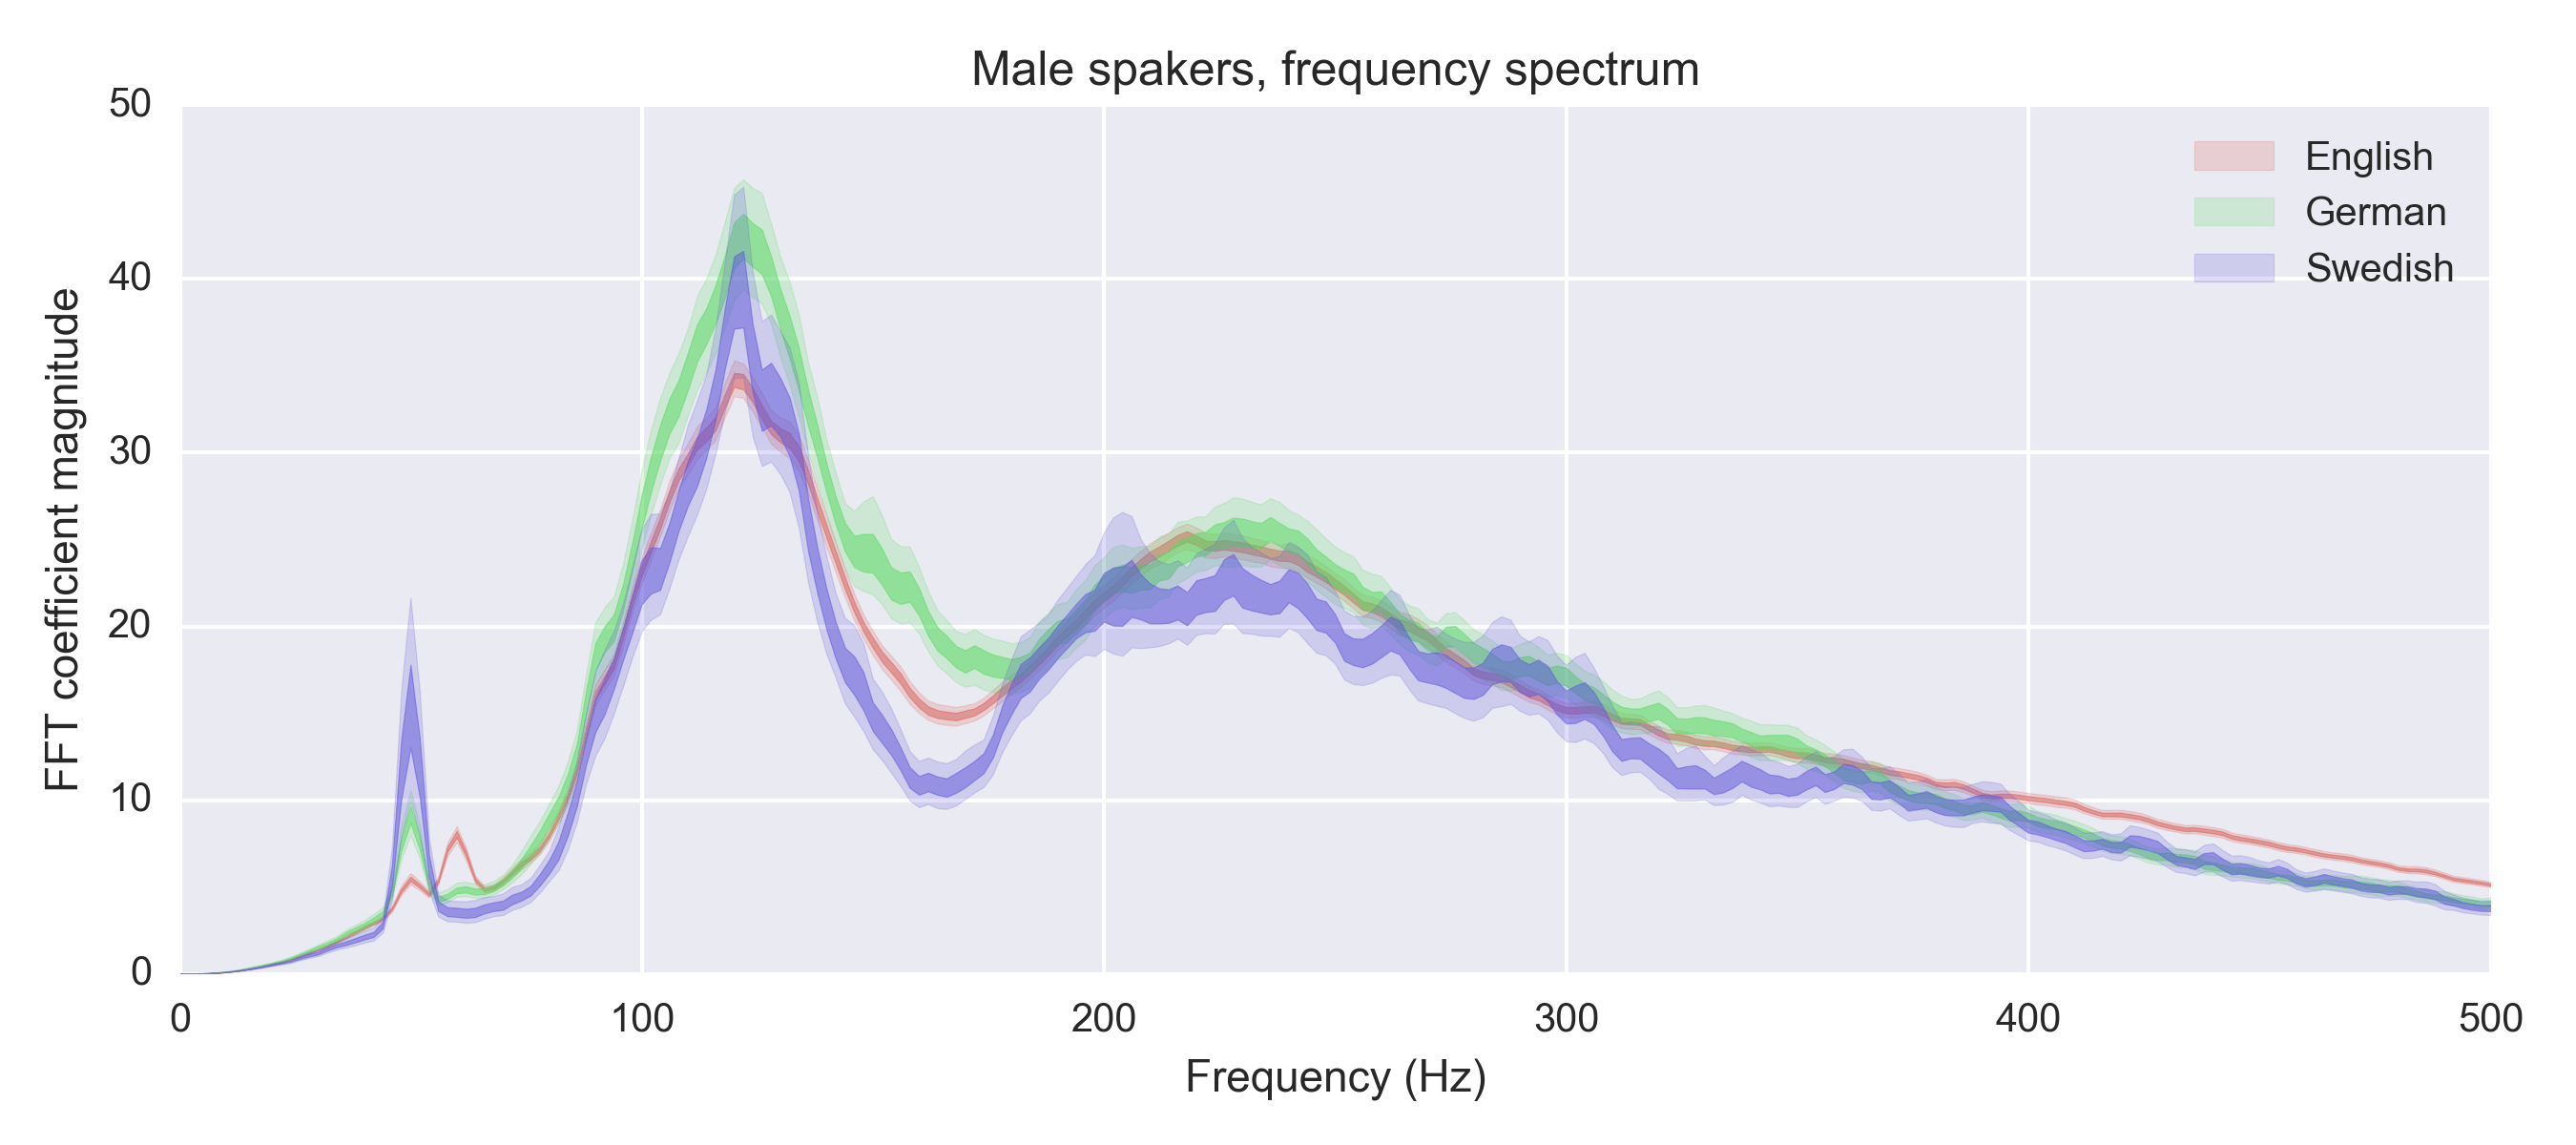
The scandie situation
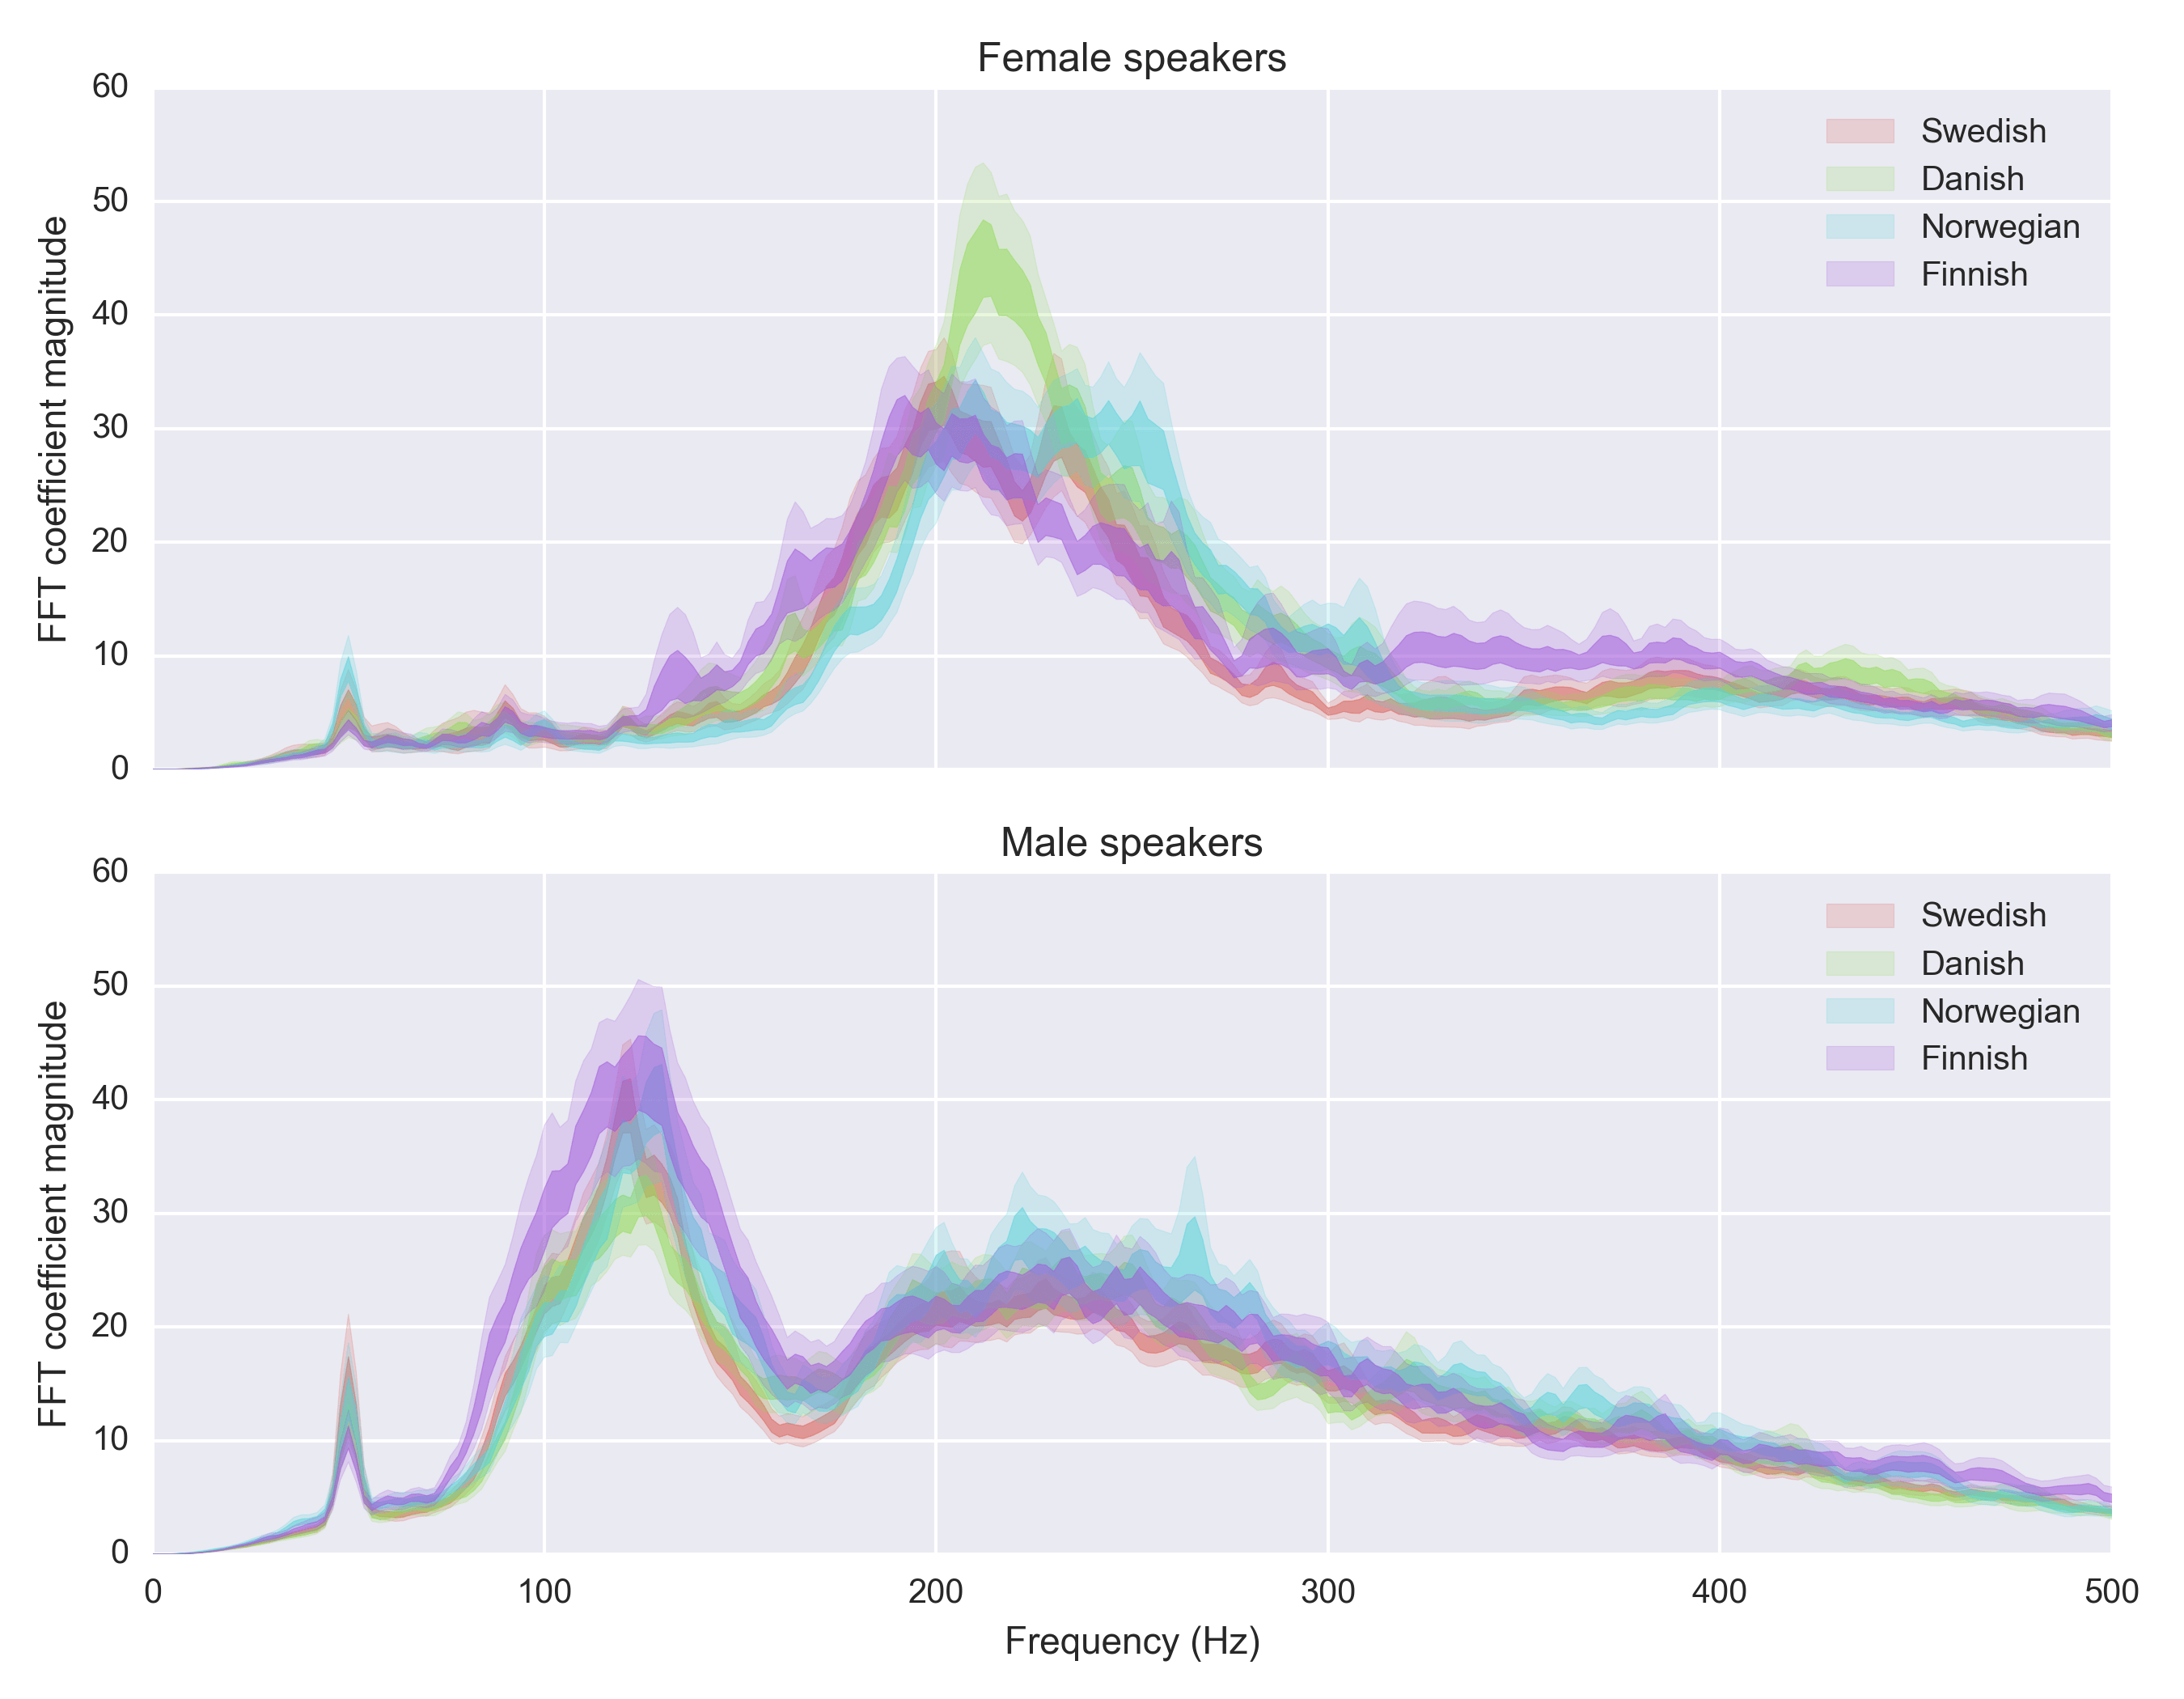
As a “scandie”, I’m not surprised by some of these. Finnish is know for a very low pitch (making fun of F1 driver Mika Häkkinen’s English accent was a staple of Swedish comedy for a couple of years), and Norwegian is known for its high-pitched voice (going up and down, like the mountains). Danish is in the middle (but more notably, has basically degenerated into a series of guttural sounds). Scandinavian languages (I included Finnish in there even though it’s not a Scandinavian language):
Asian pronunciation
Let’s check out Chinese vs Japanese vs Korean:
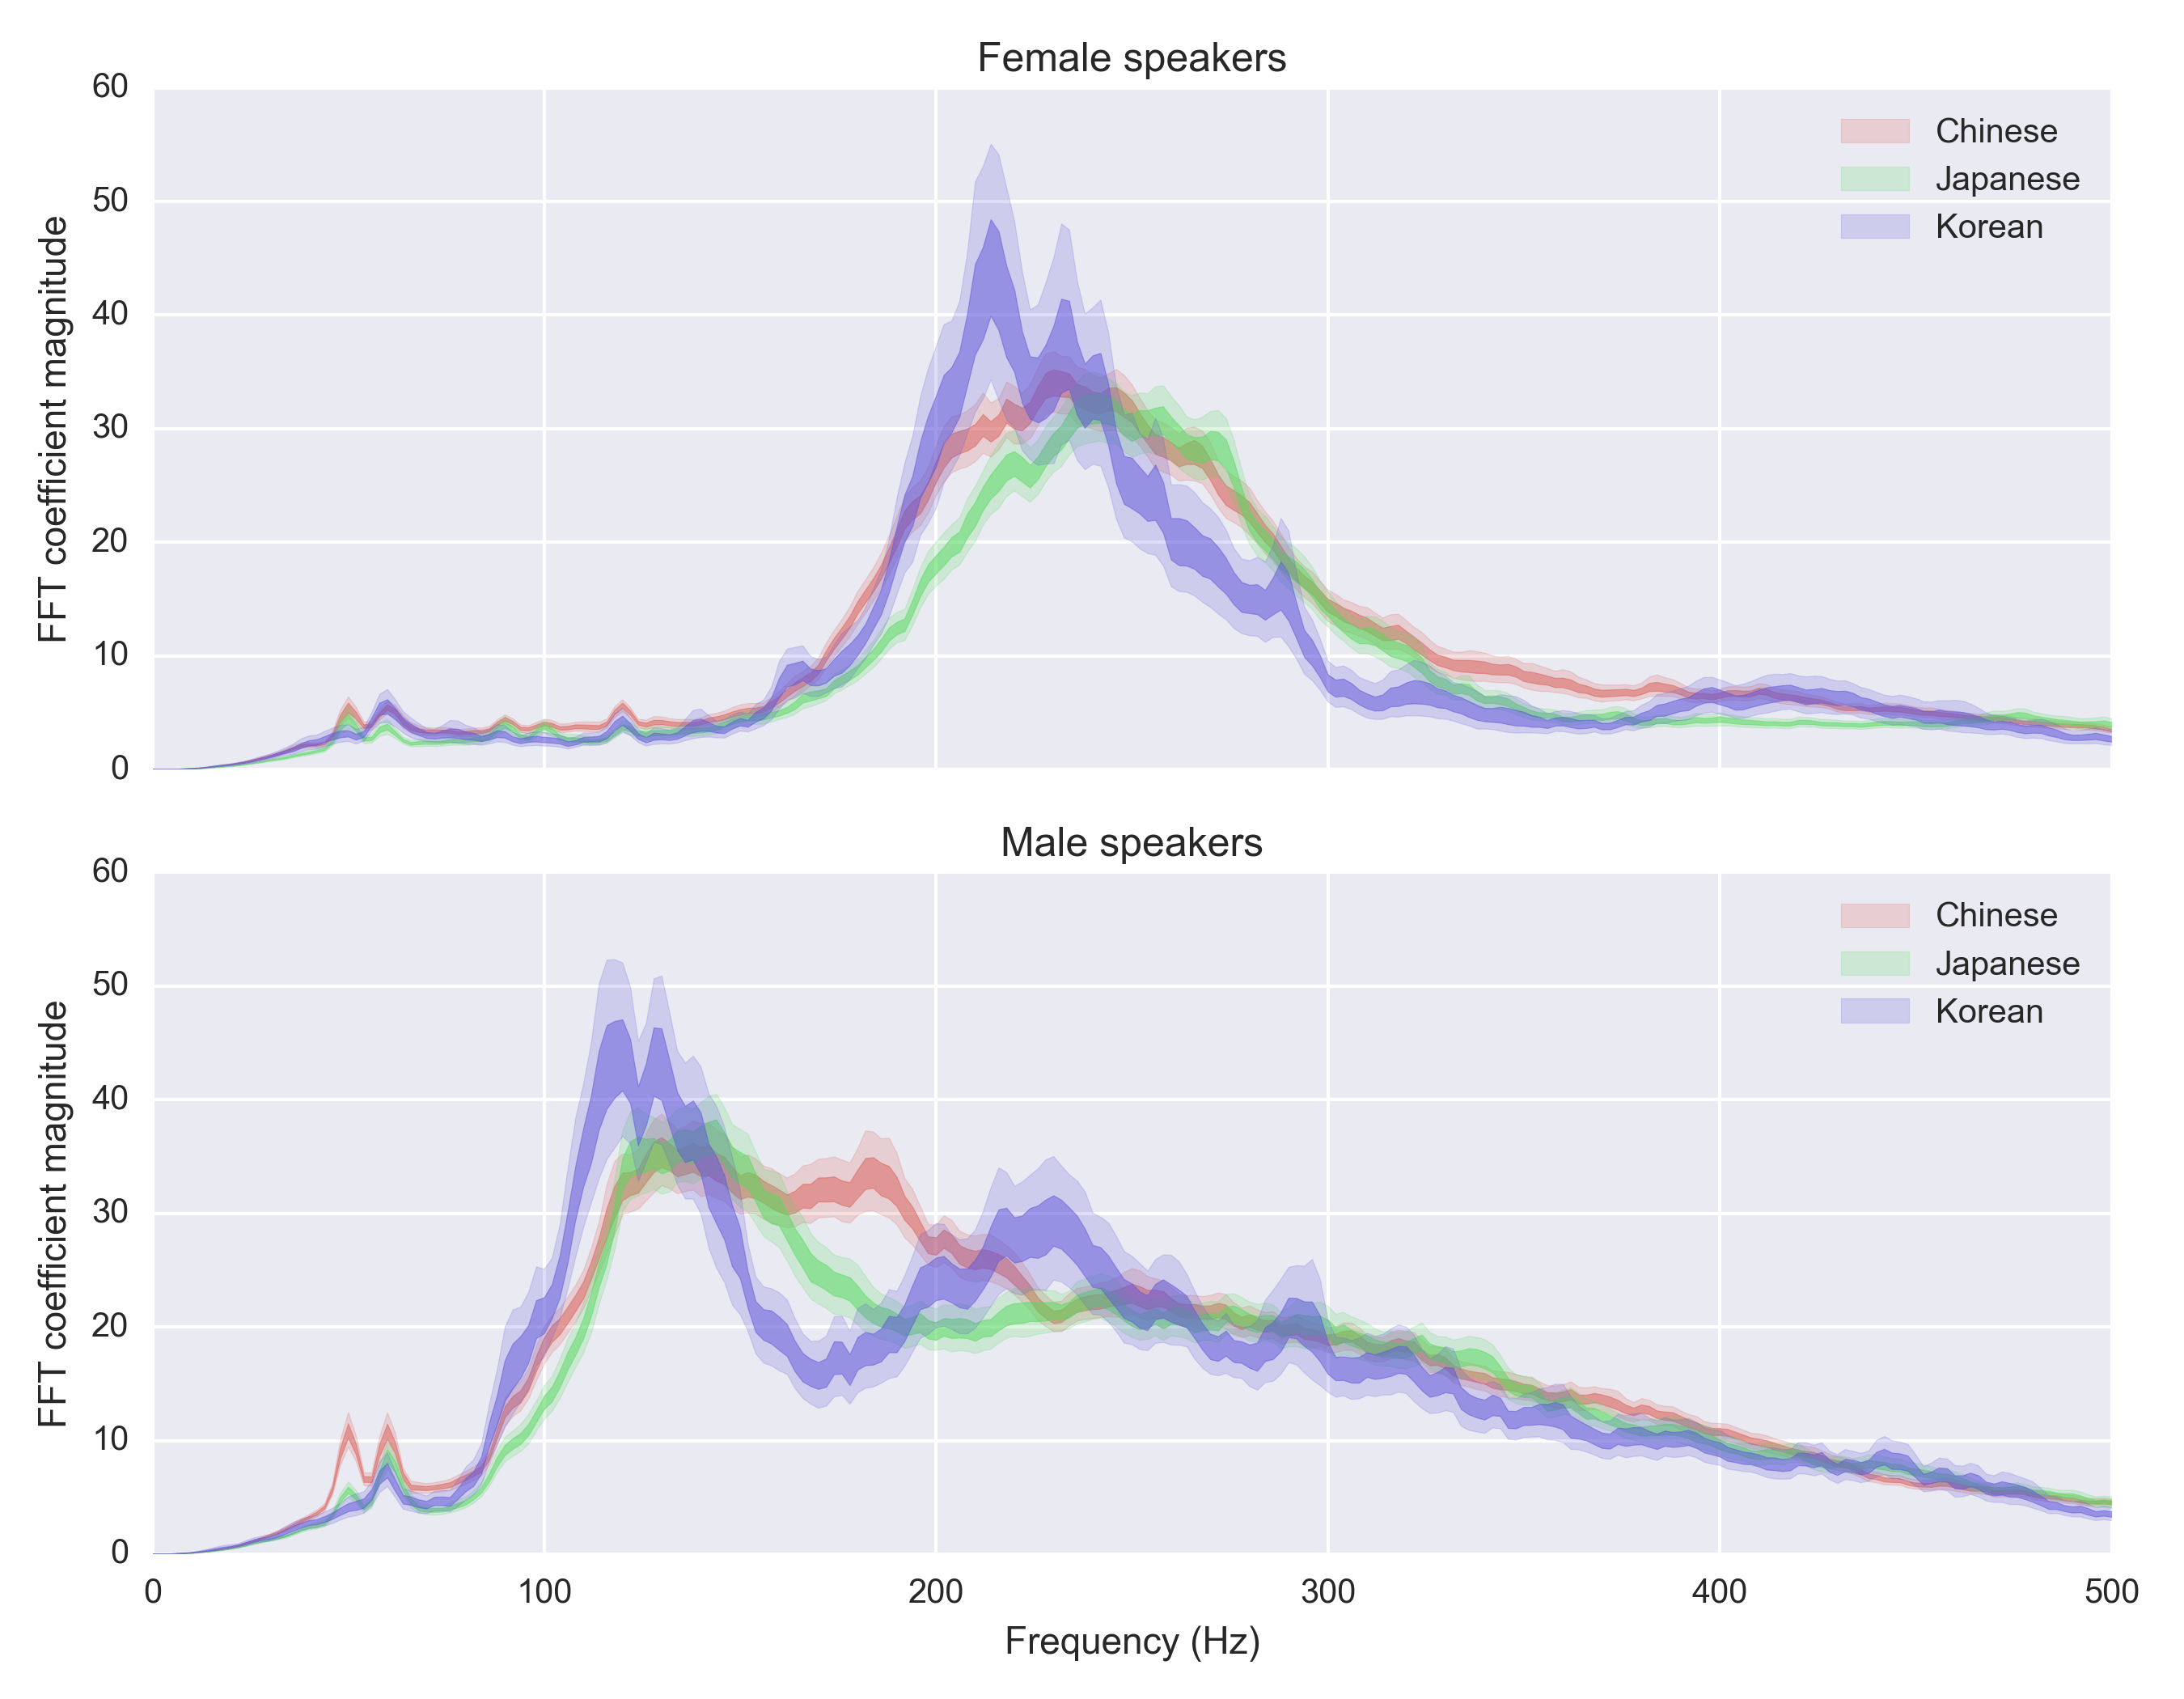
Chinese and Japanese stand out, both being very high-pitched languages.
There’s a really weird thing going on here, that I can’t explain. Chinese has a really different distribution for males. I suspect this has to do with the fact that it’s a tonal language, but I’m not sure why it applies to males only. Let’s plot all the Chinese variants to investigate this further.
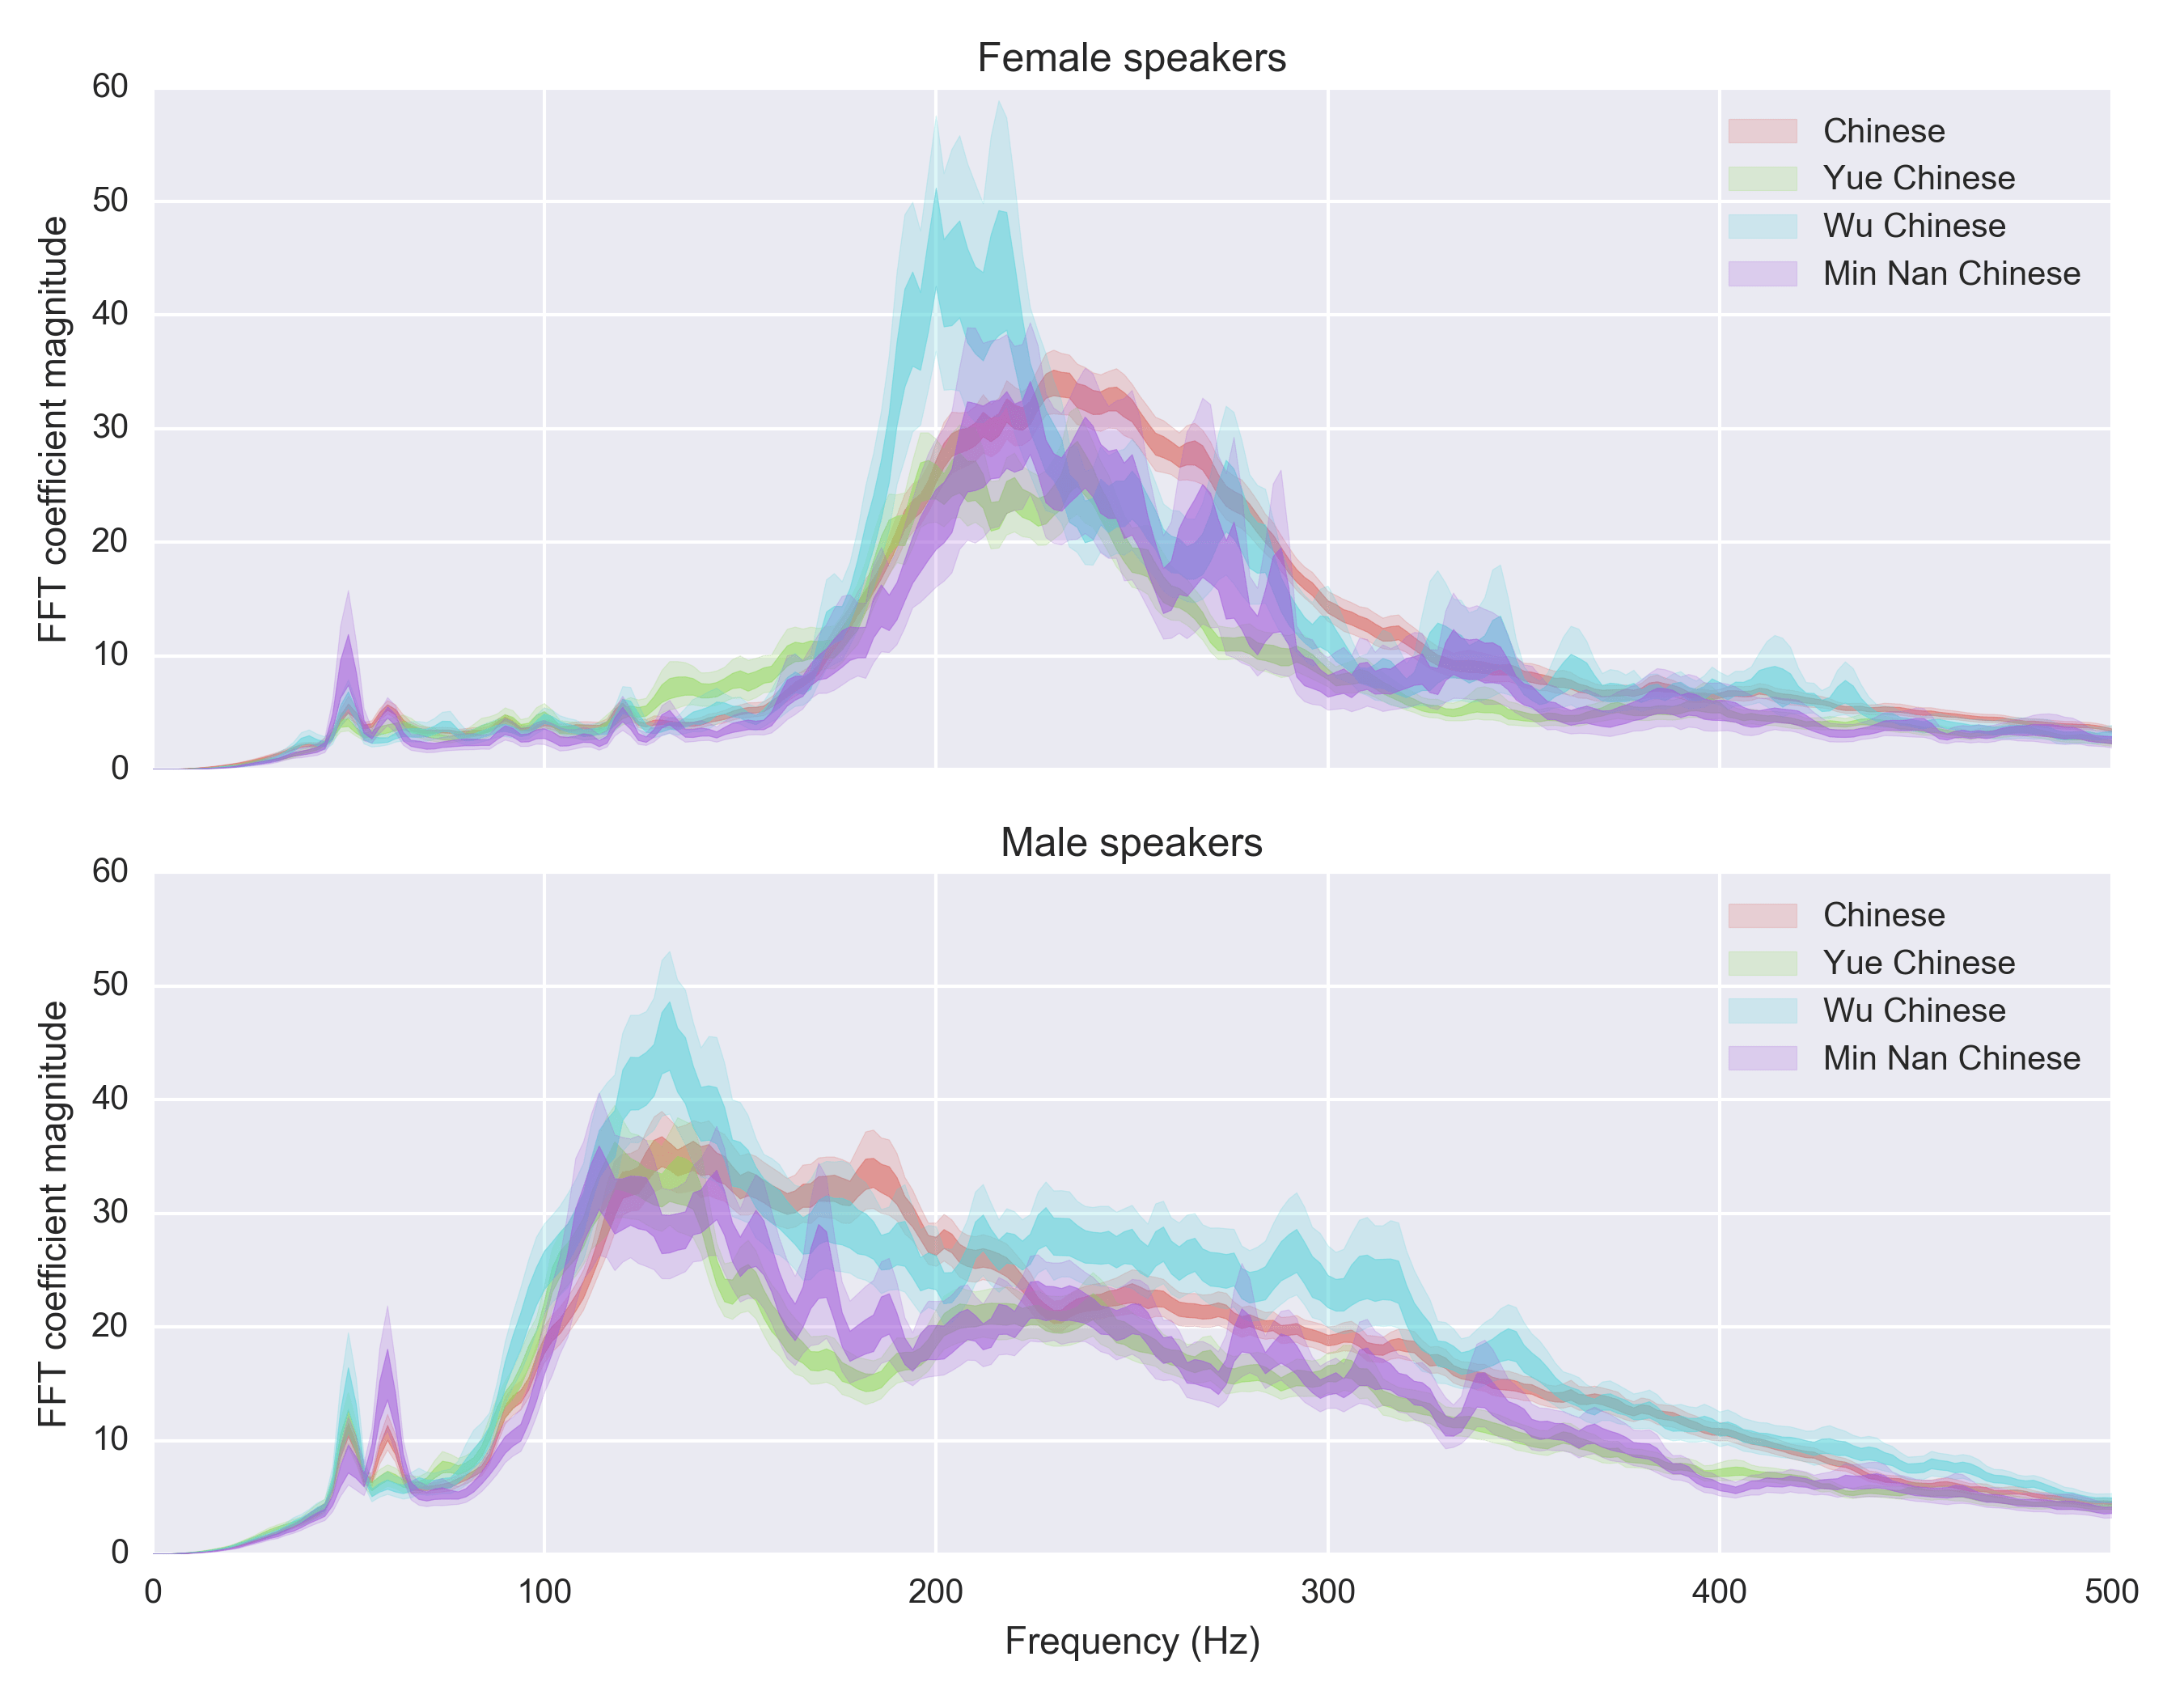
(By the way, these are languages that ignorant people like me have barely heard of, yet even the smallest of them (Min) has 60M speakers.)
It’s quite interesting to see how the Chinese variants seem to have far greater difference in their spectra than between English/Spanish/Russian (see above). I suspect it has something to do with how different variants of Chinese features different number of tones – Mandarin has 4, Wu has 7 etc. The stark difference between male and female speakers (not just different pitch, also a different shape) is still a mystery.
One weird thing
If you’re really paying attention to the graphs, you’ll notice some weird peaks in the lower end of the spectrum (around 50-60Hz). I didn’t really think of it but Andreas Öman pointed out that these are actually a really interesting artifact. Can you think of it? 🤔
Ok – I’ll give you one more hint. Look at this chart of female English speakers and the difference betweek UK and US. Pay attention to the weird spikes on the far left of the curve
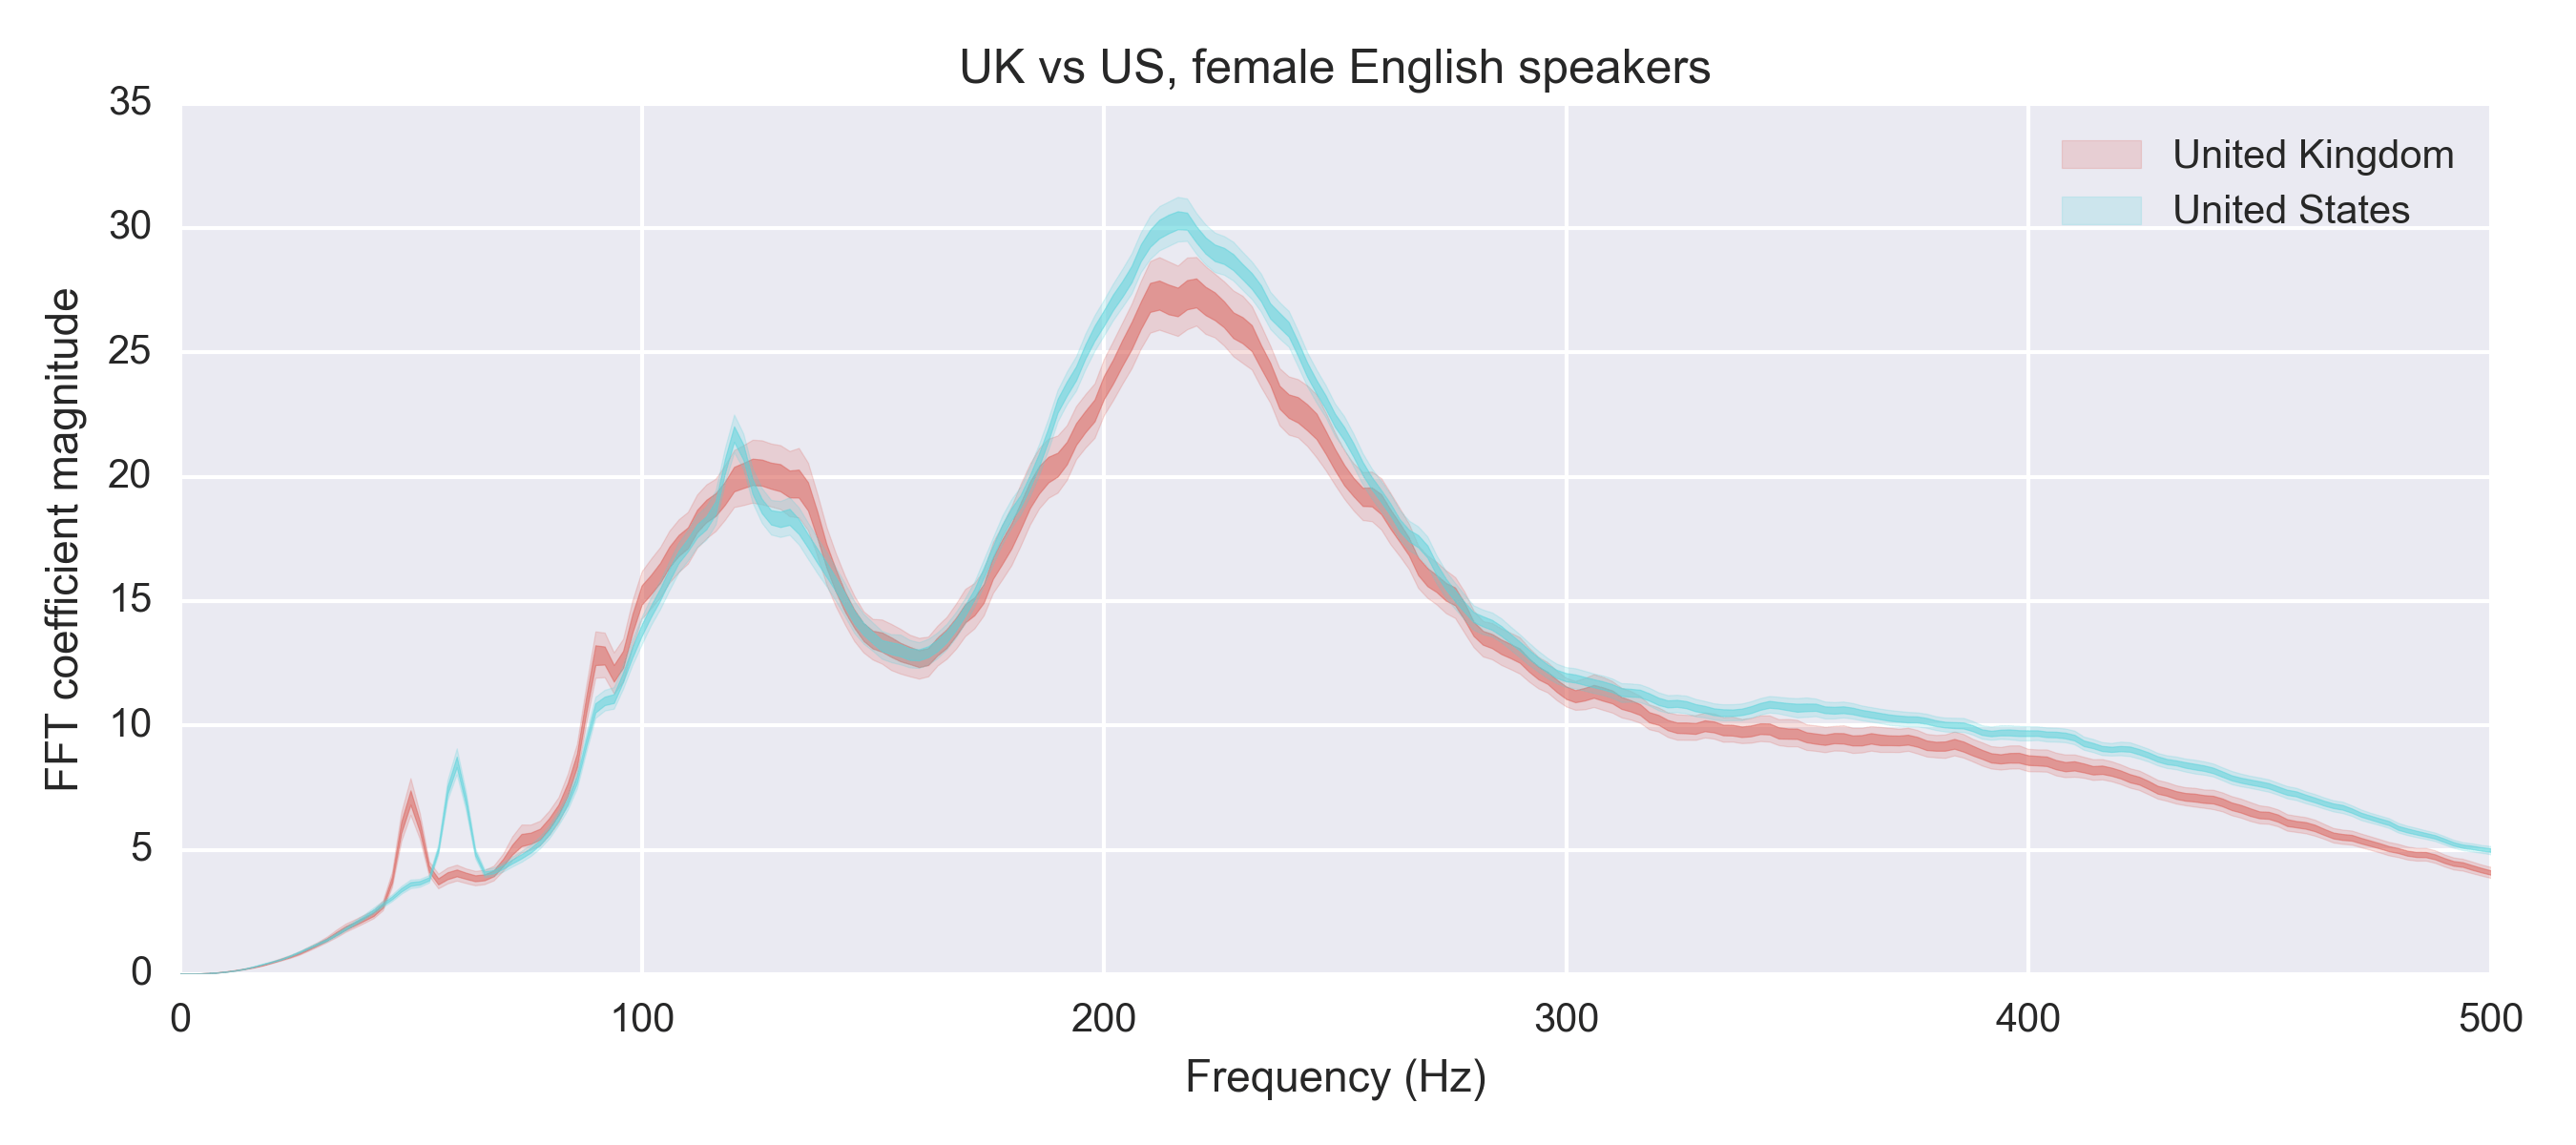
These are actually AC frequencies ⚡ which occur at 50Hz in Europe vs 60Hz in the US! Turns out you can detect it in the audio spectrum of sound clips pretty well.
Ok, but what’s the point?
<speculation>
Here’s a hypothesis: there might be a “natural” pitch of each language that is optimized for pronunciating words with the least amount of effort. Maybe the most convenient way to speak Chinese is to do it with a high pitch? Maybe Hungarian phonology really favors a low pitch? I don’t know.
Another hypothesis: English is my second language, but it’s the language I use by far the most (since I live in New York). There was a very definite point when I realized that I had to change my voice to get to the next level with my accent. Oddly enough it was actually while studying German (my third language). It felt awkward at first to alter my voice to the point where I didn’t feel like it was myself talking. But on the other hand I could hear myself sounding so much more German (if you know what I mean). Having been through this transformation I decided to change my “English voice” as well.
This is quite speculative, and a linguist may disagree, but I suspect that one reason it’s hard to acquire a native language accent is that it’s hard to fully change the pitch of the voice. For instance, Mandarin speakers who picked up English as a second language seem to speak English with a slightly higher pitch. Finnish speakers seem to speak English with an unusually low pitch. Etc.
The pitch is of course not the only thing that constitutes a flawless accent – mastering all the nuances of a new languages takes years, if ever. But I suspect carrying over the pitch from another languages makes it harder to get all the finer points of the phonology.
</speculation>
How did I perform this analysis?
I built a very tiny scraper to download audio clips from a web site that shall not be named (I probably violated their ToS severely). Letting it loose for a few hours got me ~100k audio clips in different languages/genders/origins. I restricted it to 10 clips per speaker in order to get more variety.
After that, I converted all the clips to .wav and started playing around with pitch detection. I hadn’t expected to this to be such a sinkhole of effort but it turns out pitch detection is a hard problem.
As a preprocessing step, I found the 2.0s in the clip with the most intensity, and I added a Butterworth bandpass filter with a [50, 300] Hz frequency. A somewhat frustrating bug is that scipy.signal.butter is not numerically robust so I basically just perform a low pass filter then followed by a high pass filter instead. From the little I remember from signal processing in school, this should be equivalent. The bandpass filter seems a bit arbitrary, but the way I rationalize it is that I guess it’s form of Bayesian prior distribution of where you expect the fundamental frequency to pop up.
With the help of some online resources. I decided to go for a pure FFT approach. Basically just look at the spectrum and find the peak frequency. The problem with FFT is that various harmonic frequencies pop up in the resulting spectrum, so if the clip has a frequency of 100 Hz then you will see peaks on 200 Hz, 300 Hz, etc. For this reason, an autocorrelation approach seemed marginally better on individual clips, but I realized quite quickly that individual clips are too noisy to be meaningful. Here’s a sample of audio clips featuring 10 female English speakers and their FFT spectra:
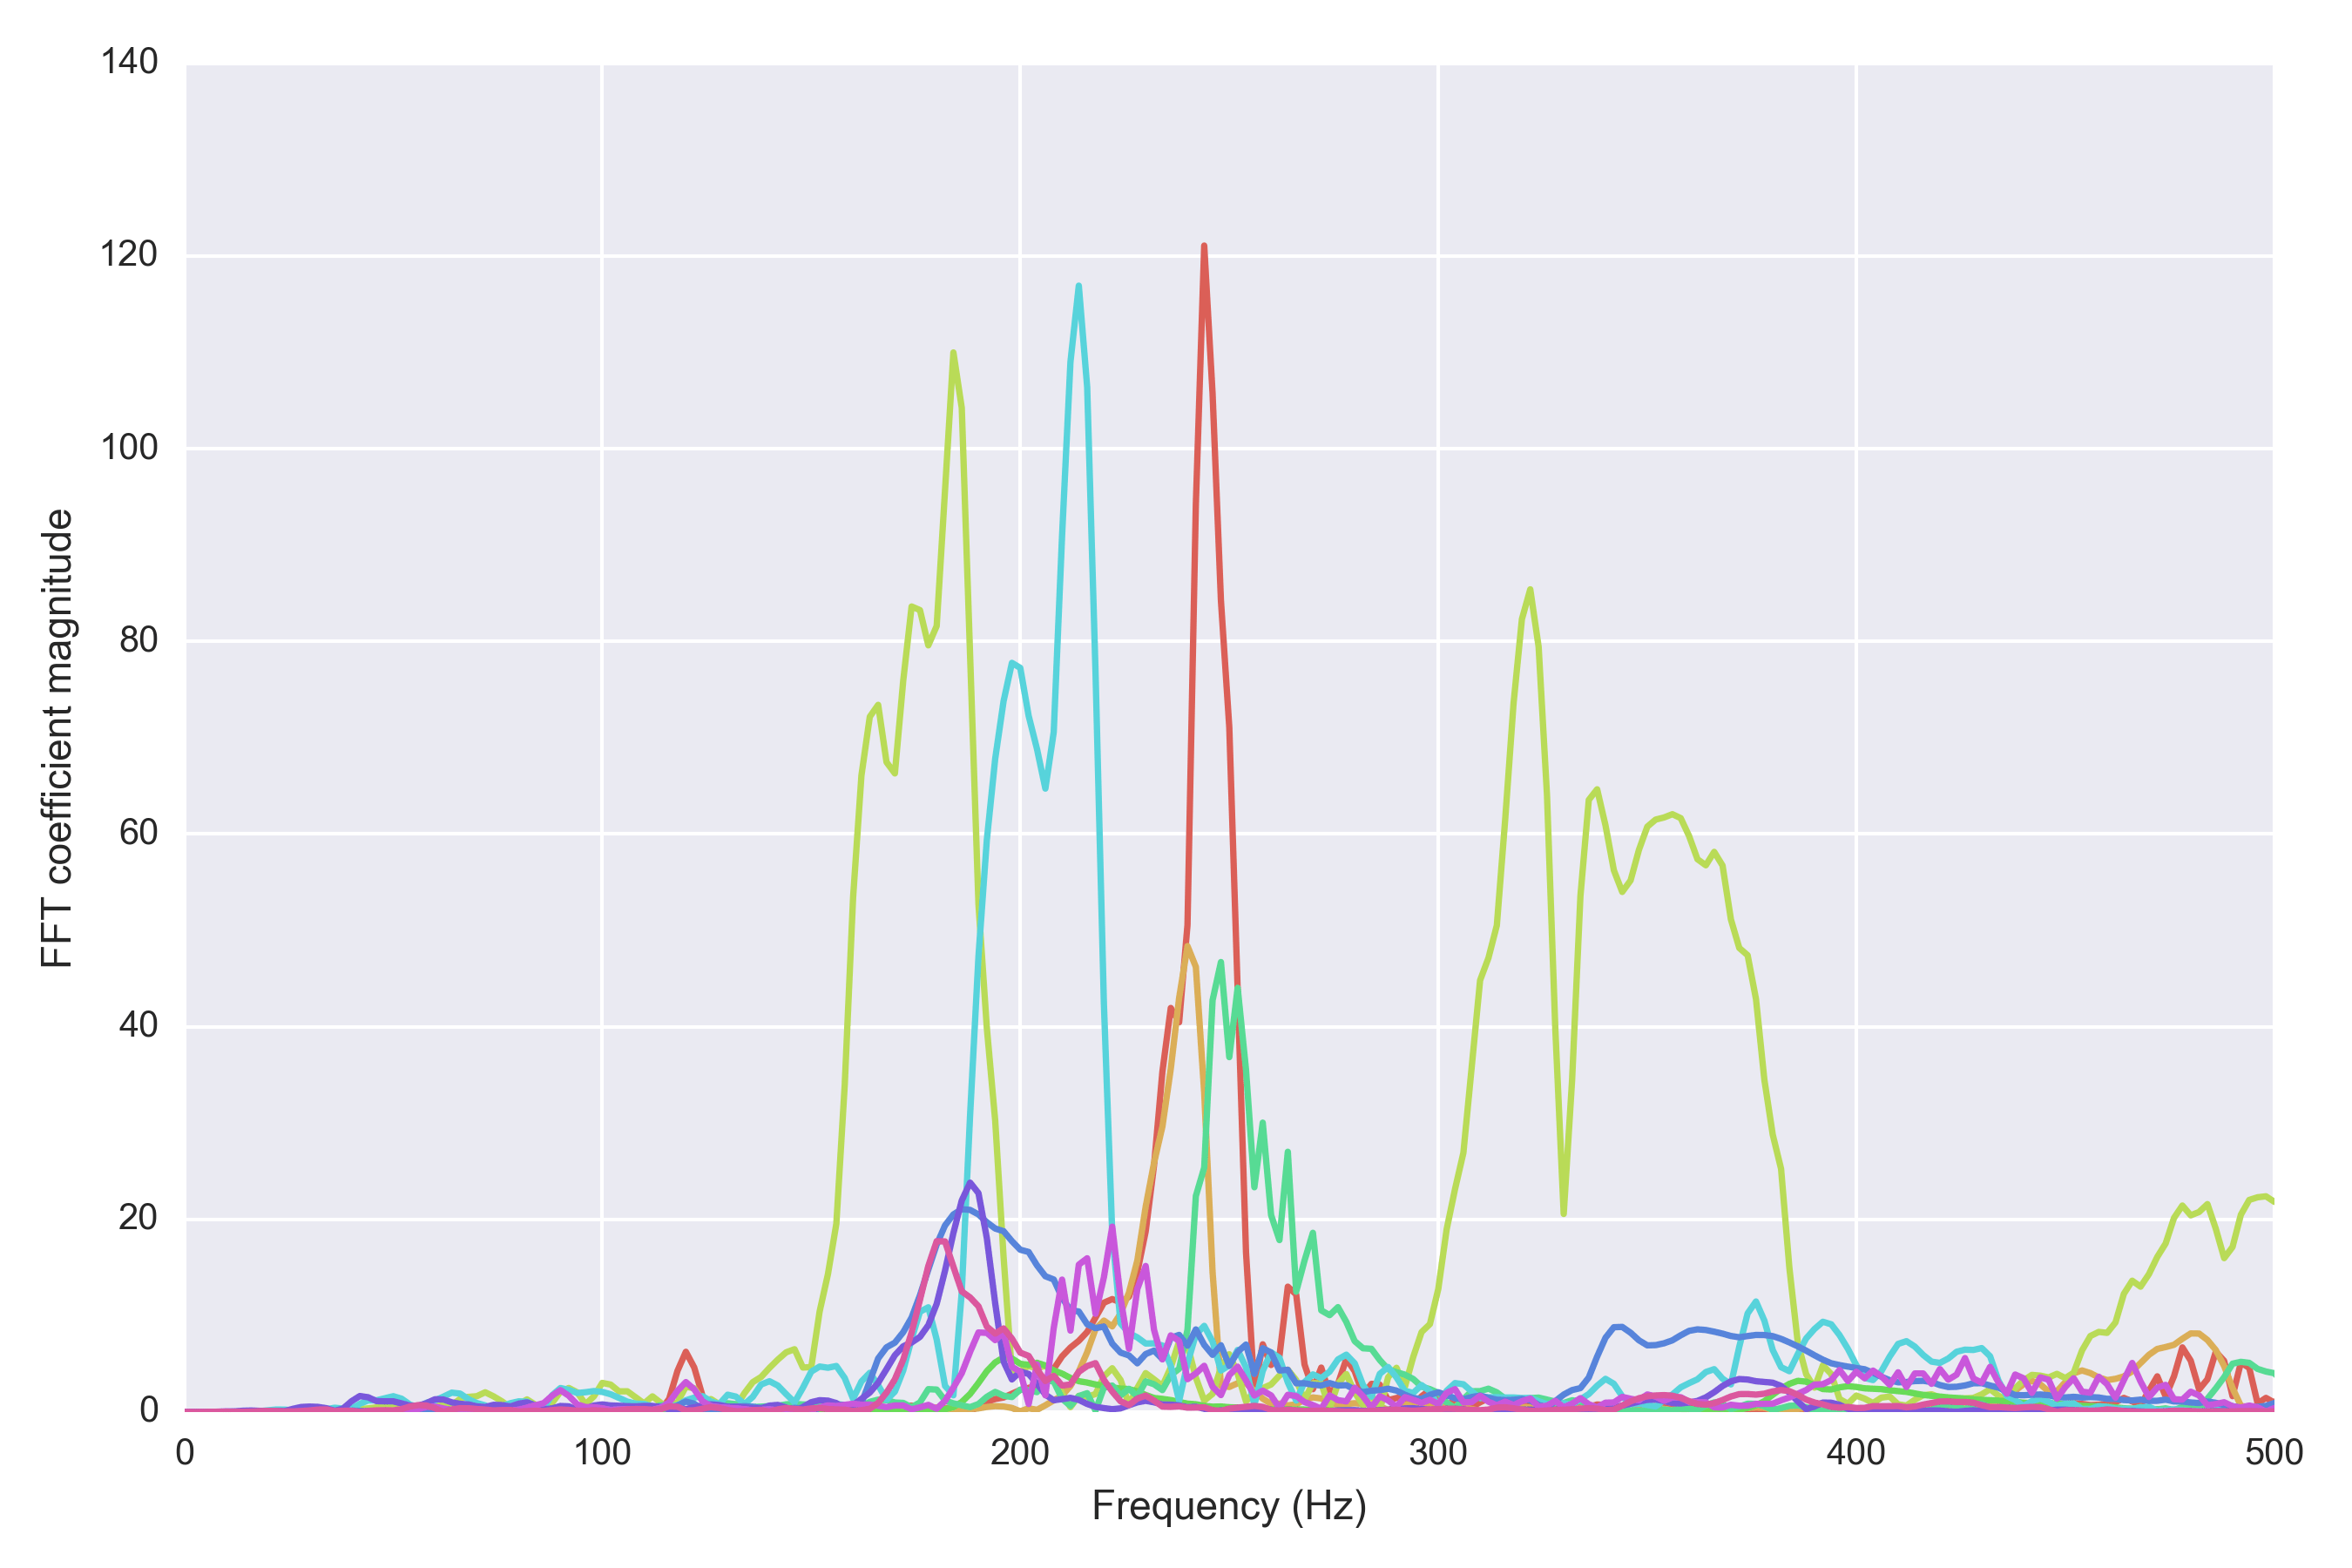
Instead, I decided to aggregate the frequency spectra from all clips and perform stats on the aggregated data. Again from what I remember from school, FFT is a linear operation, $$ f(x+y) = f(x) + f(y) $$, so it seems fine to compute the FFT spectrum individually for each clip, then add them together and try to look for the peak frequency. This disregards the fact that FFT returns complex numbers, but I think you can ignore the phase shift in the spectrum (the angle of the complex outputs) and just add up the $$ \mbox{abs}(f(x)) $$ components. I could be wrong (I’m swimming in deep DSP water here).
This seemed to do the trick, and then on top of it I wasted a bunch of hours trying to learn Pandas. I also decided to use bootstrapping to compute some uncertainty estimate of the frequency estimation, so that instead of summing up all the spectra, I sum up a bootstrapped aggregate and look at the peak frequency. This helps me understand the uncertainty of the peak frequency estimate, which turns out to be pretty substantial. (There’s probably a bunch of statisticians that would spin in their graves reading this blog posts.)
Anyway, the code is on Github in case you are interested! The whole thing is ~250 lines so somewhat ironically this blog post actually ended up being far longer!
Tagged with: misc, math, languages