Learning from users faster using machine learning
I had an interesting idea a few weeks ago, best explained through an example. Let’s say you’re running an e-commerce site (I kind of do) and you want to optimize the number of purchases.
Let’s also say we try to learn as much as we can from users, both using A/B tests but also using just basic slicing and dicing of the data. We are looking at how many people convert (buy our widgets) but a constant problem is there’s just too much uncertainty.
How can we learn faster? In particular, is there a way to incorporate additional data somehow? This struck me as a very universal problem, so I tweeted this and got some interesting pointers.
Reading material
Jeremy Stanley pointed out: “If you can place a dollar value on a unit of each metric, then you could use the total as a single metric”. I like that approach because it’s super simple and it’s easy to understand how it works.
John Myles White sent a link to a blog post: Using covariates to increase the precision of randomized experiments. I don’t quite follow it, but my understanding is that it’s more of a way to reduce noise caused by uneven assignment between the test and control group. Eyad Sibai pointed out a KDD paper: Boosted Decision Tree Regression Adjustment for Variance Reduction of Online Controlled Experiments. The idea is simple. Instead of using say “purchased a widget” as an outcome metric, try to predict based on user attributes whether the user is going to purchase the widget. Then, use the deviation between the prediction and the real value (whether the user purchased the widget) as the target metric in the test. Using this approach, they reach the same level of statistical significance with 63% less data. Nice!
Uri Shalit sent a link to a paper: Correlated Bivariate Continuous and Binary Outcomes: Issues and Applications. The paper looks cool, but is way over my head, sadly.
Adrian Palacios sent a link to a new Netflix blog post: Innovating Faster on Personalization Algorithms at Netflix Using Interleaving. This research focuses on a very narrow problem: ranking video recommendations. By scrapping A/B testing for “interleaving”, they show that they get to significance about two orders of magnitude (100x) faster! That’s extremely impressive, but it’s not clear to me if it generalizes to any other type of tests.
A simple toy model
Enough literature study. I wanted to try this in practice. My idea is: create a model that predicts whether someone is going to purchase a widget given a lot of additional data. And instead of using the actual target metric (what fraction of people bought widgets) we use the predicted metric, using our machine learning model. So for instance as inputs to the model we throw in all kinds of features, and then try to predict the target (did the user buy the widget or not?)
I experimented with a few different models and the one that seemed to work the best was the most basic model you could ever think of: linear regression. The inputs are all binary variables that denote whether the user hits certain pages in the conversion flow. In total there’s 70 different features (we have a lot of special pages only some users hit). The predictor is a binary variable indicating whether the user converted. I train the model to minimize the squared loss.
One cool feature is we can apply dropout on the inputs, since that makes it possible to include the target itself as an input. It turns out doing that and using extreme dropout actually seems to work really well. I ended up dropping 90% of the inputs during training. The model is a few lines using Keras:
inputs = keras.layers.Input(shape=(X.shape[0],))
inputs_dropout = keras.layers.Dropout(0.90)(inputs)
outputs = keras.layers.Dense(1, activation='linear')(inputs_dropout)
model = keras.models.Model(inputs=inputs, outputs=outputs)
model.compile(optimizer=keras.optimizers.SGD(lr=1e-2), loss='mse')
model.fit(X, y, batch_size=16, epochs=300)
Results
I “simulated” a conversion rate A/B test by picking three random subsets of users to our site in some way I’m not going to disclose. We want to understand if the conversion rate is different between the three subsets.
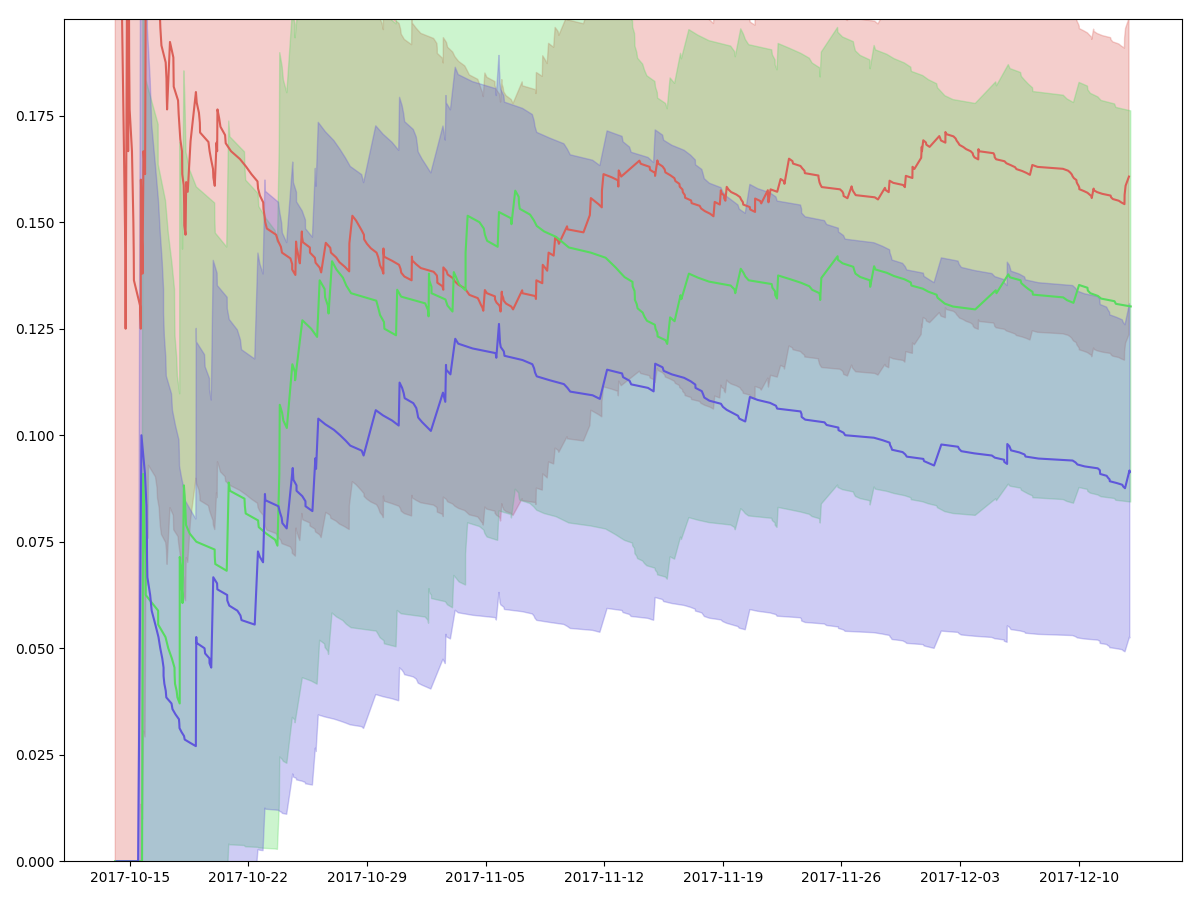
Let’s first run the analysis the “traditional” way. We look at the fraction of users who make it through the entire conversion flow, and we plot the conversion rate with a confidence interval. As we get more and more data, the confidence interval for each group shrinks:
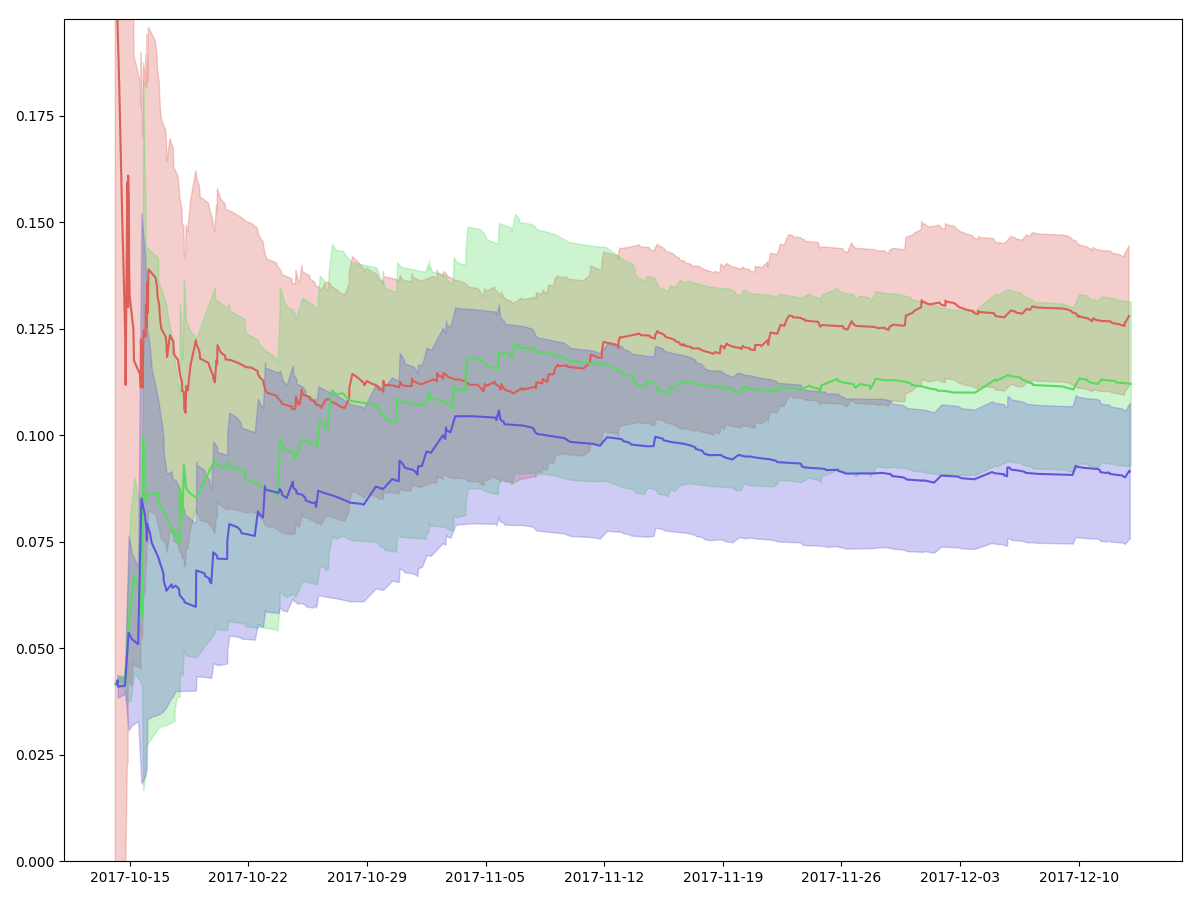
Then, I train a model on data from earlier this year so that it’s properly out of sample. Let’s plot the same thing again, but replace all the “real” values with their predicted values. Each predicted value is obtained by feeding in all the 70 binary values for each user.
We can see that the confidence intervals are much tighter and that the conversion rate curve is much smoother:
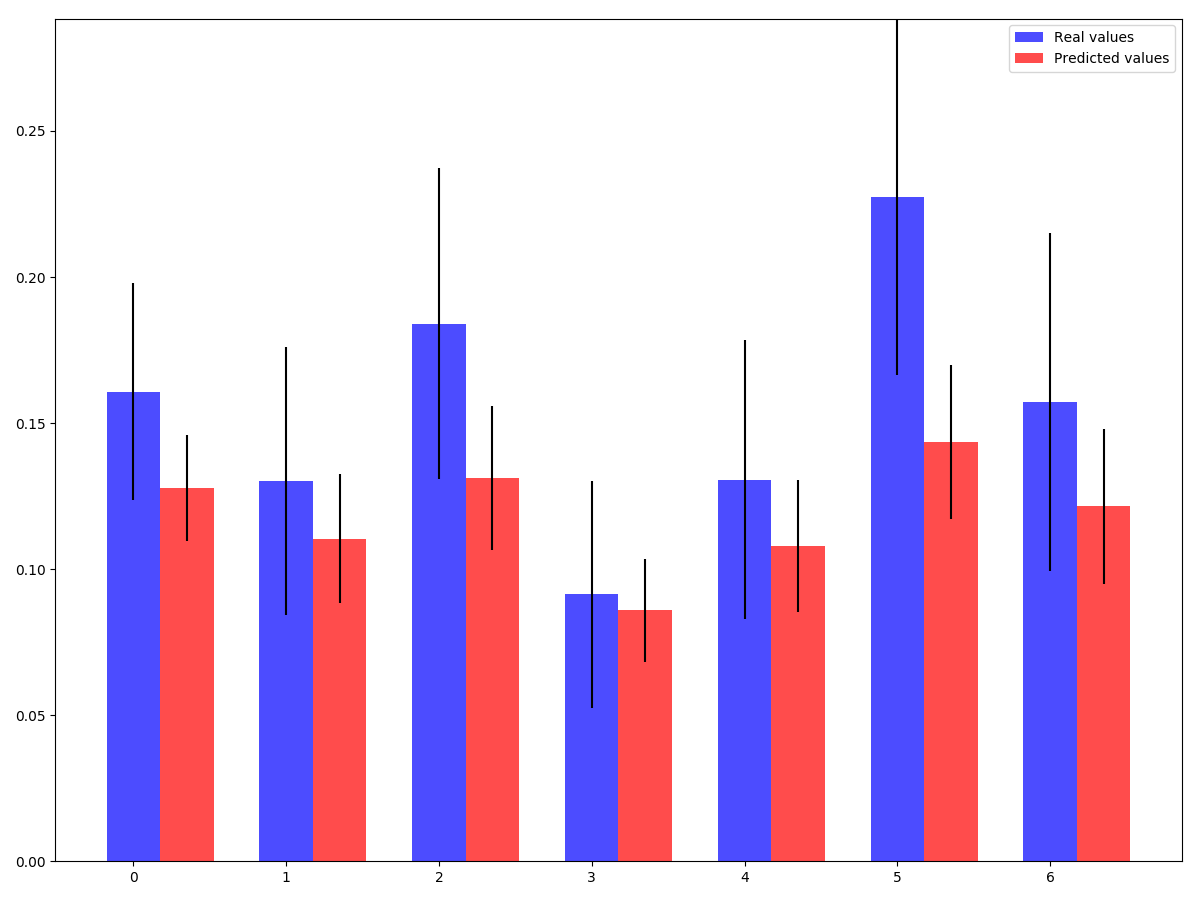
This is actually pretty cool! In this case, it looks like we can actually get a confidence interval that’s almost 50% smaller, which means we can get to statistical significance about 4x faster. If we plot the conversion rates and the confidence intervals for a larger set of groups, we can see that the uncertainty is consistently smaller using the predicted values:
Conclusion
Consider this blog post a bit of a wacky experiment – I think the outcome is super interesting, and worth thinking more about.
One downside of this model is that the reduction of variance doesn’t come for free. We’re basically trading a bit of bias for variance. The predicted conversion rate might have a tighter confidence interval, but it’s no longer guaranteed to converge to the “correct” value. Is that acceptable? I don’t know. Another issue is you can have some kind of “covariate shift” where the data distribution changes over time. For instance what if your conversion flow completely changes.
I haven’t spent enough time understanding this, and I haven’t made up my mind if this tool is going to be something I’m planning to use for real data. This is admittedly a bit of a half-baked idea that I would love to get some feedback on!
Postscript
The almighty John Myles White tweeted a link to this blog post but raised a number of concerns with the methodology. We had bit of back and forth but I think I was able to address the concerns. I think it’s useful to rehash some of the arguments for other people:
- Rather than focusing on some particular target metric (eg conversion rate), let’s focus on the underlying “user value”.
- “user value” is a continuous variable rather than binary, so should have lower variance (everything else equals).
- We define “user value” by running a regression model that find a linear combination of many different user metrics in a way that predicts the original target.
- So basically we learn to replace one value with a lower variance version of itself (but with slight bias).
Some more notes:
- Why using a neural network for this? It’s basically a linear regression, but we need some kind of regularization. I have a mild preference for dropout since it’s dimensionless.
- Why do we need regularization? Without it, the linear regression would just learn the trivial mapping where the target predicts the target and everything else is ignored.
- You can see the bias-variance tradeoff pretty clearly here. If you set the dropout to 0, you get zero bias, high variance. As you increase the dropout rate, you increaes the bias, but lower the variance.
- Sergey Feldman also pointed out this paper: Double/Debiased Machine Learning for Treatment and Structural Parameters. Seems interesting.