σ-driven project management: when is the optimal time to give up?
Hi! It’s your friendly project management theorician. You might remember me from blog posts such as Why software projects take longer than you think, which is a blog post I wrote a long time ago positing that software projects completion time follow a log-normal distribution.
Just a bit of a refresher if you don’t want to re-read that whole post. What does it mean that project completion time has a log-normal distribution? If a project is estimated to take one month to complete, it will sometimes take half a month, sometimes two months. We can define the “blowup factor” to be the ratio of actual vs estimated. Then the assumption is basically that the logarithm of the blowup factor will follow a normal distribution. and in particular, it’s a normal distribution with zero mean and some standard deviation σ (which is the Greek letter “sigma”).
We can plot a normal distribution in terms of its cumulative density function. What does this mean? It means the probability that the project has finished, as a function of time. See the chart below:
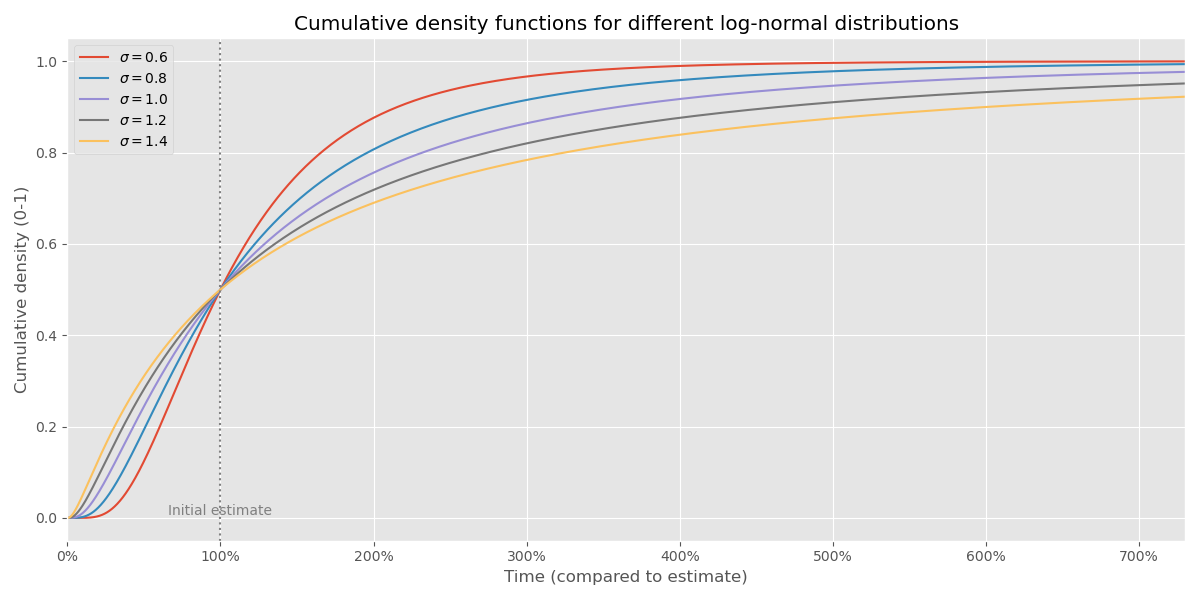
You can see that it’s 50-50 (median outcome) that we have completed the project at the point that corresponds to 100% of the original estimate (the dashed line). But let’s contrast two different values of σ:
| time | σ = 1.0 | σ = 1.4 |
|---|---|---|
| 0% | 0% | 0% |
| 50% | 24% | 31% |
| 100% | 50% | 50% |
| 200% | 76% | 69% |
| 400% | 92% | 84% |
| ∞ | 100% | 100% |
So just as an example of how to read this table: if σ = 1.4 then in 84% of the outcomes, you are finished with the project within 400% of the original estimate.
So where does the σ come from? My thesis for this blog post is that σ is an inherent property of the type of risk you have in your project portfolio, and that different values for σ warrants very different types of project management. Low σ means low uncertainty and means we should almost always finish projects. High σ means high uncertainty — more like a research lab — and means large risks of a huge blowup, which also means we should abandon lots of projects.
All models are wrong, etc…
The general gist of the model is something like this:
- The actual time it takes to finish a project has a log-normal distribution
- Every project has the same value if it succeeds 1
- Once we start to work on a project, we get no feedback until suddenly it finishes
- At any point in time, we may choose to (a) keep working on this project (b) abandon it
This is obviously a very crude model! It’s a bit like, you’re down in the mine blasting rock looking for one super big diamond. Finding the diamond is a very “binary” event in the sense that either we found it or not — there’s no partial credit, and nothing “learned” up until that point. However, if we’ve been down in one mine looking for a diamond for, I don’t know, ten years, then maybe we should reassess. Maybe it’s time to go to a different mine?
So let’s focus on the decision of finishing or abandoning a project, which roughly comes down to: once something is late, is it still worth working on it? Are you getting closer or further away from success? 2 3
How much business value are you creating, my friend?
The business value per time is basically 4 the success ratio per time spent (which is, roughly, the probability distribution function).
I’m going to rescale it so that we always start at $$ y=1 $$ for reasons I’ll get back to shortly. Here’s what it looks like: 5
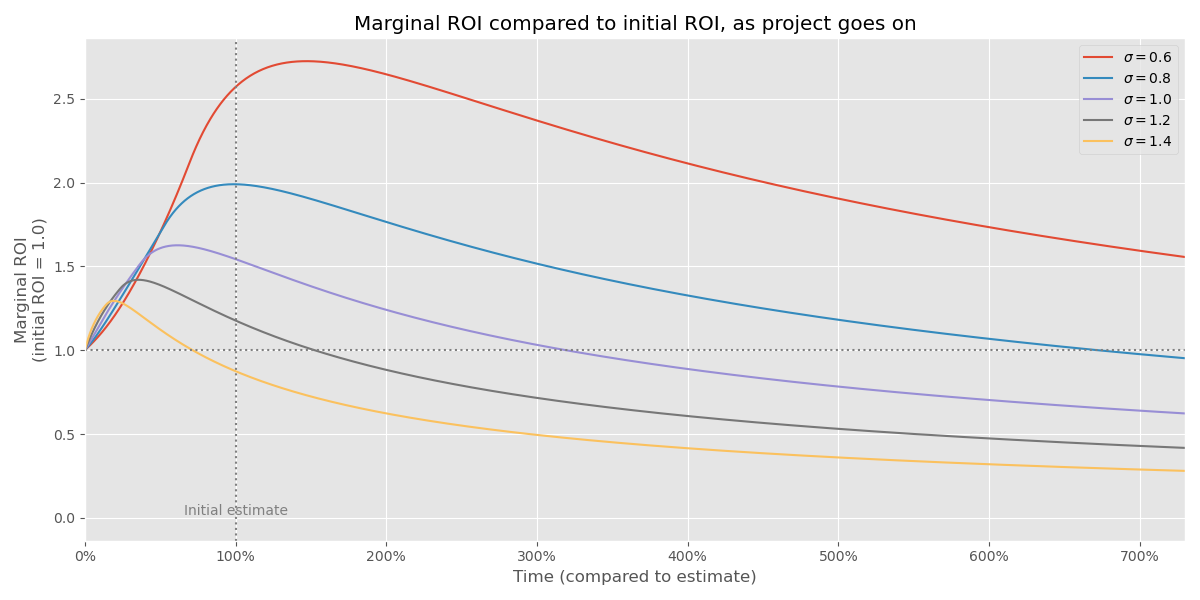
What’s going here? Working on a project has increasing marginal business value in the beginning, which intuitively makes sense because we’re getting closer to finishing it. But if we haven’t finished it at some point, it’s somewhat likely we ran into a “monster” project that’s going to take an massive amount of time to finish, much more than we initially thought. So the business value starts to decline at some point (for high-σ projects rather quickly). Which means, are we actually working on something valuable still?
Drop it like it’s lower marginal ROI
Presumably, we picked this project from a crop of potential projects, where the top one beat the 2nd one by a small margin. So at some point, once the business value per time drops below where it started, we end up in a place where abandoning the top ROI project and switching to the second honest one makes sense. That’s why it’s interesting to compare the current marginal ROI with the initial marginal ROI.
Graphically, this happens in the previous chart at the dashed line $$ y = 1 $$. Let’s record when the curves intersect $$ y = 1 $$ and put those points back into the first chart in this post — the cumulative distribution function:
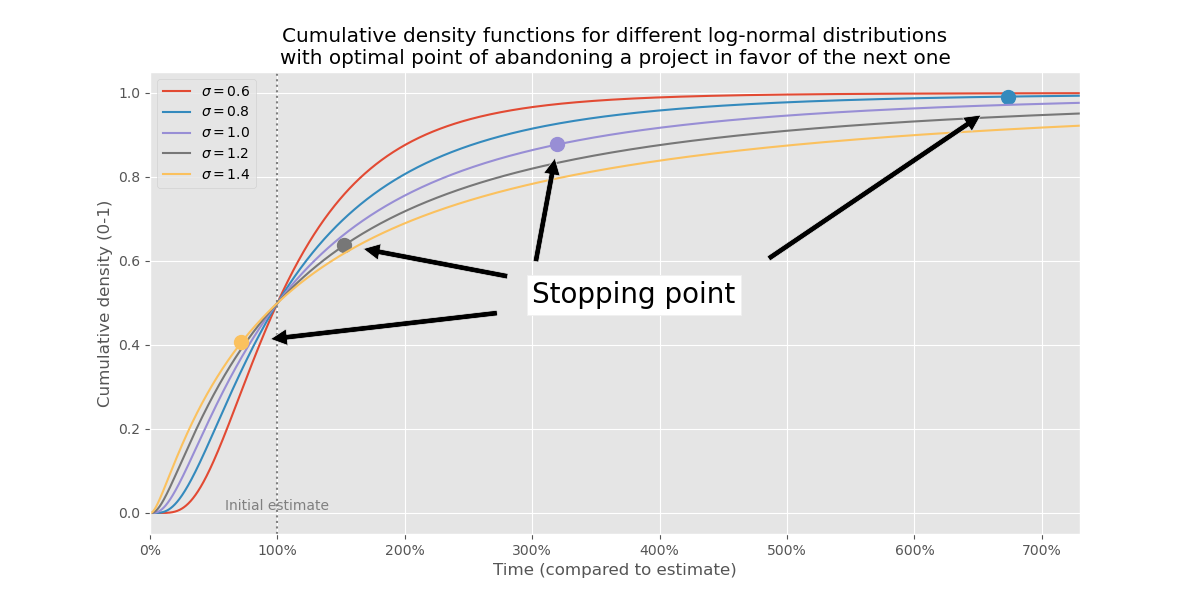
These points are wild! Like, we start with curves that graphically aren’t too different, but when we solve for the optimal time to abandon a project, we end up with wildly different results. I find that pretty amazing and worth putting in a table:
| σ | When to give up | Project finish ratio |
|---|---|---|
| 0.6 | 1492% | 100% |
| 0.8 | 674% | 99% |
| 1.0 | 320% | 88% |
| 1.2 | 153% | 64% |
| 1.4 | 72% | 41% |
So just as an example, if σ = 1.0, then we should give up at 320% of the original estimate. If we follow this policy, then we finish about 88% of all project.
But if σ = 1.4, then we should give up at 72% of the original estimate, and if we do that, we finish only 41% of all projects.
These are pretty huge differences!
Project management depends on σ
What we’ve established so far is that high-uncertainty project management imply a high percentage of abandoned project.
This seems to pass a rough sanity check with reality! Any sufficiently research-like project will have a large risk of blowing up. For that reason, we should also be willing to give up on a high % of these projects. The optimal way to manage planning, resource allocation, and other things are wildly different:
Low-σ management
- Low uncertainty
- Near-100% of all projects finish
- Very accurate estimates
- Perfectly forecasted timelines for milestones
- Every day, monitor project completion and make sure it’s tracking
High-σ management
- High uncertainty
- Most projects are abandoned
- Estimates are pointless
- Resources are allocated towards ideas with potential
- There’s going to be lots of sunk costs
- Every day is day one
Is software different?
I’ve kept it super general so far and you can apply it to almost anything — digging for dinosaur fossils, or painting a house (question for the reader: which one of these is low-σ and which one is high-σ?)
But let’s talk about software for a second. Why is it so hard to predict? Here’s my theory: because anything predictable suggests something is redundant and should be factored out.
If it takes an engineer one day to build one API integration, it’s not going to take them 100 days to build 100 API integrations, because on day 3 or whatever, the engineer will build an API integration maker framework that lets them build API integrations faster. 6 This will lower total effort a lot, but the total uncertainty a bit less. The σ — which is the relative predictability of the task in logarithm-terms, will go up.
In general, this is how us software engineers have done it for 50 years now. Everyone’s job is simultaneously building features and building tools that makes it easier to build features. We end up with layers and layers of abstractions, and each layer reduces the work we have to spend in the layer below. This is obviously great for productivity! It does however mean that software projects will be hard to estimate, and a lot of software projects will be abandoned.
-
We don’t really lose any generality making this assumption since it essentially cancels out. Same with the expected time spent, which is why I just talk about it in terms of % of the initial estimate. ↩︎
-
This is a bit of a Lindy effect: […] is a theorized phenomenon by which the future life expectancy of some non-perishable things, like a technology or an idea, is proportional to their current age. ↩︎
-
It also reminds me to some extent of a blog post I wrote a long time ago about how long it takes to wait for the NYC subway. ↩︎
-
It’s roughly the increase per time in the probability of finishing, which is the derivative of the cumulative density function (CDF) with respect to time, which is the probability density function (PDF).
It turns out this isn’t exactly right. Early on, the CDF is convex, which means that you can project a better slope by aiming for a point further out. So the “ROI” ends up being:
$$ \max_{t' > t} \frac{\mathrm{cdf}(t') - \mathrm{cdf}(t)}{ t' - t} $$ Once derivative is decreasing, then this is maximized as $$ t \leftarrow t’ $$, which turns the expression above into the derivative, and the derivative of the CDF is just the PDF. That’s reassuring! ↩︎
-
All the code is available on Github ↩︎
-
And on day 21 they will open source it and a bunch of other people will join and collaborate, and on day 42 they will create a startup and raise money and build API-integrations as a service, or something. Point is, you factor out common functionality not just across projects, but also across teams and companies. This all reduces predictability! ↩︎