More recommender algorithms
I wanted to share some more insight into the algorithms we use at Spotify. One matrix factorization algorithm we have used for a while assumes that we have user vectors $$ bf{a}_u $$ and item vectors $$ bf{b}_i $$ . The next track $$ i $$ for a user is now given by the relation
$$ P(i \mid u) = exp(bf{a}_u^T bf{b}_i) / Z_u $$
Where $$ Z_u $$ is a normalization constant to make sure the probabilities add up to one. This essentially means we treat the tracks choices as outputs of a softmax. You can think of it as a series of $$ n_u $$ choices for each user, where $$ n_u $$ is the number of tracks they played. Every track is a choice where the probability of each track is given by a softmax distribution. We don’t care about the order of these choices, but we assume each choice is independent of the other.
Assuming we have a ton of historical data where user $$ u $$ listened $$ n_{ui} $$ times to track $$ i $$ , we get a total log-likelihood (after simplifying a bit).
$$ log L = sum_{u, i} n_{ui}left(bf{a}u^T bf{b}i - log Z_uright) = left(sum{u, i} n{ui}bf{a}_u^T bf{b}_iright) - left( sum_u n_u log Z_uright) $$
Note that $$ Z_u $$ only has to be calculated once for every user. Although it’s a sum over all tracks, in practice we can estimate it by sampling random tracks and extrapolating.
Turns out you can implement this as a Hadoop job (this paper is quite helpful) doing alternate gradient ascent. Convergence isn’t super fast, but the results look qualitatively better than other methods like PLSA and the algorithm by Koren et al that seems to be pretty popular.
Measured as a pure predictive model, the model described above doesn’t perform super well. In the graph above, we look at how well the algorithm ranks future items in a validation set, including items the user didn’t play. We use the Gini coefficient, the higher, the better. The model described above is “User MF beta=1.0, f=40″ (I’ll follow up and explain beta in a later post). HKV refers to the model by Koren et al (because the authors of that paper were Hu, Koren, and Volinsky).
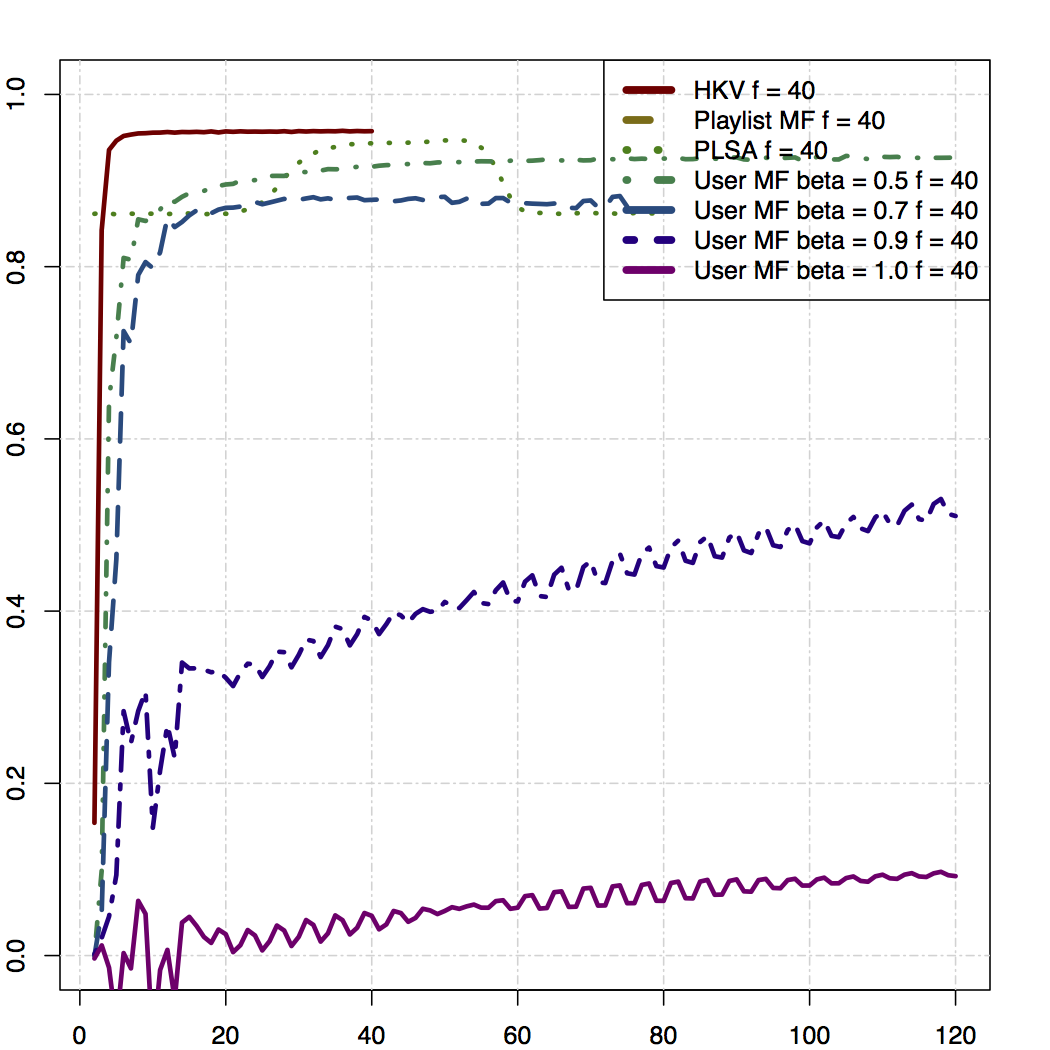
In the plot above, the x axis represents the number of iterations, whereas the y-axis gives the value of the Gini coefficient.
However, turns out if we look only at items that the user played at least once, the algorithm kicks ass (especially if try different values for beta, which I’ll get back to at some point). It also makes sense that this is a more useful metric to look at, since if a user plays a track zero times, it’s probably likely they didn’t actually know about the track in the first place.
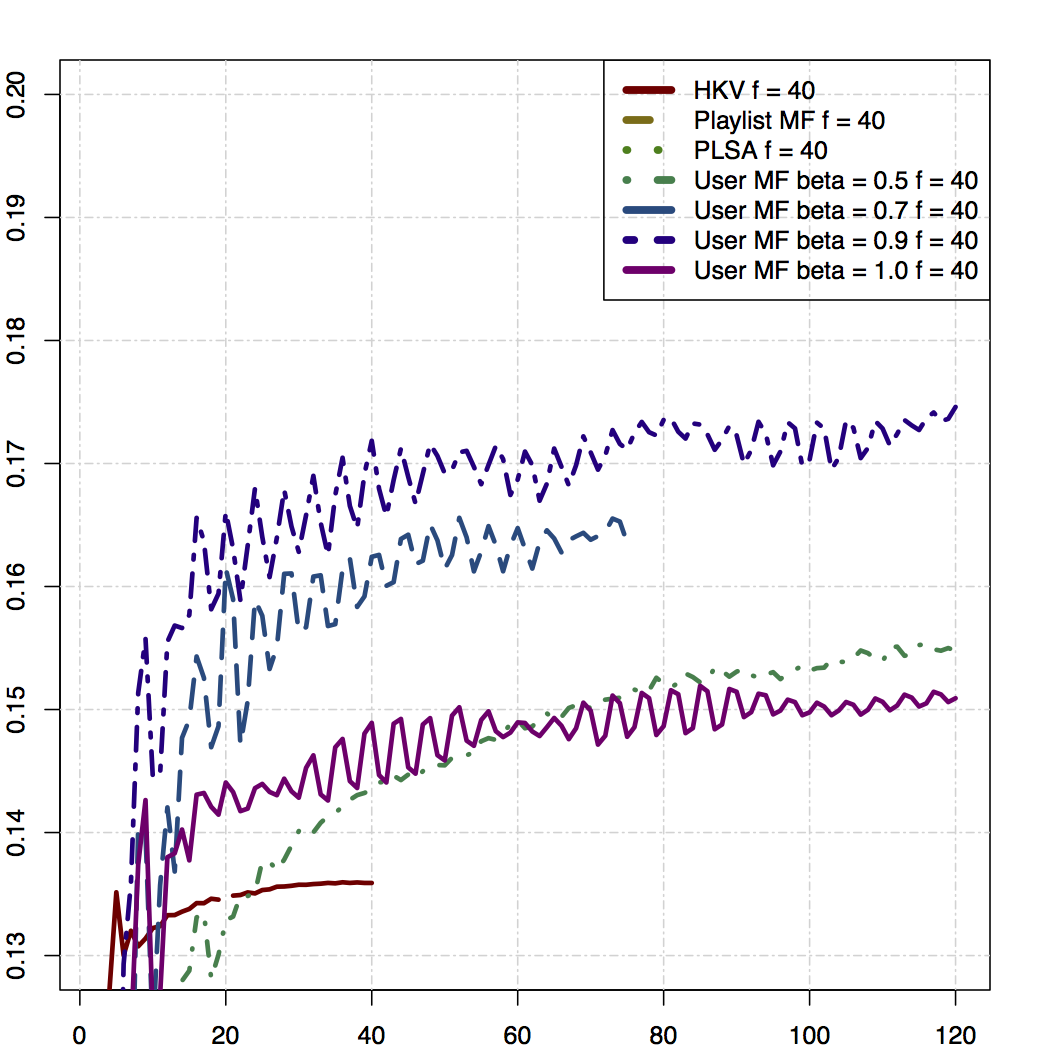
We also have a lot of other internal metrics that show that this model outperforms pretty much anything else. It is substantially better at predicting radio skips and thumbs, it’s much better at ranking related artists, etc.
Here are some examples of related artists as ranked by the cosine between the vectors:
| Artist |
|---|
| Daft Punk |
| Beach Boys |
| Eminem |
| Beyoncé |