Pareto efficency
Pareto efficiency is a useful concept I like to think about. It often comes up when you compare items on multiple dimensions. Say you want to buy a new TV. To simplify it let’s assume you only care about two factors: price and quality. We don’t know what you are willing to pay for quality – but we know that everything else equals:
- The cheaper the better.
- The higher quality the better.
This means we can rule out some TV’s immediately. If TV number 1 is both cheaper and better quality than TV number 2, then there’s no point buying number 2. Other TV’s we can’t compare because they excel at different things (price and quality). We obtain a partial ordering. If you keep removing TV’s that are dominated this way you end up with a set of TV’s on the Pareto frontier. The really nice thing is we don’t have to worry about what scales we’re using. We also don’t need to know how the consumer’s tradeoff function looks like. All we need to care about is there is a way to rank quality and there’s a way to rank price.
Wikipedia features the typical of definitional math that’s extremely hard to get any intuition from:
The Pareto frontier, $$ P(Y) $$, may be more formally described as follows. Consider a system with function $$ f: \mathbb{R}^n \rightarrow \mathbb{R}^m $$, where $$ X $$ is a compact set of feasible decisions in the metric space $$ \mathbb{R}^n $$ and $$ Y $$ is the feasible set of criterion vectors in $$ \mathbb{R}^m $$, such that $$ Y = { y \in \mathbb{R}^m:; y = f(x), x \in X;} $$. We assume that the preferred directions of criteria values are known. A point $$ y^{\prime\prime} \in \mathbb{R}^m; $$ is preferred to (strictly dominates) another point $$ y^{\prime} \in \mathbb{R}^m; $$, written as $$ y^{\prime\prime} \succ y^{\prime} $$. The Pareto frontier is thus written as
$$ P(Y) = { y^\prime \in Y: ; {y^{\prime\prime} \in Y:; y^{\prime\prime} \succ y^\prime, y^{\prime\prime} \neq y^\prime ; } = \emptyset }. $$
This is pretty useless to me. I think it’s much more important to develop a visual intuition for how it works. You can define it in high dimensional spaces but let’s look at a two dimensional space first. So think of it as a list of TV’s and the axes are “quality” and “price”. The only important thing is that one TV dominates another TV if it’s better quality and better price. That’s pretty intuitive to me. If you remove all the TV’s that are dominated by another TV, you end up with the Pareto frontier. These are the TV’s that are the only meaningful choices.
One note about the TV example: lower prices are of course better than higher prices. So you can think of the two factors as (-price, quality) just so that right and up is always better.
Sometimes Pareto frontiers are drawn like this:
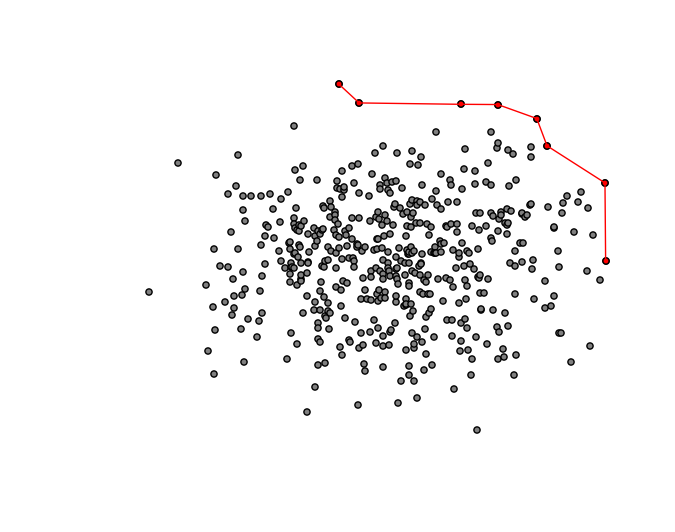
The red dots are the TV’s that are on the Pareto frontier. You don’t want to buy a TV that’s not on the Pareto frontier since there’s always another one that’s both higher quality and better price. The lines between the dots are just for illustrative purposes, they are not really a part of the frontier. I actually think this makes a lot more sense to draw it this way:
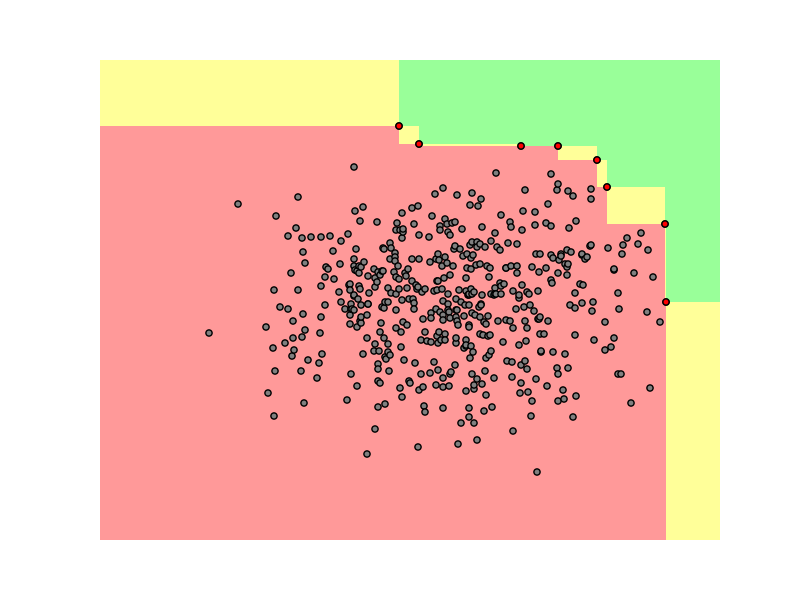
In this case let’s say Samsung has a TV that’s on the Pareto frontier (one of the red dots) and they are launching a new generation. They can move it up and right (all consumers would prefer that!). This improvement would be Pareto efficient or a Pareto improvement. They can move it down and left (this would be worse for all customers!). Or they can move it up+left or down+right and depending on the consumer they may or may not like it.
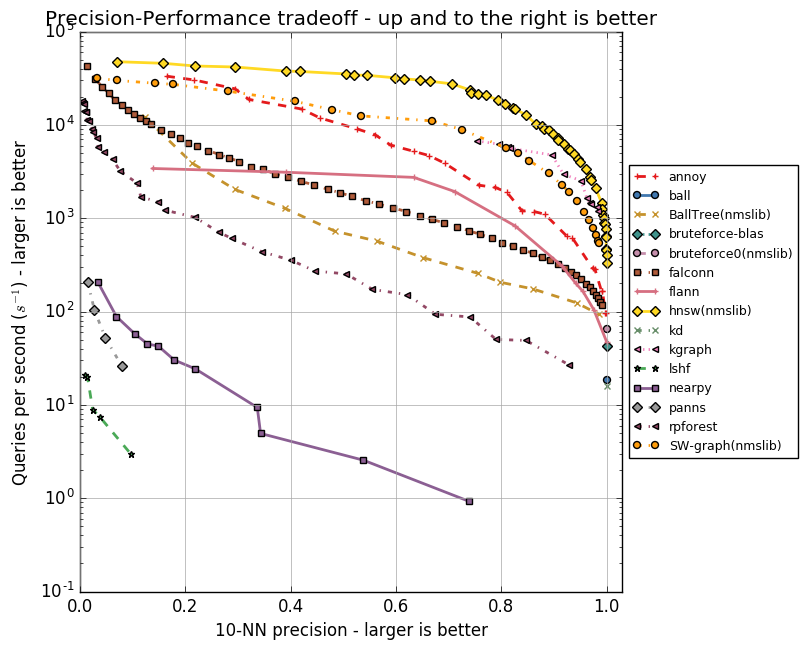
Benchmarks are a good use case for computing the Pareto frontier. Often it’s hard to break it down to a single number. I maintain benchmarks for approximate nearest neighbor libraries, where there’s a tradeoff between accuracy and speed. It’s useful to plot all points on a 2D graph:
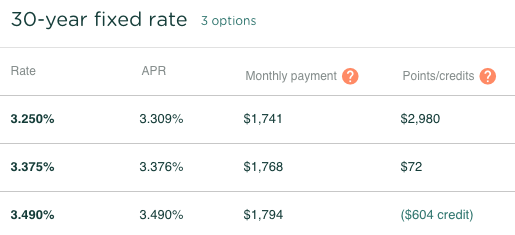
Another thing I used it for relatively recently was to present the best mortgages to a consumer. Basically there’s only two attributes: interest rate and points/credits. We actually compute the Pareto frontier for our rate table. In this case smaller numbers are better along both dimensions. This is really just the same thing, just flipping the comparisons.
I don’t really know a whole lot about Pareto efficiency, but here are some notes on the technical aspect of it:
- If you’re comparing items along two dimensions, you can do it in $$ \mathcal{O}(n\log n) $$. How? You sort the items along the x axis, traverse through. Any time the y value of the current point is larger than the y value of the previous point, you remove the previous point (it kind of resembles Graham scan for convex hull, which I guess isn’t so surprising – finding the Pareto frontier is basically Convex hull in som weird degenerate geometry).
- If it’s more than two dimensions, you can do it in $$ \mathcal{O}(n^2) $$. Just compare each pair of items and remove any strongly dominated one. I doubt there’s a faster algorithm but maybe? I’m sure there’s some obscure Ph. D. dissertation improving the bound to $$ \mathcal{O} (n^{2 - 2/d} \log n \log \log n \log^{*} n) $$ with an algorithm that is useless for practical purposes unless $$ n > 10^{24} $$.
- The Wikipedia article about Multi-objective optimization talks a lot about Pareto efficiency. Something worth reading up on later.
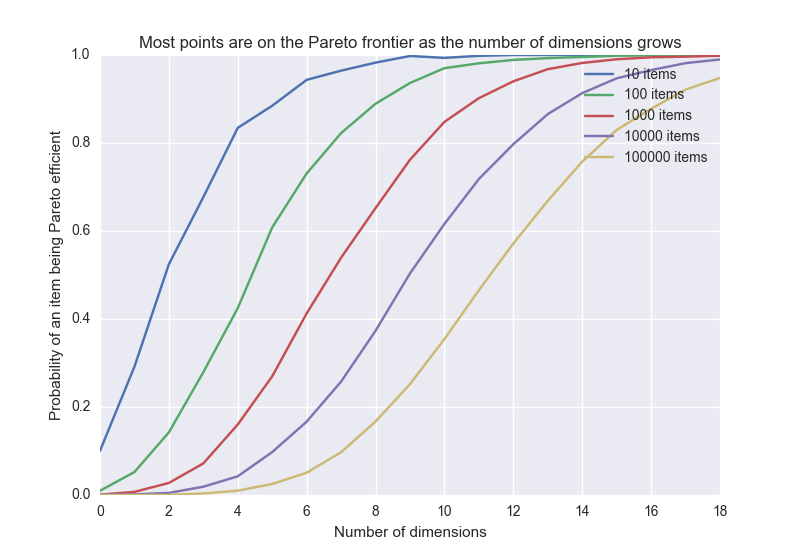
- The probability that a point is on the frontier goes towards 1 as the number of dimensions grows. I don’t know the exact relation but simulated this numerically (this assumes each dimension is independent):
Here are some various mental models I have that involve Pareto efficiency:
- I often think of Pareto efficiency in terms of decision making. The closer you get to the Pareto frontier (of the space of possible solutions), the harder it is to make any decision Pareto efficient. Meaning for almost all decisions, you’re going to have to sacrifice something. For instance when you do a big refactoring of a system it’s easy to get hung up on trying to preserve all features while adding a few new ones. In reality this is going to be extremely hard or impossible. If you can do it possibly it’s because you forgot to include some other axis in your analysis, like code complexity. It’s like pushing a balloon into a box.
- I think loss aversion may sometimes be explained by people trying to make Pareto efficient decisions.
- You could model why big companies are so slow to change course. Say Conglomerated Fruits, Inc is close or on the Pareto frontier in terms of how they allocate resources to fruit production. Now, turns out consumers are suddenly demanding Goji berries a lot more than bananas. Rationally the company should fire the Chief Banana Officer, shut down the banana division and reinvest all their money in goji berries. But because the Chief Banana Officer sits on the management team, this becomes and extremely hard thing to do. My conclusion from this silly example is that you should really think twice before assigning the responsibility of a functional area to a single person.
- Here’s another example: Amalgamated Travel Agency, Inc. runs a very profitable business selling flight tickets over phone. Some internet startups start selling flight tickets online. Of course, they think, a flight ticket is a huge transaction, and people want to talk to another human. Turns out buying flight tickets online is better along almost every other dimension except one. Amalgamated Travel Agency, Inc. dies because they don’t realize customers don’t need a Pareto efficient product improvement.
- A simple model for why buying decisions are so hard is that it involves Pareto effiency – market economy will drive out all TV’s that are dominated, leaving only the TV’s on the Pareto frontier. That makes it a lot harder as a consumer because now every choice will become a trade-off.
- I loved this blog post from 538 about Marco Rubio and the Pareto Frontier.
- When a deal is Pareto efficient and improves the outcome for everyone, it’s called a Coasean bargain.
- I think it’s helpful to think of competitive advantage in terms of Pareto efficiency. In a commodity industry like oil drilling, the number of dimensions to compete on is very small (eg. 1). So you will end up with a few very big companies. Whereas in something like clothing there’s a lot of dimensions, so you should expect a more fragmented market.
- For some moderate amount of dimensions, such as $$ d = 20 $$, if you have about $$ 7 \cdot 10^9 $$ items, then most of them will be Pareto efficient (assuming independence between factors). So let’s think about it for a while. It means that if we pick 7 billion people (the world’s population) and 20 somewhat independent factors (IQ, length, vision, income etc), then most of the world’s population is Pareto efficient. So it’s hard/impossible to find another person who is better than you at everything :sunglasses: