Why conversion matters: a toy model

There are often close relationships between top level business metrics. For instance, it’s well known that retention has a super strong impact on the valuation of a subscription business. Or that the % of occupied seats is super important for an airline. A fun little toy model that I can up with generates a curious relationship between conversion rates and revenue.
The intuition
Let’s look at an ecommerce company. I’m working at a company that does mortgage online, for instance.
My intuition is roughly:
- Higher conversion rates means more volume. That’s the obvious first order effect.
- Higher conversion rates means better unit economics, meaning you can now acquire a bunch of customers that previously did not make sense. You can keep growing volume until the marginal acquisition cost catches up with the new break even point.
Let’s formalize it and make some assumptions. We need to first assume something about how aquisition costs increases with volume. Marginal CAC (customer acquisition cost) is not constant, because you have to spend a little bit more effort for every lead you acquire. So we want to pick some function that grows pretty slowly.
Note that it’s very important not to confuse the marginal acquisition cost (the cost of acquiring user $$ n $$) with the average acquisition cost or the total acquisition cost. The total acquisition cost is the integral of the marginal acquisition cost so it will always grow more than linearly (since the marginal acquisition cost is non-decreasing).
The model
I’m going to go out on a limb here, and this is the model: the acquisition cost of lead $$ n $$ is proportional to $$ n^{0.4} $$. Let’s go through the math and then let get back to the (somewhat arbitrary) choice of function.
This function has the property that it’s reasonably slow-growing. With $$ n^{0.4} $$, the cost of acquiring lead #2000 is roughly 32% more than acquiring lead #1000.
Note that I’m saying the cost of lead $$ n $$, not user. The difference is that not all leads convert into users. The difference is the conversion rate. So the total cost of acquiring a user is $$ n^{0.4} / r $$ where $$ r $$ is the conversion rate.
We’re acquiring leads as long as we make money from them, so up until the marginal acquisition cost equals some constant (basically revenue minus auxiliary costs). So $$ n^{0.4} / r = C $$ and it follows that $$ n = (Cr)^{2.5} = \mathcal{O}( r^{2.5}) $$. The weird $$ \mathcal{O} $$ symbol is just fancy notation from computer science that means that you can ignore all the constants.
So this is pretty interesting. Basically it says if we improve the conversion rate by 20%, the total volume will increase by 58%. This is a highly nonlinear relationship between conversion rate and volume.
What about the total profit?
Ignoring all the fixed costs of running a company, the profit for each unit is some constant minus the acquisition cost:
$$ \int_0^n \left( C_1 - C_2 m^{0.4}/r \right) dm = \left[ C_1 m - C_2/1.4 m^{1.4}/r \right]_0^n = C_1 n - C_2/1.4 n^{1.4} / r $$
Plugging in the earlier expression for $$ n $$ we get
$$ = C_1 (r^{2.5}) - C_2/1.4 ((Cr)^{2.5})^{1.4} / r = C_3 r^{2.5} = \mathcal{O}(r^{2.5})$$
Magically this comes out to the same thing here – if you increase the conversion rate from say 5% to 6% (an increase by 20%), the total gross profit increases by 58%. If you double the conversion rate (which isn’t entirely unreasonable for an early-stage startup with an unoptimized conversion funnel), then the gross profit goes up by 5.7x. Kind of sweet, and again the same nonlinear relationship between two variables.
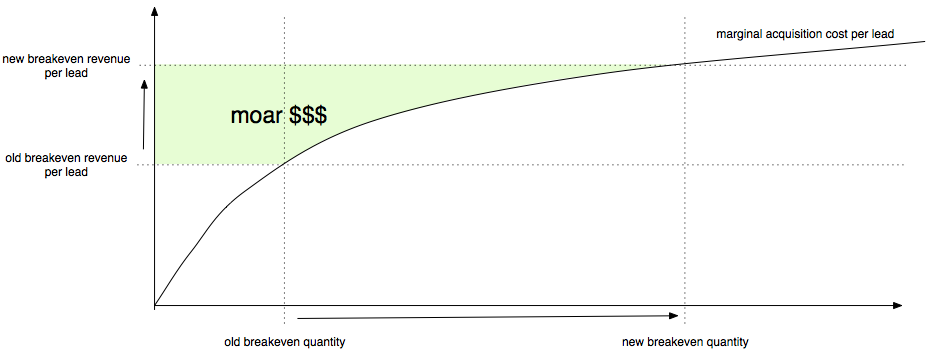
Graphical interpretation above. The “flatter” the acquisition curve is, the more the dollar gain is. That’s because a flat acquisition cost curve means we’re going to have to move the breakeven quantity very quickly to the right.
More ruminations
You don’t think $$ n^{0.4} $$ is reasonable? Fine, make it $$ \sqrt{n} $$. You can do the same thing but instead of $$ \mathcal{O}(r^{2.5}) $$, you end up with $$ \mathcal{O}(r^2) $$.
Of course, it doesn’t have to be a polynomial – logarithms are fine, as are exotic animals like the Lambert W function. In fact, in all those cases, the results are even more dramatic. The key thing here is that if we take a slow-growing function and invert it, we end up with a fast-growing function. As long as we pick a function that grows less than linearly, we get a superlinear relationship between conversion rate and gross profit.
So what’s the right choice of function? I really think this depends on the industry. If you’re selling pet rabbit tiaras, your total market size is pretty tiny, and the acquisition cost is going to shoot up very drastically once you exhausted it. The inverse of a function that shoots up is a function that stagnates, so your revenue as a function of conversion rate is almost flat.
But let’s say you’re selling mortgages (I am!) or groceries or gasoline. Then the market size is enormous and the acquisition cost will grow slowly going from user 1000 to user 10,000 to user 100,000. Anywhere we see a large company, that’s a sign that the marginal acquisition cost has to grow quite slowly (otherwise it would be prohibitively expensive to compete with smaller companies) and thus as a result you can also see that conversion rates will matter in a highly nonlinear way.
Feel free to poke a hole in this theory and by all means please let me know if you do!
Tagged with: startups, math