Hi! It’s your friendly project management theorician. You might remember me from blog posts such as Why software projects take longer than you think, which is a blog post I wrote a long time ago positing that software projects completion time follow a log-normal distribution.
We live in a year of about 350,000 amateur epidemiologists and I have no desire to join that “club”. But I read something about COVID-19 deaths that I thought was interesting and wanted to see if I could replicated it through data. Basically the claim is that Sweden had an exceptionally “good” year in 2019 in terms of influenza deaths causing there to be more deaths “overdue” in 2020.
Compensation has always been one of the most confusing parts of management to me. Getting it right is obviously extremely important. Compensation is what drives our entire economy, and you could look at the market for labor as one gigantic resource-allocating machine in the same way as people look at the stock market as a gigantic resource-allocating machine for investments.
Let’s consider a toy model where you’re hiring for two things and that those are equally valuable. It’s not very important what those are, so let’s just call them “thing A” and “thing B” for now. For one set of abilities, the scatter plot looks like this:
This is a blog post originally featured on the Better engineering blog. If you want to link to this article or share it, please go to the original post URL! Separately, I’m sorry it’s been so long with no posts on this blog. Between kids, moving, and being a startup CTO, I’ve been busy. I have a few posts coming down the pipe though, so stay tuned…
When I started building up a tech team for Better, I made a very conscious decision to pay at the high end to get people. I thought this made more sense: they cost a bit more money to hire, but output usually more than compensates for it. Many fellow CTOs, some went for the other side of the spectrum. This was a mystery to me, until it all made sense to me.
A modern tech stack typically involves at least a frontend and backend but relatively quickly also grows to include a data platform. This typically grows out of the need for ad-hoc analysis and reporting but possibly evolves into a whole oil refinery of cronjobs, dashboards, bulk data copying, and much more. What generally pushes things into the data platform is (generally) that a number of things are
Why? Because I’ve been sitting in 100,000,000 meetings where people endlessly debate whether the monthly number of widgets is going up or down, or whether widget method X is more productive than widget method Y. For almost any graph, quantifying the uncertainty seems useful, so I started trying. A few months later:
I have done roughly 2,000 interviews in my life. When I started recruiting, I had so much confidence in my ability to assess people. Let me just throw a couple of algorithm questions at a candidate and then I’ll tell you if they are good or not!
I’ve been reading up on operations research lately, including queueing theory. It started out as a way to understand the very complex mortgage process (I work at a mortgage startup) but it’s turned into my little hammer and now I see nails everywhere.
There are often close relationships between top level business metrics. For instance, it’s well known that retention has a super strong impact on the valuation of a subscription business. Or that the % of occupied seats is super important for an airline. A fun little toy model that I can up with generates a curious relationship between conversion rates and revenue.
I just spent a few days in Italy, on the Ligurian coast. Even though we were on the west side of Italy, the Mediterranean sea was to the east, because the house was situated on a long bay. But zooming in even more, there were parts of the coast that were even more twisted – to the point where it had turned a full 360 degress so you ended up having the sea to the west again.
I’ve written before about the importance of iterating quickly but I didn’t necessarily talk about some concrete things you can do. When I’ve built up the tech team at Better, I’ve intentionally optimized for fast iteration speed above almost everything else. What are some ways we did that?
How hard can it be to compute conversion rate? Take the total number of users that converted and divide them with the total number of users. Done. Except… it’s a lot more complicated when you have any sort of significant time lag.
I was reading yet another blog post titled “Why our team moved from <language X> to <language Y>” (I forgot which one) and I started wondering if you can generalize it a bit. Is it possible to generate a N * N contingency table of moving from language X to language Y?
Here’s a fun analysis that I did of the pitch (aka. frequency) of various languages. Certain languages are simply pronounced with lower or higher pitch. Whether this is a feature of the language or more a cultural thing is a good question, but there are some substantial differences between languages.
Pareto efficiency is a useful concept I like to think about. It often comes up when you compare items on multiple dimensions. Say you want to buy a new TV. To simplify it let’s assume you only care about two factors: price and quality. We don’t know what you are willing to pay for quality – but we know that everything else equals:
This isn’t a proof that the subway doesn’t run on time – in fact it might actually proves that the subway runs really well. The numbers indicate that it’s not worth waiting after 10 minutes, but it’s a rare event and usually involves something extraordinary like a multi-hour delay. You should roughly give up after some point related to the normal train frequency, and 10 minutes is not a lot at all. Conversely if the trains ran hourly, it probably would had been worth waiting an hour or more. My analysis gave me a lot of respect for the job MTA is doing.
As you may know, one of my (very geeky) interests is Approximate nearest neigbor methods, and I’m the author of a Python package called Annoy.
I’ve also built a benchmark suite called ann-benchmarks to compare different packages. Annoy was the world’s fastest package for a few months, but two things happened.
(I accidentally published an unfinished draft of this post a few days ago – sorry about that).
There’s a lot of sources preaching the benefits of dollar cost averaging, or the practice of investing a fixed amount of money regularly. The alleged benefit is that when the price goes up, well, then your stake is worth more, but if the price goes down, then you get more shares for the same amount of money. According to Wikipedia, it “minimises downside risk”, about.com says it “drastically reduces market risk”, and an article on Nasdaq.com claims that it’s a “smart investment strategy”.
Apparently MTA (the company running the NYC subway) has a real-time API. My fascination for the subway takes autistic proportions and so obviously I had to analyze some of the data. The documentation is somewhat terrible, but here’s some relevant code for how to use the API:
I’ve been spending several hundred bucks renting GPU instances on AWS over the last year. The speedup from a GPU is awesome and hard to deny. GPUs have taken over the field. Maybe following the footsteps of Bitcoin mining there’s some research on using FPGA (I know very little about this).
This is another post based on my talk at NYC Machine Learning. The previous two parts covered most of the interesting parts, but there are still some topics left to be discussed. To go back and read the meaty stuff, check out
This is a blog post rewritten from a presentation at NYC Machine Learning on Sep 17. It covers a library called Annoy that I have built that helps you do nearest neighbor queries in high dimensional spaces. In the first part, I went through some examples of why vector models are useful. In the second part I will be explaining the data structures and algorithms that Annoy uses to do approximate nearest neighbor queries.
This is a blog post rewritten from a presentation at NYC Machine Learning last week. It covers a library called Annoy that I have built that helps you do (approximate) nearest neighbor queries in high dimensional spaces. I will be splitting it into several parts. This first talks about vector models, how to measure similarity, and why nearest neighbor queries are useful.
Here’s a problem that I used to give to candidates. I stopped using it seriously a long time ago since I don’t believe in puzzles, but I think it’s kind of fun.
Let’s say you have a function that simulates a random coin flip. It returns “H” or “T”. This is the only random generator available. How can write a new function that simulates a random dice roll (1…6)?
Is there any method that guarantees that the second function returns in finite time?
Let’s say you want to do this $$ n $$ times where $$ n \to \infty $$ . What’s the most efficient way to do it? Efficient in terms of using the fewest amount of coin flips.
The first part is old, I think. The second and third part are follow up questions that I came up with.
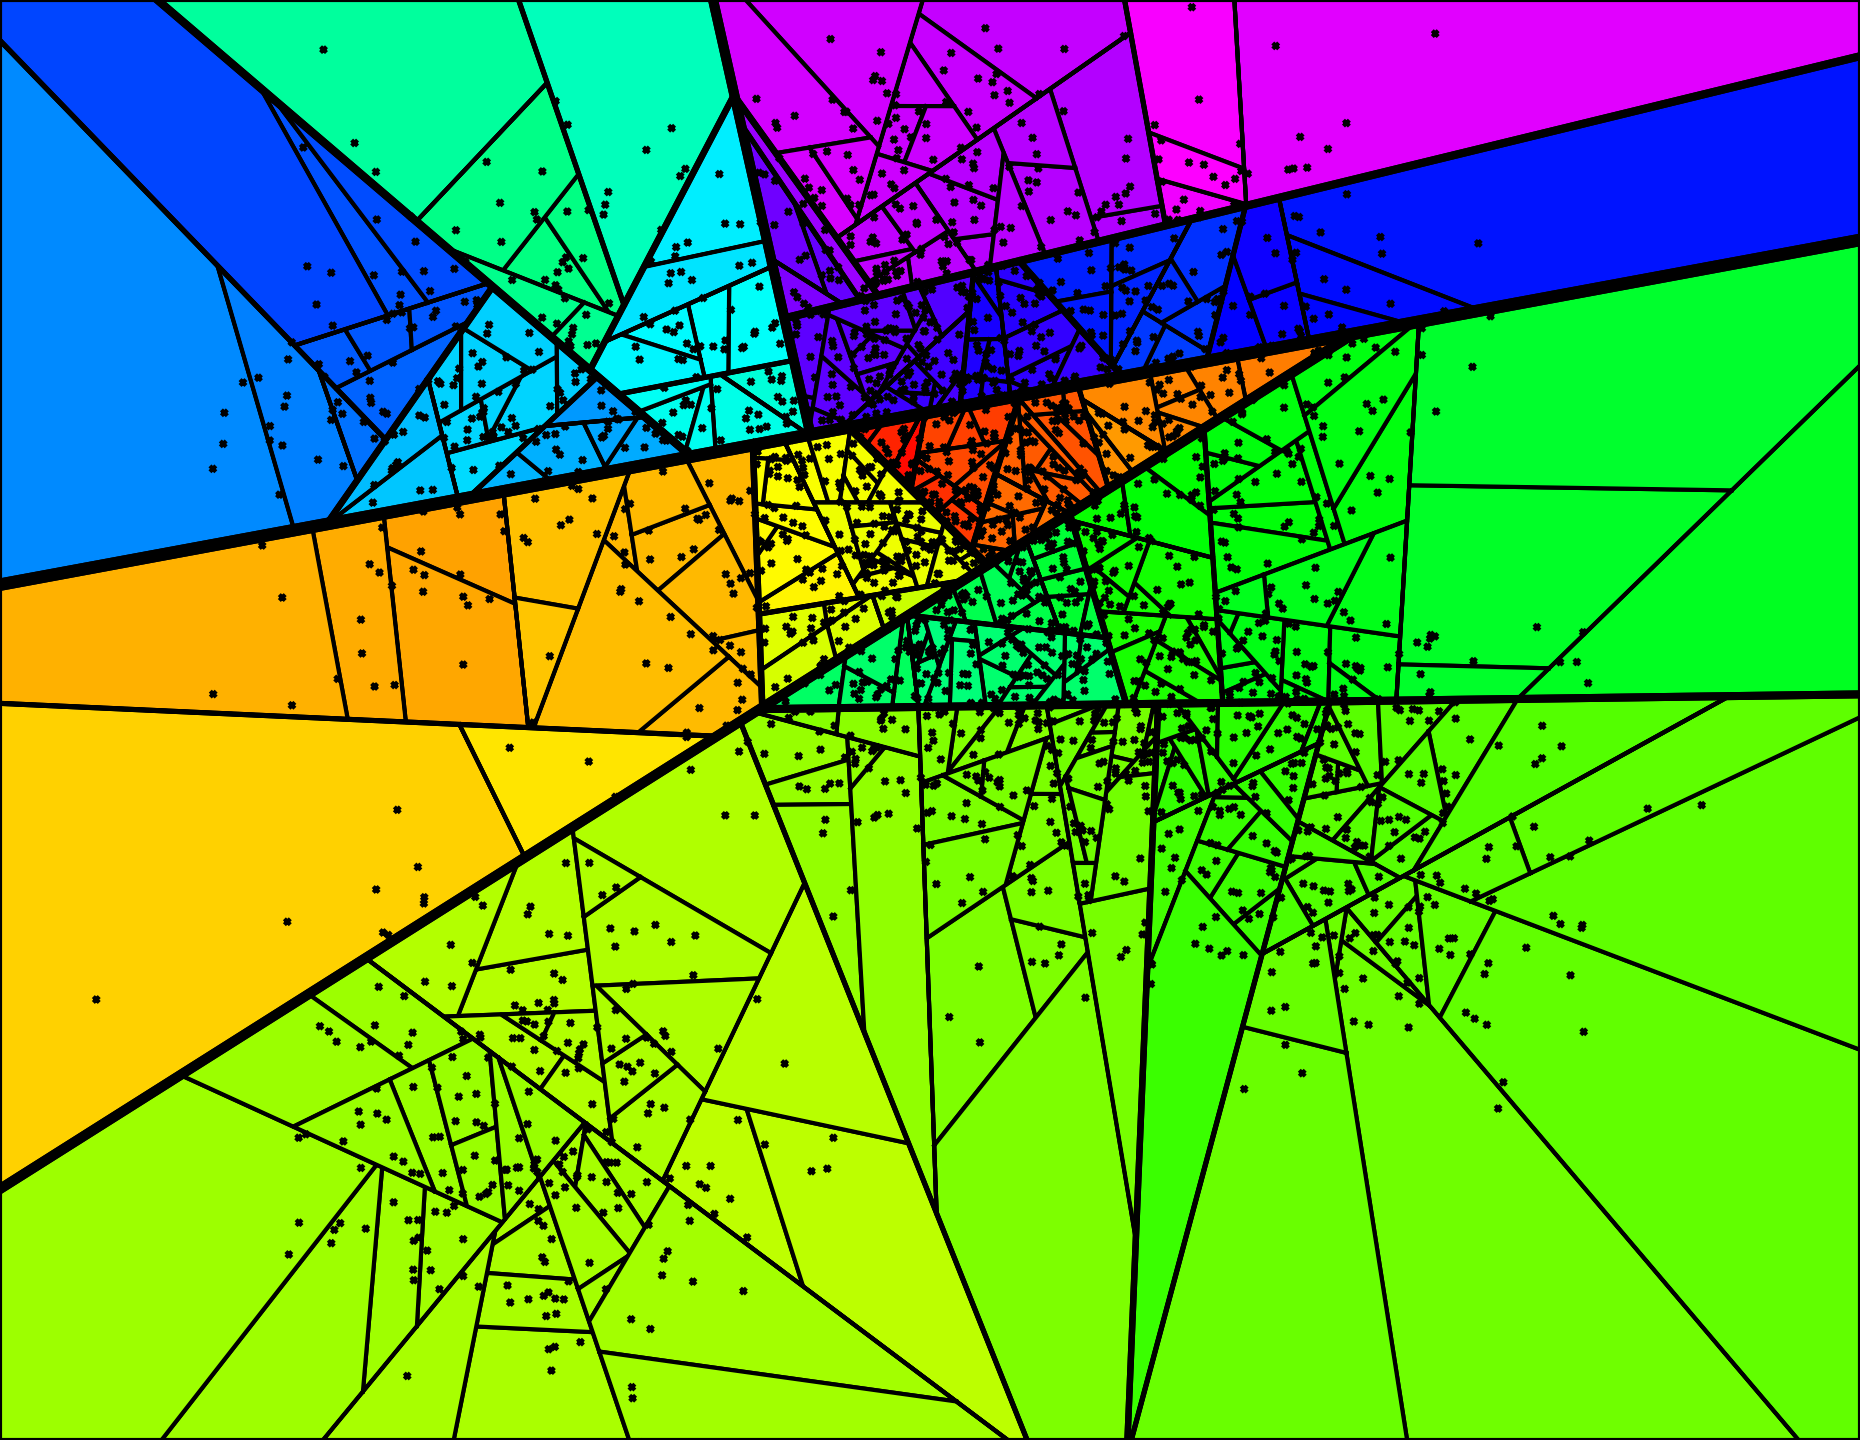
I have spent some time lately with D3. It’s a lot of fun to build interactive graphs. See for instance this demo (will provide a longer writeup soon).
D3 doesn’t have support for 3D but you can do projections into 2D pretty easily. It’s just old school computer graphics. I ended up adding an animated background to this blog based on an experiment. The math is simple.
The article describes a phenomenon unique to traffic where cars spread out when they go fast and get more compact when they go slow. That’s supposedly the explanation.
This is the last post about deep learning for chess/go/whatever. But this really cool paper by Christopher Clark and Amos Storkey was forwarded to me by Michael Eickenberg. It’s about using convolutional neural networks to play Go. The authors of the paper do a much better job than I would ever have done of modeling move prediction in Go and show that their model beat certain Go engines.
My previous blog post about deep learning for chess blew up and made it to Hacker News and a couple of other places. One pretty amazing thing was that the Github repo got 150 stars overnight. There was also lots of comments on the Hacker News post that I thought were really interesting. (See this skeptical comment for instance).
I’ve been meaning to learn Theano for a while and I’ve also wanted to build a chess AI at some point. So why not combine the two? That’s what I thought, and I ended up spending way too much time on it. I actually built most of this back in September but not until Thanksgiving did I have the time to write a blog post about it.
Say you build a machine learning model, like a movie recommender system. You need to optimize for something. You have 1-5 stars as ratings so let’s optimize for mean squared error. Great.
Then let’s say you build a new model. It has even lower mean squared error. You deploy it. This model turns out to give a lower mean squared error. You roll it out to users and the metrics are tanking. Crap! Ok so maybe mean squared error isn’t the right thing to optimize for.
Note: This is a silly application. Don’t take anything seriously.
Benford’s law describes a phenomenon where numbers in any data series will exhibit patterns in their first digit. For instance, if you took a list of the 1,000 longest rivers of Mongolia, or the average daily calorie consumption of mammals, or the wealth distribution of German soccer players, you will on average see that these numbers start with “1” about 30% of the time. I won’t attempt at proving this, but essentially it’s a result of scale invariance. It doesn’t apply to all numerical series, like IQ or shoe size, but this pattern turns out to pop up in a lot of places.
I’ve been spending quite some time lately playing around with RNN’s for collaborative filtering. RNN’s are models that predict a sequence of something. The beauty is that this something can be anything really – as long as you can design an output gate with a proper loss function, you can model essentially anything.
I wanted to share some more insight into the algorithms we use at Spotify. One matrix factorization algorithm we have used for a while assumes that we have user vectors $$ bf{a}_u $$ and item vectors $$ bf{b}_i $$ . The next track $$ i $$ for a user is now given by the relation
One thing I encountered today was a trick using bagging as a way to go beyond a point estimate and get an approximation for the full distribution. This can then be used to penalize predictions with larger uncertainty, which helps reducing false positives.
Sometimes you have to maximize some function $$ f(w_1, w_2, ldots, w_n) $$ where $$ w_1 + w_2 + ldots + w_n = 1 $$ and $$ 0 le w_i le 1 $$ . Usually, $$ f $$ is concave and differentiable, so there’s one unique global maximum and you can solve it by applying gradient ascent. The presence of the constraint makes it a little tricky, but we can solve it using the method of Lagrange multipliers. In particular, since the surface $$ w_1 + w_2 + ldots + w_n $$ has the normal $$ (1, 1, ldots, 1) $$ , the following optimization procedure works:
I just glanced at the paper, and there’s some cool stuff going on from a theoretical perspective. What I’m curious about is why they didn’t decide to use dimensionality reduction to solve such a big problem. The benefit of this approach is that it scales much better (linear in input data size) and produces much better results. The drawback is that it’s much harder to implement.
Something that pops up pretty frequently is to implement time decay, especially where you have recursive chains of jobs. For instance, say you want to keep track of a popularity score. You calculate today’s output by reading yesterday’s output, discounting it by $$ exp(-lambda Delta T) $$ and then adding some hit count for today. Typically you choose $$ lambda $$ so that $$ exp(-lambda Delta T) = 0.95 $$ for a day or something like that. We do this to generate popularity scores for every track at Spotify.