Why are new startups growing so fast?
Why is the wage distribution getting larger for software engineers?
Why do I love infrastructure?
Is open source dead?
I think a lot of these things, and some more things, all have their roots in a big shift in how we build software.
Or rather, how we buy software.
Software development today is a lot about using the right vendors rather than building technology yourself.
Writing code for a computer is hard enough.
You take something big and fuzzy, some large vague business outcome you want to achive.
Then you break it down recursively and think about all the cases until you have clear logical statements a computer can follow.
Computers are very good at following logical statements.
As I am en route to see my first total solar eclipse, I was curious how hard it would be to compute eclipses in Python.
It turns out, ignoring some minor coordinate system head-banging, I was able to get something half-decent working in a couple of hours.
CIA produced a fantastic book during the peak of World War 2 called Simple Sabotage. It laid out various ways for infiltrators to ruin productivity of a company. Some of the advice is timeless, for instance the section about “General interference with Organizations and Production”:
Long story short: I’m working on a super cool tool called Modal. Please check it out — it lets you run things in the cloud without having to think about infrastructure. Scaling out, scheduling, containerization, using GPUs, setting up webhooks, and all kinds of other stuff. It’s primarily meant for data teams. We aren’t quite live, but you can sign up for our waitlist.
This is is in many respects a successor to a
blog post I wrote last year
about what I want from software infrastructure, but the ideas morphed in my head into something sort of wider.
The genesis
I encountered AWS in 2006 or 2007 and remember thinking that it’s crazy — why would anyone want to put their stuff in someone else’s data center?
But only a couple of years later, I was running a bunch of stuff on top of AWS.
Hi! It’s your friendly project management theorician. You might remember me from blog posts such as Why software projects take longer than you think, which is a blog post I wrote a long time ago positing that software projects completion time follow a log-normal distribution.
This isn’t as much of a blog post as an elaboration of a tweet I posted the other day:
I think this specialization of data teams into 99 different roles (data scientist, data engineer, analytics engineer, ML engineer etc) is generally a bad thing driven by the fact that tools are bad and too hard to use
The backdrop is: you have been brought in to grow a tiny data team (4 people) at a mid-stage startup ($10M annual revenue), although this story could take place at many different types of companies.
Software infrastructure (by which I include everything ending with *aaS, or anything remotely similar to it) is an exciting field, in particular because (despite what the neo-luddites may say) it keeps getting better every year! I love working with something that moves so quickly.
I joined Better in early 2015 because I thought the team was crazy enough to actually change one of the largest industries in the US. For six years, I ran the tech team, hiring 300+ people, probably doing 2,000+ interviews, and according to GitHub I added 646,941 lines of code and removed 339,164. But I also got married, had two kids, bought an apartment and renovated it! From time to time, there was some intense periods of hard work.
It’s a popular attitude among developers to rant about our tools and how broken things are. Maybe I’m an optimistic person, because my viewpoint is the complete opposite! I had my first job as a software engineer in 1999, and in the last two decades I’ve seen software engineering changing in ways that have made us orders of magnitude more productive. Just some examples from things I’ve worked on or close to:
I spent a ton of time looking at different software providers, both as a CTO, and as a nerd “advanced” consumer who builds stuff in my spare time. In the last 10 years, there has been an order of magnitude more products that cater directly to developers, through APIs, SDKs, and tooling. I’m pretty psyched about this trend. As the cost of building software goes down, that drives up the demand for software engineers. That then drives up the demand for even more products built for software engineers. That then drives down the cost of building software even more!
We live in a year of about 350,000 amateur epidemiologists and I have no desire to join that “club”. But I read something about COVID-19 deaths that I thought was interesting and wanted to see if I could replicated it through data. Basically the claim is that Sweden had an exceptionally “good” year in 2019 in terms of influenza deaths causing there to be more deaths “overdue” in 2020.
Compensation has always been one of the most confusing parts of management to me. Getting it right is obviously extremely important. Compensation is what drives our entire economy, and you could look at the market for labor as one gigantic resource-allocating machine in the same way as people look at the stock market as a gigantic resource-allocating machine for investments.
Hanlon’s razor is a classic aphorism I’m sure you have heard before: Never attribute to malice that which can be adequately explained by stupidity.
I’ve found that neither malice nor stupidity is the most common reason when you don’t understand why something is in a certain way. Instead, the root cause is probably just that they didn’t have time yet. This happens all the time at startups (maybe a bit less at big companies, for reasons I’ll get back to).
Let’s consider a toy model where you’re hiring for two things and that those are equally valuable. It’s not very important what those are, so let’s just call them “thing A” and “thing B” for now. For one set of abilities, the scatter plot looks like this:
I recently finished the excellent book Kochland. This isn’t my first interest in Koch—I read The Science of Success by Charles Koch himself a couple of years ago.
Charles Koch inherited a tiny company in 1967 and turned it into one of the world’s largest ones. That’s impressive! Just a quick disclaimer just to get it out of the way. You may know the Koch brothers as the climate deniers who funded the Tea Party. I don’t understand this disconnect between being so brilliant in one field, and extremely ignorant in another. But my curiosity tells me there’s something worth learning from most notable people, despite what I may think of their opinions and Koch Industries turns out ot be a particularly interesting case study.
Just a quick note that my team is always hiring at Better. A lot of new people have been joining the team here in NYC lately—the tech team has actually grown from 35 to 60 in just ~3 months. We are primarily looking for senior software engineers and/or engineering managers. But we would love to talk if you have less experience too! Our main tech stack is mostly TypeScript and Python.
My company has a buffet every Friday, and the lines grow to epic proportions when the food arrives. I’ve suspected for years that the “classic” buffet line system is a deeply flawed and inefficient method, and every time I’m stuck in the line has made me more convinced.
No one asked for this, but I’m something like ~12 years into my career and have had my fair share of mistakes and luck so I thought I’d share some.
Honestly, I feel like I’ve mostly benefitted from luck. Some of the things I did on a whim turned out to be excellent choices many years later. Some of the things were clear blind spots in hindsight. If I could give my 12 years younger self a bunch of career advice, here are some of those things.
This is a blog post originally featured on the Better engineering blog. If you want to link to this article or share it, please go to the original post URL! Separately, I’m sorry it’s been so long with no posts on this blog. Between kids, moving, and being a startup CTO, I’ve been busy. I have a few posts coming down the pipe though, so stay tuned…
Anyone who built software for a while knows that estimating how long something is going to take is hard.
It’s hard to come up with an unbiased estimate of how long something will take, when fundamentally the work in itself is about solving something.
One pet theory I’ve had for a really long time, is that some of this is really just a statistical artifact.
When I started building up a tech team for Better, I made a very conscious decision to pay at the high end to get people. I thought this made more sense: they cost a bit more money to hire, but output usually more than compensates for it. Many fellow CTOs, some went for the other side of the spectrum. This was a mystery to me, until it all made sense to me.
A modern tech stack typically involves at least a frontend and backend but relatively quickly also grows to include a data platform. This typically grows out of the need for ad-hoc analysis and reporting but possibly evolves into a whole oil refinery of cronjobs, dashboards, bulk data copying, and much more. What generally pushes things into the data platform is (generally) that a number of things are
Why? Because I’ve been sitting in 100,000,000 meetings where people endlessly debate whether the monthly number of widgets is going up or down, or whether widget method X is more productive than widget method Y. For almost any graph, quantifying the uncertainty seems useful, so I started trying. A few months later:
This is a bit of a rant but I really don’t like software that invents its own query language. There’s a trillion different ORMs out there. Another trillion databases with their own query language. Another trillion SaaS products where the only way to query is to learn some random query DSL they made up.
I get bored reading management books very easily and lately I’ve been reading about a wide range of almost arbitrary topics. One of the lenses I tend to read through is to see different management styles in different environments.
As some of you may know, one of my side interests is approximate nearest neighbor algorithms. I’m the author of Annoy, a library with 3,500+ stars on Github as of today. It offers fast approximate search for nearest neighbors with the additional benefit that you can load data super fast from disk using mmap. I built it at Spotify to use for music recommendations where it’s still used to power millions (maybe billions) of music recommendations every day.
Ok, so I have to first preface this whole blog post by a few things:
I really struggle with the term microservices. I can’t put my finger on exactly why. Maybe because the term is hopelessly ill-defined, maybe because it’s gotten picked up by the hype train. Whatever. But I have to stick to some type of terminology so let’s just roll with it.
This blog post might be mildly controversial, but I’m throwing it out there because I’ve had this itchy feeling for so long and I can’t get rid of it. I respect it if you want to disagree vehemently, and maybe there’s something both of us can learn.
I have a weird story. My first “real” company, Spotify, used a service-oriented architecture from scratch. I also spent some time at Google which used a service-oriented architecture. So basically since 2006 I’ve been continuously working in what people now call a “microservice architecture”. It didn’t even occur to me that some people might want to build things as monoliths. So I guess I’m coming at it from a different direction than many other. Either way, there were particular non-standard reasons why Spotify and Google had to do this that I’ll get back to later.
I have done roughly 2,000 interviews in my life. When I started recruiting, I had so much confidence in my ability to assess people. Let me just throw a couple of algorithm questions at a candidate and then I’ll tell you if they are good or not!
I’ve been reading up on operations research lately, including queueing theory. It started out as a way to understand the very complex mortgage process (I work at a mortgage startup) but it’s turned into my little hammer and now I see nails everywhere.
I started writing this blog in late 2012, partly because I felt like it would help me improve my English and my writing skills, partly because I kept having a lot of random ideas in my head and I wanted to write them down somewhere. I honestly never cared too much about finding a particular niche, I just wanted to write down stuff that I found interesting. I set up a Wordpress blog on my crappy Swedish virtual private server.
One of my super nerdy interests include approximate algorithms for nearest neighbors in high-dimensional spaces. The problem is simple. You have say 1M points in some high-dimensional space. Now given a query point, can you find the nearest points out of the 1M set? Doing this fast turns out to be tricky.
I’m interrupting the regular programming for a quick announcement: we’re looking for data engineers at Better. You would be the first one to join and would work a lot directly with me.
Some fun things you could work on (these are all projects I’m working on right now):
Turns out having a toddler isn’t super compatible with reading. I used to read ~100 books/year as a teenager, but it has slowly deteriorated to maybe 20-30 books, at most. And I don’t even finish all of them because life is too short! Some books are just not that interesting. So what were some of the books worth mentioning?
I spent a few days during the holidays fixing up a bunch of semi-dormant open source projects and I have a couple of blog posts in the pipeline about various updates. First up, I made a number of fixes to Git of Theseus which is a tool (written in Python) that generates statistics about Git repositories. I’ve written about it previously on this blog. The name is a horrible pun (I’m a dad!) on Ship of Theseus which is a philosophical thought experiment about what happens if you replace every single part of a boat — is it still the same boat ⁉️ 🤔
I spent six years at a company that went from 50 people to 1500 and one contributing factor leading to my departure was that I went from a “maker” to a person stuck in meetings every day. It wasn’t that I wanted to do that, but everyone else kept dragging me into meetings.
I had an interesting idea a few weeks ago, best explained through an example. Let’s say you’re running an e-commerce site (I kind of do) and you want to optimize the number of purchases.
Let’s also say we try to learn as much as we can from users, both using A/B tests but also using just basic slicing and dicing of the data. We are looking at how many people convert (buy our widgets) but a constant problem is there’s just too much uncertainty.
I’ve been a bit bad at posting things with a regular cadence lately, partly because I’m trying to adjust to having a toddler, partly because the hunt for clicks has caused such a high bar for me that I feel like I have to post something Pulitzer-worthy. But things are always cooking, so let’s break this pattern with a quick notice on something I’ve been working on!
There are often close relationships between top level business metrics. For instance, it’s well known that retention has a super strong impact on the valuation of a subscription business. Or that the % of occupied seats is super important for an airline. A fun little toy model that I can up with generates a curious relationship between conversion rates and revenue.
A funny thing about being a foreigner is how you realize people take broken things for granted. I’m going to go out on a limb here claiming that the US has a pretty dumb banking system. I could talk about it all day, but right now I want to focus on a very particular piece of it: how to verify your identity online.
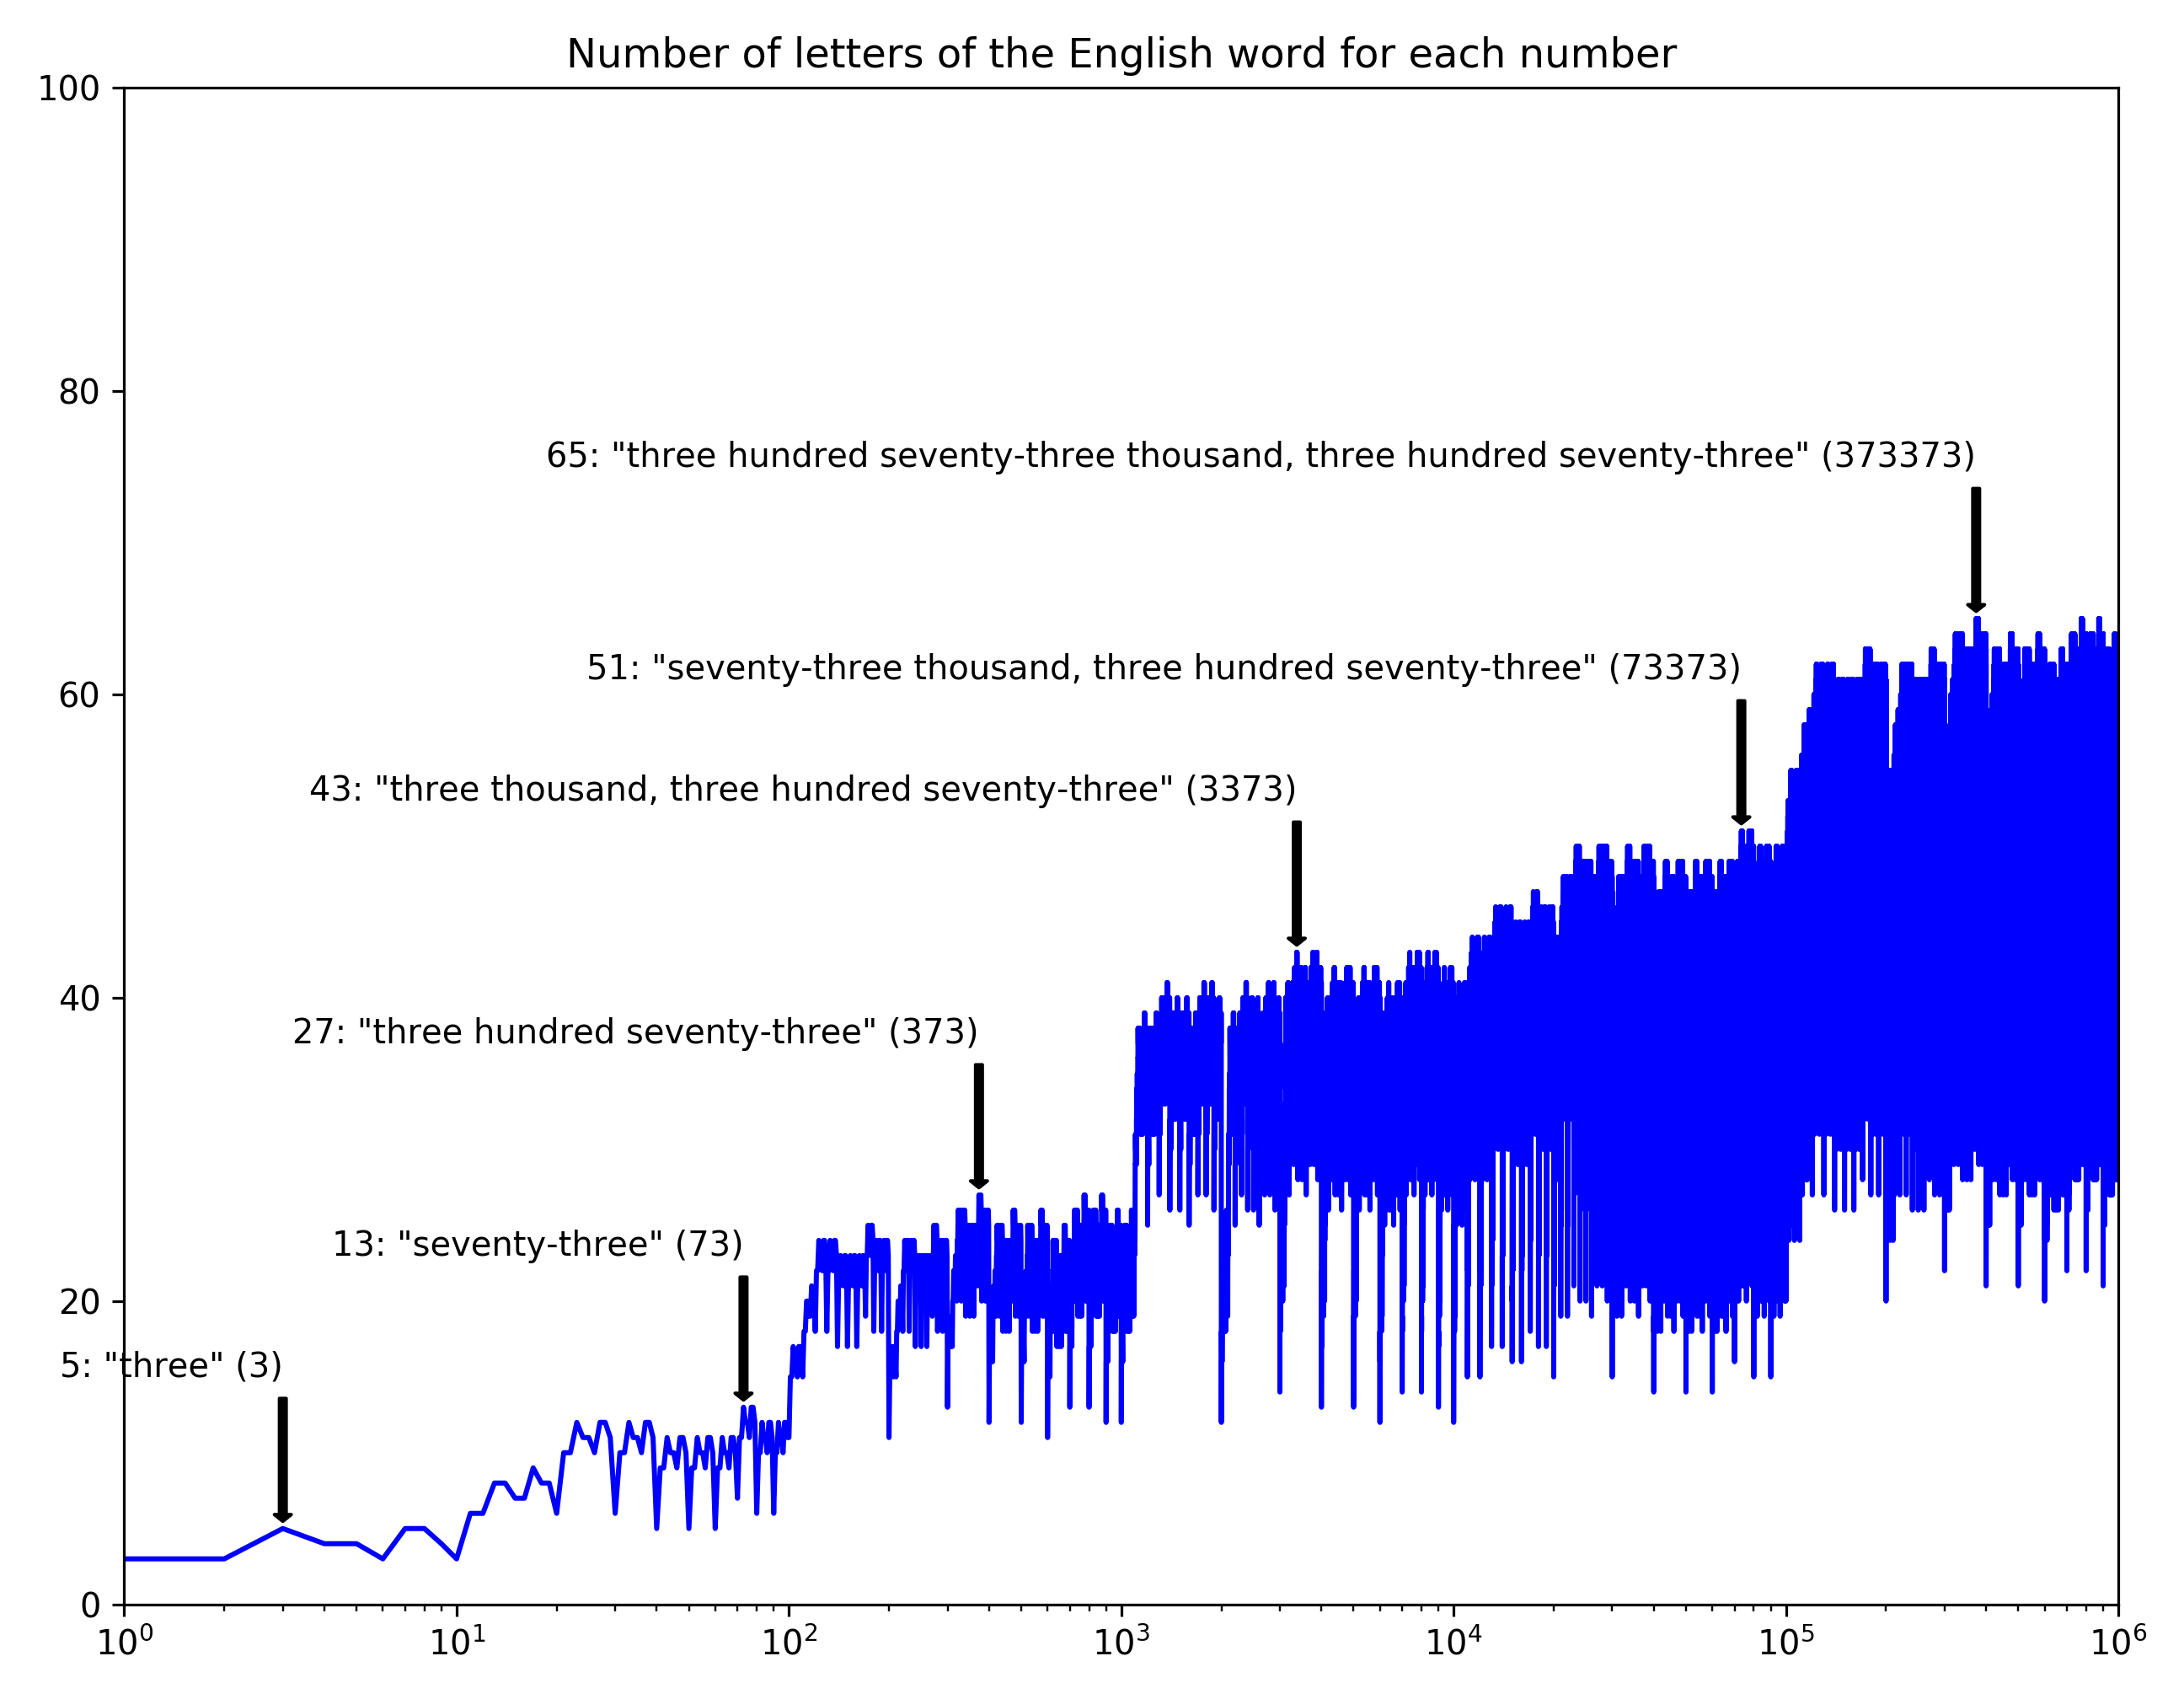
Just for fun, I generated these graphs of the number of letters in the word for each number. I really spent about 10 minutes on this (ok…possibly also another 40 minutes tweaking the plots):
Here’s a dumb extremely accurate rule I’m postulating* for software engineering projects: you need at least 3 examples before you solve the right problem.
This is what I’ve noticed:
Don’t factor out shared code between two classes. Wait until you have at least three.
The two first attempts to solve a problem will fail because you misunderstood the problem. The third time it will work.
Any attempt at being smart earlier will end up overfitting to coincidental patterns.
(Note that #1 and #2 are actually pretty different implications. But let’s get back to that later.)
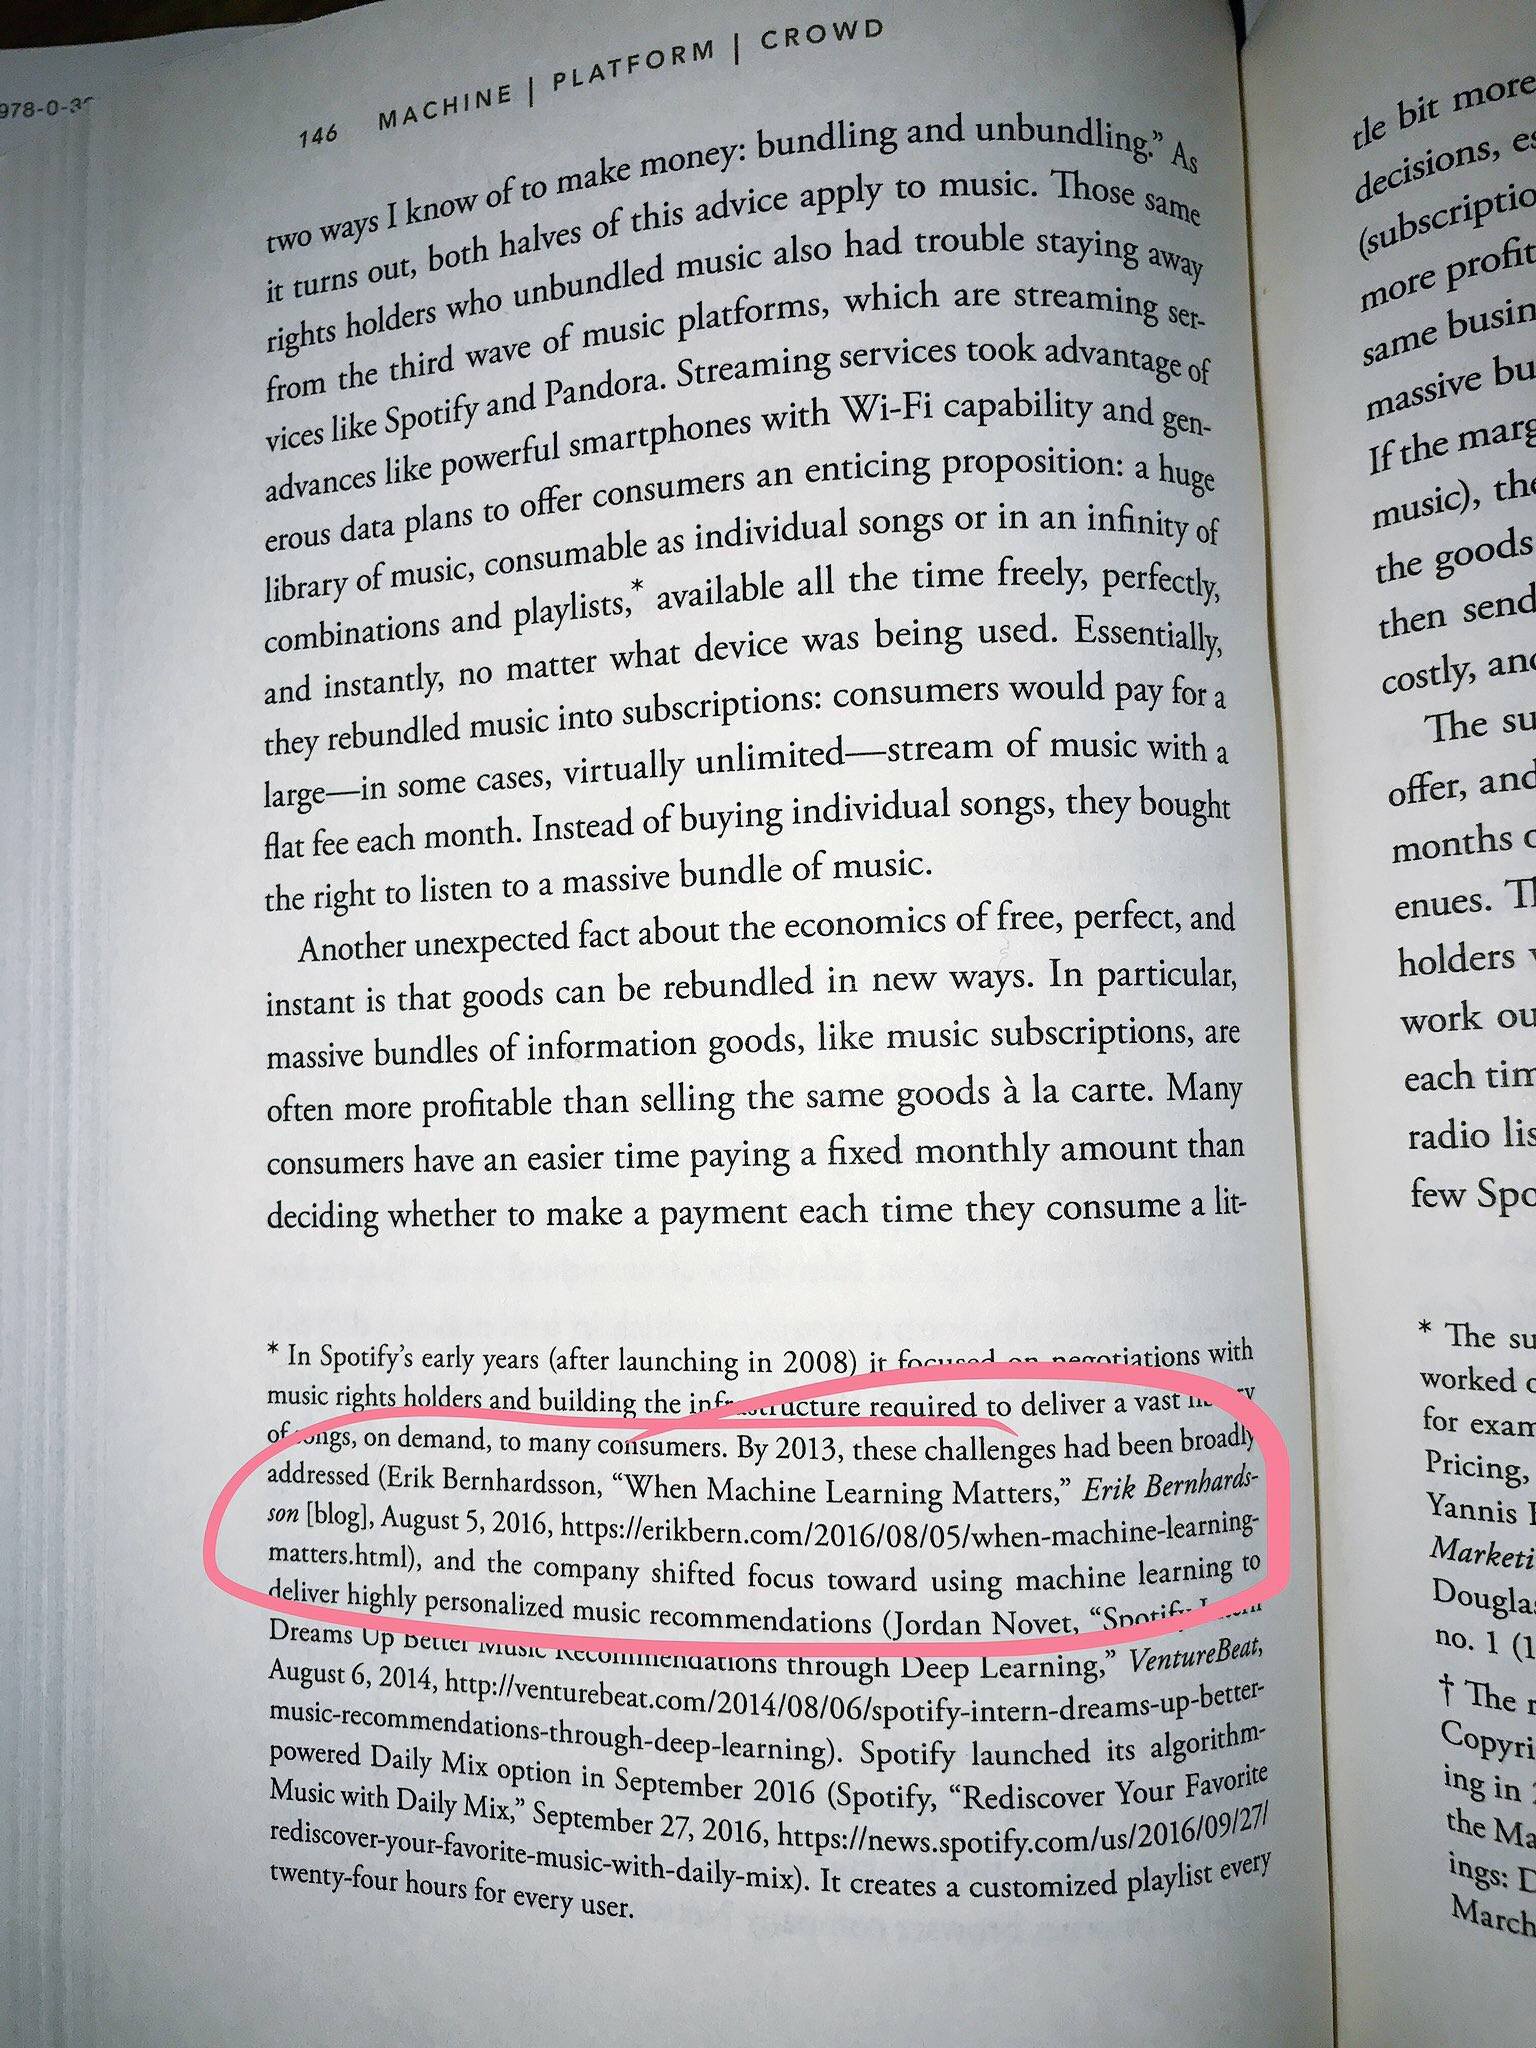
Ok, I lied a little bit. I didn’t discover it serendipitously. Someone actually emailed me saying I was mentioned, and so I ordered the book for same-day delivery. But I was seriously planning to read the book anyway – having read both The Second Machine Age and Rage Against the Machine – they are great books and I’m not being biased.
There’s about 765 million blog posts about the diversity “memo” that leaked out of Google a couple of weeks ago. I think the case for any biological difference is pretty weak, and it bothers me when people refer to an “interest gap” as anything else than caused by the environment. Maybe because I have a daughter, maybe because I have too many female friends who told me stories how they were held back or discriminated against.
I just spent a few days in Italy, on the Ligurian coast. Even though we were on the west side of Italy, the Mediterranean sea was to the east, because the house was situated on a long bay. But zooming in even more, there were parts of the coast that were even more twisted – to the point where it had turned a full 360 degress so you ended up having the sea to the west again.
I’ve written before about the importance of iterating quickly but I didn’t necessarily talk about some concrete things you can do. When I’ve built up the tech team at Better, I’ve intentionally optimized for fast iteration speed above almost everything else. What are some ways we did that?
Remember when everyone had a really ugly blog with a blogroll? Anyway, just think the word is funny.
I follow a few hundred blogs using Feedly and Reeder and have been reading a few hundred thousand blog posts over the last 10 years. Here’s some stuff I think everyone should follow. Not going to share a million blogs, just a few top ones. That way you don’t have to think about it, just subscribe to all of it:
How hard can it be to compute conversion rate? Take the total number of users that converted and divide them with the total number of users. Done. Except… it’s a lot more complicated when you have any sort of significant time lag.
I’ve read about 100 management books by now but if there’s something that always bothered me it’s the lack of first principles thinking. Basically it’s a ton of heuristics. And heuristics are great, but when you present heuristics as true objectives, it kind of clouds the underlying objectives (and you end up with weird proxy cults like the Agile movement 👹 – not that I disagree with it, I just wish they could derive it from a more systematic understanding of project management).
I was reading yet another blog post titled “Why our team moved from <language X> to <language Y>” (I forgot which one) and I started wondering if you can generalize it a bit. Is it possible to generate a N * N contingency table of moving from language X to language Y?
I just realized last Thursday that I have spent two full years at Better, incidentally on the same day as we announced a $15M round led by Kleiner Perkins. So it was a good point to reflect a bit and think back – what the F led me to abandon my role managing the machine learning team at Spotify? To join some random startup in the world’s most boring industry? So here’s my justification why I love being where I am:
Here’s a fun analysis that I did of the pitch (aka. frequency) of various languages. Certain languages are simply pronounced with lower or higher pitch. Whether this is a feature of the language or more a cultural thing is a good question, but there are some substantial differences between languages.
This is a pretty dumb post, in which I argue that functional programming has a lot of the bad parts of libertarianism and a lot of the good parts:
Both ideologies strive to eliminate [the] state. (ok, dumb dad joke)
Both ideologies are driven by a set of dogmatic axioms rather than a practical goal:
Libertarianism wants to reduce the government because any involvement distorts free markets. I always struggled to see what the underlying objective function is (it doesn’t seem to be maximization of people’s utility). 🤔
Functional programming wants to reduce side effects and make everything pure, often by enforcing onerous type systems. But why? Again I don’t see an ultimate objective here. IMO it should start from the principle that the goal of a programming language should be to make the programmers as productive as possible. For instance, the little research that exists has shown that most bugs have little to with typing and I’d expect something similar to apply to mutable state. In fact the largest class seems to be poor error handling(ok, typing isn’t necessarily related to FP, but in practice I find that strong typing and FP have highly overlapping fan clubs).
Both camps invoke obscure cases in history as a proof of success: libertarianists (more so anarchists I guess) often talks about Spain during the civil war, Somalia, or sometimes Singapore. Haskell acolytes are very eager to bring up Facebook’s spam filtering.
YET – and this is the surprising part imho – both ideologies are ~90% correct (source: my opinion). Which really surprises me given that they start from a (imo) arbitrary set of axioms.
Even if you are a die hard bolshevik, you benefit from an understanding of how interventions distort markets, how incentives matter, and how entrepreneurship is the driver of progress.
Even if you are coding in Visual Basic, you can level up your skills by learning FP: making functions pure when needed, avoid state, avoid reassign variables, avoid mutable data structures, write pipelines of data transformations, and all that jazz that FP has taught us to cherish.
As a project evolves, does the new code just add on top of the old code? Or does it replace the old code slowly over time? In order to understand this, I built a little thing to analyze Git projects, with help from the formidable GitPython project. The idea is to go back in history historical and run a git blame (making this somewhat fast was a bit nontrivial, as it turns out, but I’ll spare you the details, which involve some opportunistic caching of files, pick historical points spread out in time, use git diff to invalidate changed files, etc).
This blog post Data sets are the new server rooms makes the point that a bunch of companies raise a ton of money to go get really proprietary awesome data as a competitive moat. Because once you have the data, you can build a better product, and no one can copy it (at least not very cheaply). Ideally you hit a virtuous cycle as well, where usage of your system once it takes of gives even more data, which makes the system even better, which attracts more users…
Pareto efficiency is a useful concept I like to think about. It often comes up when you compare items on multiple dimensions. Say you want to buy a new TV. To simplify it let’s assume you only care about two factors: price and quality. We don’t know what you are willing to pay for quality – but we know that everything else equals:
I generally haven’t written much about software architecture. People make heuristics into religion. But here is something I thought about: how to build in self-correction into systems. This has been something just vaguely sitting in my head lacking a clear conceptual definition until a whole slew of things popped up today that all had the exact same issue at its core. I’m going to refer to it as state drift lacking a better term for it.
I joined Spotify in 2008 to focus on machine learning and music recommendations. It’s easy to forget, but Spotify’s key differentiator back then was the low-latency playback. People would say that it felt like they had the music on their own hard drive. (The other key differentiator was licensing – until early 2009 Spotify basically just had all kinds of weird stuff that employees had uploaded. In 2009 after a crazy amount of negotiation the music labels agreed to try it out as an experiment. But I’m getting off topic now.)
This isn’t a proof that the subway doesn’t run on time – in fact it might actually proves that the subway runs really well. The numbers indicate that it’s not worth waiting after 10 minutes, but it’s a rare event and usually involves something extraordinary like a multi-hour delay. You should roughly give up after some point related to the normal train frequency, and 10 minutes is not a lot at all. Conversely if the trains ran hourly, it probably would had been worth waiting an hour or more. My analysis gave me a lot of respect for the job MTA is doing.
As you may know, one of my (very geeky) interests is Approximate nearest neigbor methods, and I’m the author of a Python package called Annoy.
I’ve also built a benchmark suite called ann-benchmarks to compare different packages. Annoy was the world’s fastest package for a few months, but two things happened.
I’ve been trying to learn Clojure. I keep telling people I meet that I really want to learn Clojure, but still every night I can’t get myself to spend time with it. It’s unclear if I really want to learn Clojure or just want to have learned Clojure?
(I accidentally published an unfinished draft of this post a few days ago – sorry about that).
There’s a lot of sources preaching the benefits of dollar cost averaging, or the practice of investing a fixed amount of money regularly. The alleged benefit is that when the price goes up, well, then your stake is worth more, but if the price goes down, then you get more shares for the same amount of money. According to Wikipedia, it “minimises downside risk”, about.com says it “drastically reduces market risk”, and an article on Nasdaq.com claims that it’s a “smart investment strategy”.
One of my favorite business hobbies is to reduce some nasty decision down to its absolute core objective, decide the most basic strategy, and then add more and more modifications as you have to confront the complexity of reality (yes I have very lame hobbies thanks I know).
Apparently MTA (the company running the NYC subway) has a real-time API. My fascination for the subway takes autistic proportions and so obviously I had to analyze some of the data. The documentation is somewhat terrible, but here’s some relevant code for how to use the API:
I do a lot of recruiting and have given maybe 50 offers in my career. Although many companies do, I never put a deadline on any of them. Unfortunately, I’ve often ended up competing with other companies who do, and I feel really bad that this usually tricks younger developers into signing offers. On numerous occasions, I’ve gotten an email halfway through the interview process
(This is not a very relevant/useful post for regular readers – feel free to skip. I thought I would share it so people can find it on Google.)
My blog blew up twice in a week earlier this year when I landed on Hacker News. The first time I was asleep so I didn’t notice that the site went down. The second time I did notice, and scrambled to reconfigure Apache & MySQL to handle the load.
Here’s a conclusion I’ve made building consumer products for many years: the speed at which a company innovates is limited by its iteration speed.
I don’t even mean throughput here. I just mean the cycle time. Invoking Little’s law this is also related to the total inventory of features not being deployed yet.
I’ve been spending several hundred bucks renting GPU instances on AWS over the last year. The speedup from a GPU is awesome and hard to deny. GPUs have taken over the field. Maybe following the footsteps of Bitcoin mining there’s some research on using FPGA (I know very little about this).
My blog post about fonts generated lots of traffic – it landed on Hacker News, took down my site while I was sleeping, and then obviously vanished from HN before I woke up. But it also got retweeted by a ton of people.
For some reason I decided one night I wanted to get a bunch of fonts. A lot of them. An hour later I had a bunch of scrapy scripts pulling down fonts and a few days later I had more than 50k fonts on my computer.
The easiest way to be a 10x engineer is to make 10 other engineers 2x more efficient. Someone can be a 10x engineer if they do nothing for 364 days then convinces the team to change programming language to a 2x more productive language.
A motivated 10x engineer in one team could be a demotivated 0.5x engineer in another team (and vice versa).
A average 1x engineer could easily become a 5x engineer if surrounded by 10x engineers. Engagement and work ethics is contagious.
The cynical reason why 10x engineers aren’t paid 10x more salary is that there is no way for the new employer to know. There is no “10x badge”.
…but also, a 10x engineer can go to a new company and become an 1x engineer because of bad focus / bad engagement / tech stack mismatch.
So unfortunately there’s less economic rationality for companies to pay 10x salaries to 10x engineers (contrary to what Google or Netflix says)
There’s no such thing as a 10x engineer spending time on something that never ends up delivering business value. If something doesn’t deliver business value, it’s 0x.
If you build something that the average engineer would not have been able to build, no matter how much time, that can make you 100x or 1000x, or ∞x. Quoting Alexander Scott: There is no number of ordinary eight-year-olds who, when organized into a team, will become smart enough to beat a grandmaster in chess.
Most of the 10x factor is most likely explained by team and company factors (process, tech stack, etc) and applies to everyone in the team/company. Intra-team variation is thus much smaller than 10x (even controlling for the fact that companies tend to attract people of equal caliber). Nature vs nurture…
I’ve never met the legendary “10x jerk”. Anecdotally the outperforming engineers are generally nice and humble.
Don’t get hung up on the exact numbers here, it’s just for illustration purposes. I.e. someone introduced a bug in the trading system of Knight Capital that made them lose $465M in 30 minutes. Did that make it a -1,000,000x engineer? (and btw it had more to do with company culture). The numbers aren’t meant to be taken literally.
Early last year when I left Spotify I decided to do more reading. I was planning to read at least one book per week and in particular I wanted to brush up on management, economics, and technology. 2015 was also a year of exclusively non-fiction, which is a pretty drastic shift, since I grew up reading fiction compulsively for 20 years.
I’ve been obsessed with how to iterate quickly based on small scale feedback lately. One awesome website I encountered is Usability Hub which lets you run 5 second tests. Users see your site for 5 seconds and you can ask them free-form questions afterwards. The nice thing is you don’t even have to build the site – just upload a static png/jpg and collect data.
As Yogi Berra said, “It’s tough to make predictions, especially about the future”. Unfortunately predicting is hard, and unsurprisingly people look for the Magic Trick™ that can resolve all the uncertainty. Whether it’s recruiting, investing, system design, finding your soulmate, or anything else, there’s always an alleged shortcut.
Curious about Google’s newly released TensorFlow? I don’t have a beefy GPU machine, so I spent some time getting it to run on EC2. The steps on how to reproduce it are pretty brutal and I wouldn’t recommend going through it unless you want to waste five hours of your live.
I haven’t mentioned what I’m currently up to. Earlier this year I left Spotify to join a small startup called Better. We’re going after one of the biggest industries in the world that also turns out to be completely broken. The mortgage industry might not be the #1 industry you pictured yourself in, but it’s an enormous opportunity to fix a series of real consumer problems and join a company that I predict will be huge.
The other day I was looking at marketing spend broken down by channel and wanted to compute some simple uncertainty estimates. I have data like this:
<th>
  Total spend
</th>

<th>
  Transactions
</th>
Channel A
<td>
  2292.04
</td>

<td>
  9
</td>
Channel B
<td>
  1276.85
</td>

<td>
  2
</td>
Channel C
<td>
  139.59
</td>

<td>
  3
</td>
Channel D
<td>
  954.98
</td>

<td>
  5
</td>
Of course, it’s easy to compute the cost per transaction, but how do you produce uncertainty estimates? Turns out to be somewhat nontrivial. I don’t even think it’s possible to do a t-test, which is kind of interesting in itself.
I was featured in Peadar Coyle’s interview series interviewing various “data scientists” – which is kind of arguable since (a) all the other ppl in that series are much cooler than me (b) I’m not really a data scientist. Anyway, reposting the full interview:
This is another post based on my talk at NYC Machine Learning. The previous two parts covered most of the interesting parts, but there are still some topics left to be discussed. To go back and read the meaty stuff, check out
This is a blog post rewritten from a presentation at NYC Machine Learning on Sep 17. It covers a library called Annoy that I have built that helps you do nearest neighbor queries in high dimensional spaces. In the first part, I went through some examples of why vector models are useful. In the second part I will be explaining the data structures and algorithms that Annoy uses to do approximate nearest neighbor queries.
This is a blog post rewritten from a presentation at NYC Machine Learning last week. It covers a library called Annoy that I have built that helps you do (approximate) nearest neighbor queries in high dimensional spaces. I will be splitting it into several parts. This first talks about vector models, how to measure similarity, and why nearest neighbor queries are useful.
A couple of people in my old team have been around talking about how Spotify does music recommendations and put together some quite good presentations.
I was playing around with D3 last night and built a silly visualization of antipodes and how our intuitive understanding of the world sometimes doesn’t make sense. Check out the visualization at bl.ocks.org!
Basically the idea is if you fly from Beijing to Buenos Aires then you can have a layover at any point of the Earth’s surface and it won’t make the trip longer.
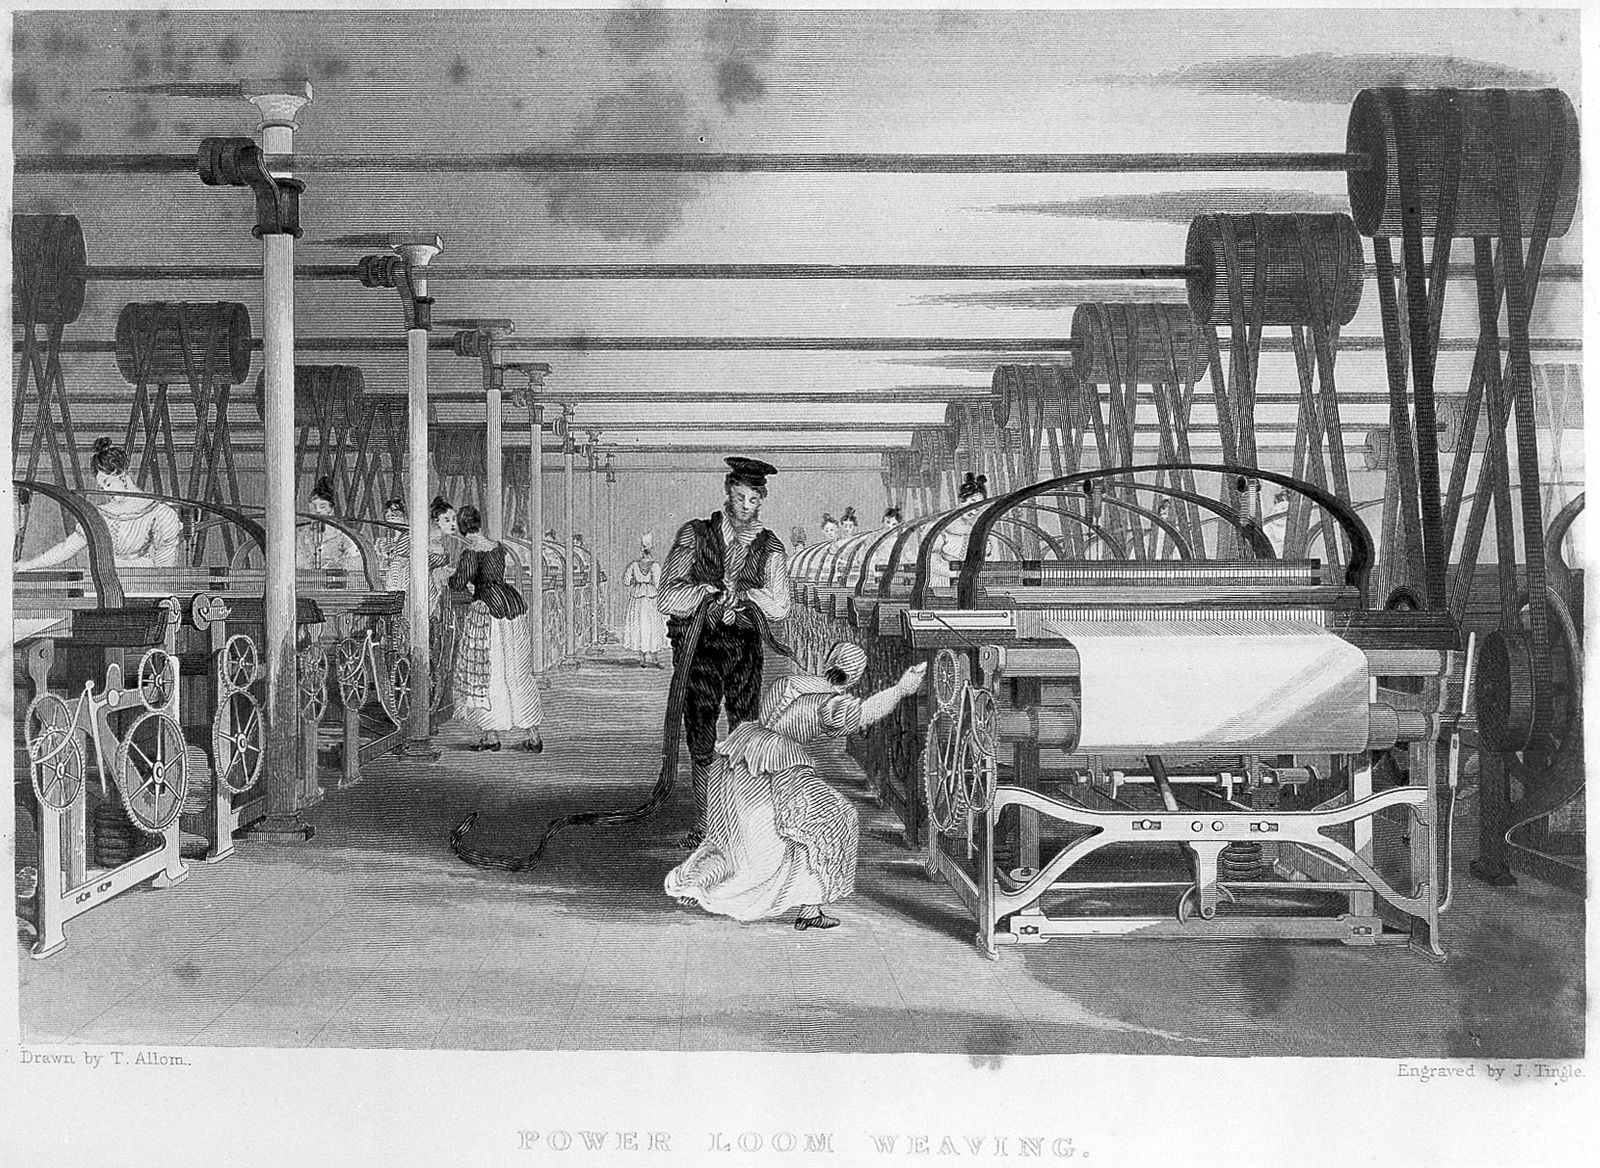
Every once in a while when talking to smart people the topic of automation comes up. Technology has made lots of occupations redundant, so what’s next?
Switchboard operator, a long time ago
What about software engineers? Every year technology replaces parts of what they do. Eventually surely everything must be replaced? I just ran into another one of these arguments: Software Engineers will be obsolete by 2060.
Here’s a problem that I used to give to candidates. I stopped using it seriously a long time ago since I don’t believe in puzzles, but I think it’s kind of fun.
Let’s say you have a function that simulates a random coin flip. It returns “H” or “T”. This is the only random generator available. How can write a new function that simulates a random dice roll (1…6)?
Is there any method that guarantees that the second function returns in finite time?
Let’s say you want to do this $$ n $$ times where $$ n \to \infty $$ . What’s the most efficient way to do it? Efficient in terms of using the fewest amount of coin flips.
The first part is old, I think. The second and third part are follow up questions that I came up with.
Annoy is a library written by me that supports fast approximate nearest neighbor queries. Say you have a high (1-1000) dimensional space with points in it, and you want to find the nearest neighbors to some point. Annoy gives you a way to do this very quickly. It could be points on a map, but also word vectors in a latent semantic representation or latent item vectors in collaborative filtering.
The workflow engine battle has intensified with some more interesting entries lately! Here are a couple I encountered in the last few days. I love that at least two of them are direct references to Luigi!
I have spent some time lately with D3. It’s a lot of fun to build interactive graphs. See for instance this demo (will provide a longer writeup soon).
D3 doesn’t have support for 3D but you can do projections into 2D pretty easily. It’s just old school computer graphics. I ended up adding an animated background to this blog based on an experiment. The math is simple.
Note: this post is full of pseudo-psychology and highly speculative content. Like most fun stuff!
I became a manager back in 2009. Being a developer is fun. You have this very tangible way to measure yourself. Did I deploy something today? How much code did I write today? Did I solve some really cool machine learning problem on paper?
The article describes a phenomenon unique to traffic where cars spread out when they go fast and get more compact when they go slow. That’s supposedly the explanation.
Annoy is a C++/Python package I built for fast approximate nearest neighbor search in high dimensional spaces. Spotify uses it a lot to find similar items. First, matrix factorization gives a low dimensional representation of each item (artist/album/track/user) so that every item is a k-dimensional vector, where k is typically 40-100. This is then loaded into an Annoy index for a number of things: fast similar items, personal music recommendations, etc.
There’s a bunch of companies working on machine learning as a service. Some old companies like Google, but now also Amazon and Microsoft.
Then there’s a ton of startups: PredictionIO ($2.7M funding), BigML ($1.6M funding), Clarifai, etc, etc. Here’s a nice map from Bloomberg showing some of the landscape.
Wow I guess it was more than a year ago that I tweeted this. Crazy how time flies by. Anyway, here’s my rationale:
When I update one line of code I feel like I have to put in a long explanation about its side effects, why it’s fully backwards compatible, and why it fixes some issue #xyz.
When I refactor 500 lines of code, I get too lazy to write anything sensible, so I just put “refactoring FooBarController”. Note: don’t do at home!
I decided to plot the relationship for Luigi:
{% include 2015-02-26-the-relationship-between-commit-size-and-commit-message-size.html %}
For most people straight out of school, work life is a bit of a culture shock. For me it was an awesome experience, but a lot of the constraints were different and I had to learn to optimize for different things. It wasn’t necessarily the technology that I struggled with. The hardest part was how to manage my own projects and my time, as well as how to grow and make impact as an engineer. I’ve listed some of my biggest mistakes, which are also mistakes I see other (mostly junior) engineers make.
Febrary 6 was my last day at Spotify. In total I spent more than six years at Spotify and it was an amazing experience.
I joined Spotify in Stockholm in 2008, mainly because a bunch of friends from programming competitions had joined already. Their goal to change music consumption seemed ridiculous at that point, but six years later I think it’s safe to say they actually succeeded.
I just made it to Sweden suffering from jet lag induced insomnia, but this blog post will not cover that. Instead, I will talk a little bit about technical debt.
The concept of technical debt always resonated with me, partly because I always like the analogy with “real” debt. If you take the analogy really far, there are some curious implications. I always like to think of the “interest rate” of software development. Debt is really just borrowing from the future, with some interest rate. You are getting a free lunch right now, but you need to pay back 1.2 free lunches in a few months. That’s the interest rate. In a software project the equivalent could be to pick a database that will have scalability issues later, or to make all member variables of some class public. You are doing it because it makes it easier to do things now but you will have to pay the cost of that later.
There you go. Fun for your work emails for the next 500 years. From the awesome movie Hackers. That movie together with The Warriors convinced me that I wanted to live in NYC when I was like… 14 years old.
I was talking with some data engineers at Spotify and had a moment of nostalgia.
2008
I was writing my master’s thesis at Spotify and had to run a Hadoop job to extract some data from the logs. Every time I started running the job, I kept hearing this subtle noise. I kept noticing the correlation for a few days but I was too intimidated to ask. Finally people starting cursing that their machines had gotten really slow lately and I realized we were running Hadoop on the developer’s desktop machines. No one had told me. I think back then we had only GB’s of log data. I remember running less on the log and I would recognize half the usernames because they were my friends.
This is the last post about deep learning for chess/go/whatever. But this really cool paper by Christopher Clark and Amos Storkey was forwarded to me by Michael Eickenberg. It’s about using convolutional neural networks to play Go. The authors of the paper do a much better job than I would ever have done of modeling move prediction in Go and show that their model beat certain Go engines.
My previous blog post about deep learning for chess blew up and made it to Hacker News and a couple of other places. One pretty amazing thing was that the Github repo got 150 stars overnight. There was also lots of comments on the Hacker News post that I thought were really interesting. (See this skeptical comment for instance).
I’ve been meaning to learn Theano for a while and I’ve also wanted to build a chess AI at some point. So why not combine the two? That’s what I thought, and I ended up spending way too much time on it. I actually built most of this back in September but not until Thanksgiving did I have the time to write a blog post about it.
Say you build a machine learning model, like a movie recommender system. You need to optimize for something. You have 1-5 stars as ratings so let’s optimize for mean squared error. Great.
Then let’s say you build a new model. It has even lower mean squared error. You deploy it. This model turns out to give a lower mean squared error. You roll it out to users and the metrics are tanking. Crap! Ok so maybe mean squared error isn’t the right thing to optimize for.
I keep forgetting to buy a costume for Halloween every year, so this year I prepared and got myself a Luigi costume a month in advance. Only to realize I was going to be out of town the whole weekend. If anyone wants a Luigi costume, let me know!
I spent a couple of hours this weekend going through some pull requests and issues to Annoy, which is an open source C++/Python library for Approximate Nearest Neighbor search.
I set up Travis-CI integration and spent some time on one of the issues that multiple people had reported. At the end of the day, it turns out the issue was actually caused by a bug in GCC 4.8. Some crazy compiler optimization introduced between 4.6 and 4.8 caused this loop to be removed:
I’m at RecSys 2014, meeting a lot of people and hanging out at talks. Some of the discussions here was about the filter bubble which prompted me to formalize my own thoughts.
I firmly believe that it’s the role of a system to respect the user’s intent. Any sensible system will optimize for user’s long-term happiness by providing info back to the user that s/he finds useful. This holds true as long as a system isn’t (a) stupid and recommends the wrong content (b) trying to push its own agenda, that may or may not be hidden.
Note: This is a silly application. Don’t take anything seriously.
Benford’s law describes a phenomenon where numbers in any data series will exhibit patterns in their first digit. For instance, if you took a list of the 1,000 longest rivers of Mongolia, or the average daily calorie consumption of mammals, or the wealth distribution of German soccer players, you will on average see that these numbers start with “1” about 30% of the time. I won’t attempt at proving this, but essentially it’s a result of scale invariance. It doesn’t apply to all numerical series, like IQ or shoe size, but this pattern turns out to pop up in a lot of places.
Inspired by Sander Dieleman’s internship at Spotify, I’ve been playing around with deep learning using Theano. Theano is this Python package that lets you define symbolic expressions (cool), does automatic differentiation (really cool), and compiles it down into bytecode to run on a CPU/GPU (super cool). It’s built by Yoshua Bengio’s deep learning team up in Montreal.
Many years ago, I used to think that A/B tests were foolproof and all you need to do is compare the metrics for the two groups. The group with the highest conversion rate wins, right?
I’ve been spending quite some time lately playing around with RNN’s for collaborative filtering. RNN’s are models that predict a sequence of something. The beauty is that this something can be anything really – as long as you can design an output gate with a proper loss function, you can model essentially anything.
One obvious thing to anyone living in NYC is how tourists cluster in certain areas. I was curious about the larger patterns around this, so I spent some time looking at data. The thing I wanted to understand is: what areas are dominated by tourists? Or conversely, what areas are dominated by locals?
During my time at Spotify, I’ve reviewed thousands of resumes and interviewed hundreds of people. Lots of them were rejected but lots of them also got offers. Finally, I’ve also had my share of offers rejected by the candidate.
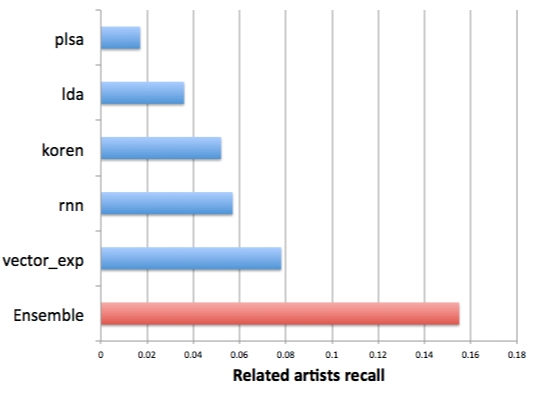
From my presentation at MLConf, one of the points I think is worth stressing again is how extremely well combining different algorithms works.
In this case, we’re training machine learning algorithms on different data sets (playlists, play counts, sessions) and different objectives (least squares, max likelihood). Then we combine all the models using gradient boosted decision trees training on a smaller but higher quality data set. Finally, we validate on a third data set, in this case looking at recall for a ground truth data set of related artists.
Just spent a day at MLConf where I was talking about how we do music recommendations. There was a whole range of great speakers (actually almost 2/3 women which was pretty cool in itself).
Scrolling through the Discover page on Spotify the other day it occurred to me that the album is in fact a fairly strong visual proxy for what kind of content you can expect from it. I started wondering if the album cover can in fact be used for recommendations. For many obvious reasons this is a kind of ridiculous idea, but still interesting enough that I just had to explore it a bit. So, I embarked on a journey to see how far I could get in a few hours.
So Luigi, our open sourced workflow engine in Python, just recently passed 1,000 stars on Github, then shortly after passed mrjob as (I think) the most popular Python package to do Hadoop stuff. This is exciting!
In case you missed it, we just acquired a company called Echo Nest in Boston. These people have been obsessed with understanding music for the past 8 years since it was founded by Brian Whitman and Tristan Jehan out of MIT Medialab.
Haven’t posted anything in ages, so here’s a quick hack I threw together in Python on a Sunday night. Basically I wanted to know whether momentum strategies work well for international stock indexes. I spent a bit of time putting together a strategy that buys the stock index if the return during the previous n days was positive, otherwise doesn’t do anything. I ran this strategy for a basket of approximately 20 stock markets.
We run a ton of A/B tests at Spotify and we look at a ton of metrics. Defining metrics is a little bit of an art form. Ideally you want to define success metrics before you run a test to avoid cherry picking metrics. You also want to define a metric that has as high signal to noise ratio. And of course, most importantly, your metric should ideally correlate to high level business impact as much as possible.
Radim Rehurek has put together an excellent summary of approximate nearest neighbor libraries in Python. This is exciting, because one of the libraries he’s covering, annoy, was built by me.
I wanted to share some more insight into the algorithms we use at Spotify. One matrix factorization algorithm we have used for a while assumes that we have user vectors $$ bf{a}_u $$ and item vectors $$ bf{b}_i $$ . The next track $$ i $$ for a user is now given by the relation
I think it’s funny how MS at some point realized they are not the cool kids and there’s no reason to appeal to that target audience. Their new marketing strategy finally admits what’s been long known: the correlation between “business casual” and using Microsoft products:
One thing I encountered today was a trick using bagging as a way to go beyond a point estimate and get an approximation for the full distribution. This can then be used to penalize predictions with larger uncertainty, which helps reducing false positives.
A lot of people have asked me what models we use for recommendations at Spotify so I wanted to share some insights. Here’s benchmarks for some models. Note that we don’t use all of them in production.
Btw I just put something up online that I spent a couple of evenings in my couch putting together: it’s a website where you can track any numerical data on the web. Want to know how many Twitter followers you have? Temperature in NYC? Go to statself.com and start tracking it.
A lot of people these days know about collaborative filtering. It’s that Netflix Prize thing, right? People rate things 1-5 stars and then you have to predict missing ratings.
While there’s no doubt that the Netflix Prize was successful, I think it created an illusion that all recommender systems care about explicit 1-5 ratings and RMSE as the objective. Some people even distrust me when I talk about the approach we take at Spotify.
****Spotify crunches hundreds of billions of streams to analyze user’s music taste and provide music recommendations for its users. We will discuss how the algorithms work, how they fit in within the products, what the problems are and where we think music discovery is going. The talk will be quite technical with a focus on the concepts and methods, mainly how we use large scale machine learning, but we will also some aspects of music discovery from a user perspective that greatly influenced the design decisions.
Of course, every media type is different. For instance, there’s fundamental reasons why latent factor models works really well for music and movies, as opposed to location recommendations where I suspect graph based models are more powerful. People recommendations is another animal and I’m sure beer recommendations has its own domain-specific quirks.
(Looks a little weird in the iframe but check out the link). It’s based on a LDA model with 200 topics, so the artists tend to stick to clusters where each cluster is a topic. The embedding also uses t-SNE but in three dimensions (obviously).
I’m at KDD in Chicago for a few days. We have a Spotify booth tomorrow, and I wanted to put together some cool graphics to show. I’ve been thinking about doing a 2D embedding of the top artists forever since I read about t-SNE and other papers so this was a perfect opportunity to spend some time on it.
I’ve turned into a lazy bastard and I’m just posting presentations on this blog, but here’s one from Rohan Singh at Spotify talking about the backend infrastructure of the Discover page.
I was just at the NYC Predictive Analytics meetup talking about how we build machine learning algorithms using Hadoop to power music recommendations.
Great meetup, where we had two speakers, me and Blake Shaw from Foursquare. Blake talked about how they use machine learning at Foursquare, using Hadoop (and Luigi), and he uploaded his slides here!
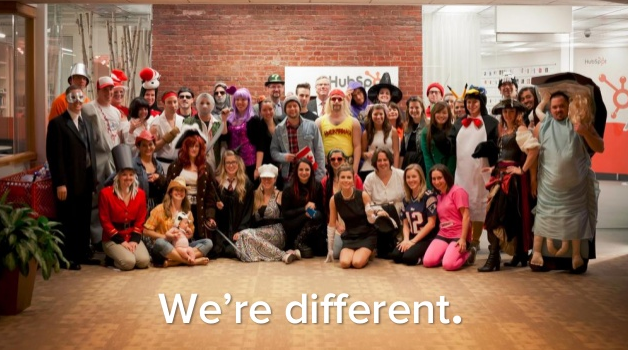
I thought this article about the company culture at HubSpot is kind of funny. “HubSpot’s Awesome Presentation Shows how to Create a 21st Century Culture”.
Just FYI: You’re not different. You’re a bunch of white hipsters aged 25-30 dressed up in the same theme. That’s not being different.
Sometimes you have to maximize some function $$ f(w_1, w_2, ldots, w_n) $$ where $$ w_1 + w_2 + ldots + w_n = 1 $$ and $$ 0 le w_i le 1 $$ . Usually, $$ f $$ is concave and differentiable, so there’s one unique global maximum and you can solve it by applying gradient ascent. The presence of the constraint makes it a little tricky, but we can solve it using the method of Lagrange multipliers. In particular, since the surface $$ w_1 + w_2 + ldots + w_n $$ has the normal $$ (1, 1, ldots, 1) $$ , the following optimization procedure works:
Just open sourced hdfs2cass which is a Hadoop job (written in Java) to do efficient Cassandra bulkloading. The nice thing is that it queries Cassandra for its topology and uses that to partition the data so that each reducer can upload data directly to a Cassandra node. It also builds SSTables locally etc. Not an expert at Cassandra so I’ll stop describing those parts before I embarrass myself.
We had an unconference at Spotify last Thursday and I added a semi-trolling semi-serious topic about abolishing documentation. Or NoDoc, as I’m going to call this movement. This was meant to be mostly a thought experiment, but I don’t see it as complete madness.
I’ve been obsessed with Wikipedia for the past ten years. Occasionally I find some good articles worth sharing and that’s why I created the wikiphilia Twitter handle. Just a long stream of stuff that for one reason or another may be interesting.
The Discovery page, the new start page in Spotify, is finally out to a fairly significant percentage of all users. Really happy since we have worked on it for the past six months. Here’s a screen shot:
I was browsing around on the Internet and the physics geek in me started reading about Fermat’s principle. And suddenly something came back to me that I’ve been trying to suppress for many years – how I never understood why there’s anything fundamental about the principal of least time.
Just promoting Spotify stuff here: check out the Snakebite repo on Github, written by Wouter de Bie. It’s a super fast tool to access HDFS over CLI/Python, by accessing the namenode directly over sockets/protobuf.
Spotify’s developer blog features a nice blog post outlining what it’s useful for. I think this kicks ass and there will definitely be some kind of Luigi integration coming up at some point
I picked up an issue of Foreign Affairs while flying back to NYC from SFO. It features this long interview with U.S. General Stanley McChrystal and I thought it was pretty interesting how striking some of the similarities are between fighting in a war and developing software.
Annoy is a simple package to find approximate nearest neighbors (ANN) that I just put on Github. I’m not trying to compete with existing packages, but Annoy has a couple of features that makes it pretty useful. Most importantly, it uses very little memory and can put everything in a contiguous blob that you can mmap from disk. This way multiple processes can share the same index.
TL;DR Their approach is pretty interesting. Everything is a Pig workflow and then they do everything as UDF’s.
This approach seems pretty interesting. As long as your data can be expressed as small atomic machine learning functions, I’m sure it works great. But there’s so much more than that. All small slicing, transforming etc is so much easier to express in a language like Python. I’m still not really comfortable with Pig as a language to power these data flows.
This article from today in Mashable describes some of the fun stuff I get to work with:
Erik Bernhardsson is technical lead at Spotify, where he helped to build a music recommendation system based on large-scale machine learning algorithms, mainly matrix factorization of big matrices using Hadoop. He moved into this role after heading the Business Intelligence team, where he collected, aggregated and made sense of all the data at Spotify, whether that’s ad-hoc insights, A/B testing, visualization or ad optimization.
Slides from the talk. Slightly edited because (a) some of the slides make little sense taken out of context (b) Slideshare seem to have problem converting some of the stuff.
The Economist just published an article called The best, the worst and the ugly. By looking at historical performance for mutual funds, they find strong support for momentum and mean reversion. Picking the best or the worst fund over the previous five years gives great returns over the next five years.
I just glanced at the paper, and there’s some cool stuff going on from a theoretical perspective. What I’m curious about is why they didn’t decide to use dimensionality reduction to solve such a big problem. The benefit of this approach is that it scales much better (linear in input data size) and produces much better results. The drawback is that it’s much harder to implement.
Not sure how I managed to miss this, but I’m watching this Tumblr presentation and they talk about their projects named after Arrested Development topics: Gob, Parmesan, Buster, Jetpants, Oscar, George and Motherboy.
Still, the best software project name is probably still Apple’s BHA.
Something that pops up pretty frequently is to implement time decay, especially where you have recursive chains of jobs. For instance, say you want to keep track of a popularity score. You calculate today’s output by reading yesterday’s output, discounting it by $$ exp(-lambda Delta T) $$ and then adding some hit count for today. Typically you choose $$ lambda $$ so that $$ exp(-lambda Delta T) = 0.95 $$ for a day or something like that. We do this to generate popularity scores for every track at Spotify.
I’m shamelessly promoting my first major open source project. Luigi is a Python module that helps you build complex pipelines of batch jobs, handle dependency resolution, and create visualizations to help manage multiple workflows. It also comes with Hadoop support built in (because that’s where really where its strength becomes clear).


